. 2016 Jun 16;12(6):e1004994.
doi: 10.1371/journal.pcbi.1004994. eCollection 2016 Jun.

Formal Models of the Network Co-occurrence Underlying Mental Operations

Affiliations

Formal Models of the Network Co-occurrence Underlying Mental Operations

Danilo Bzdok et al. PLoS Comput Biol. .

Abstract

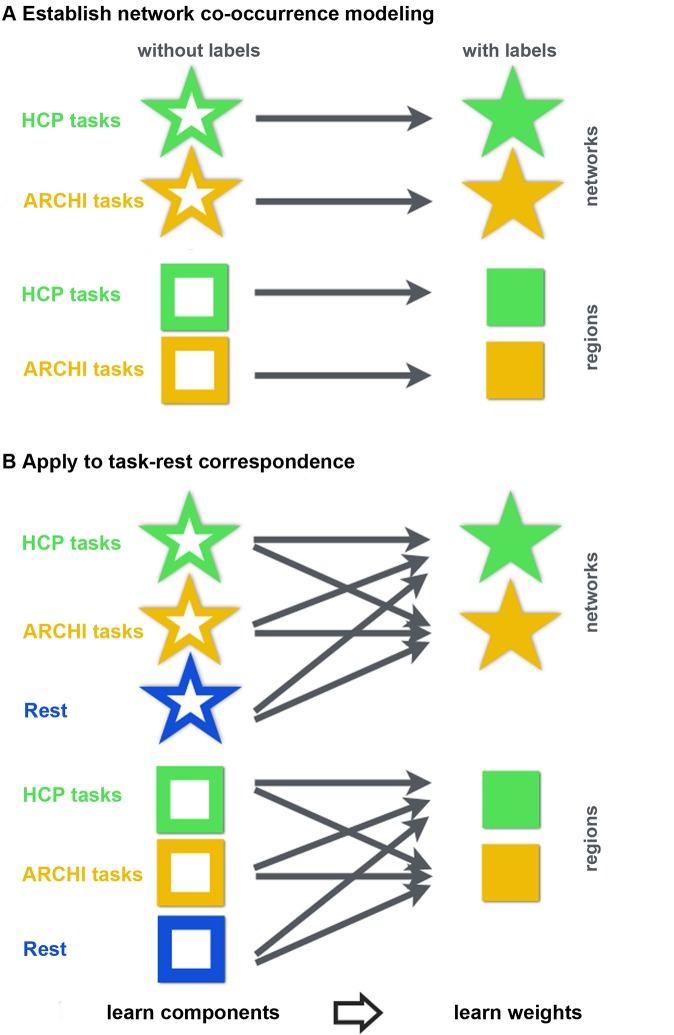
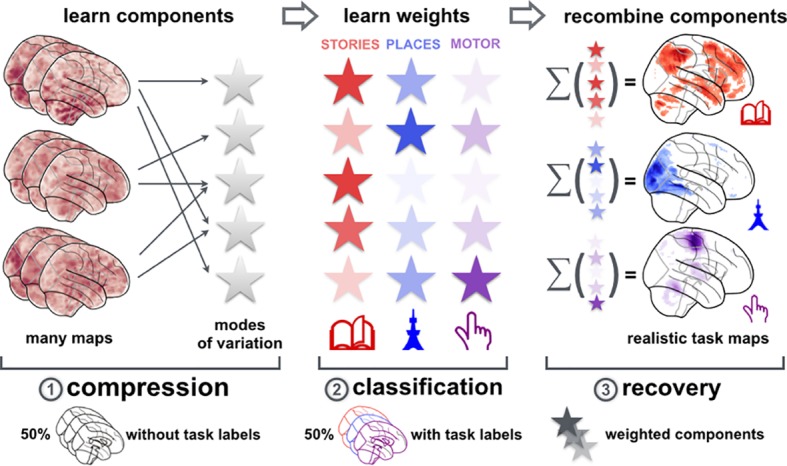
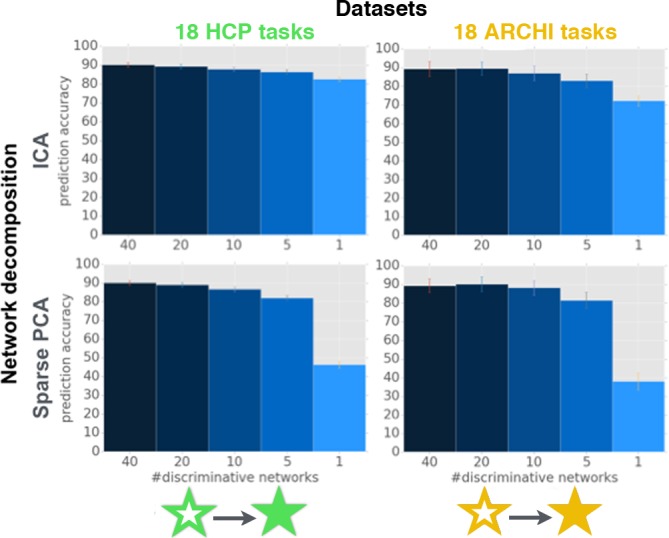
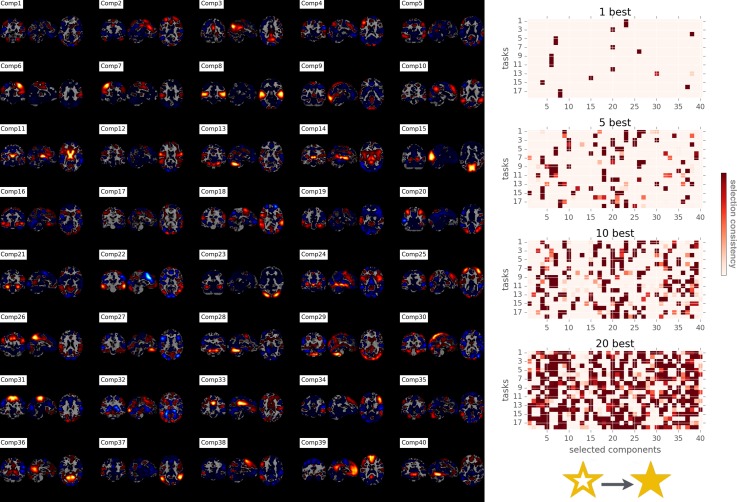
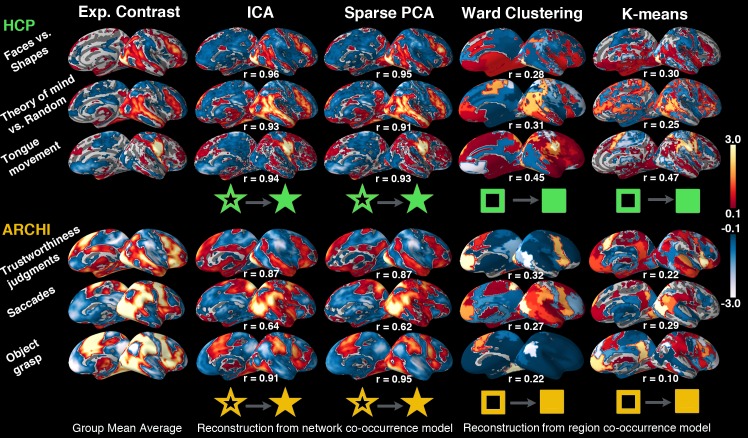
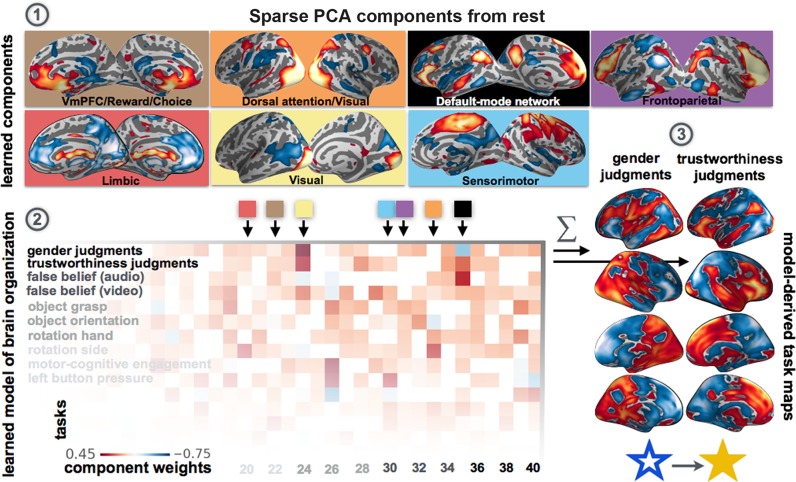
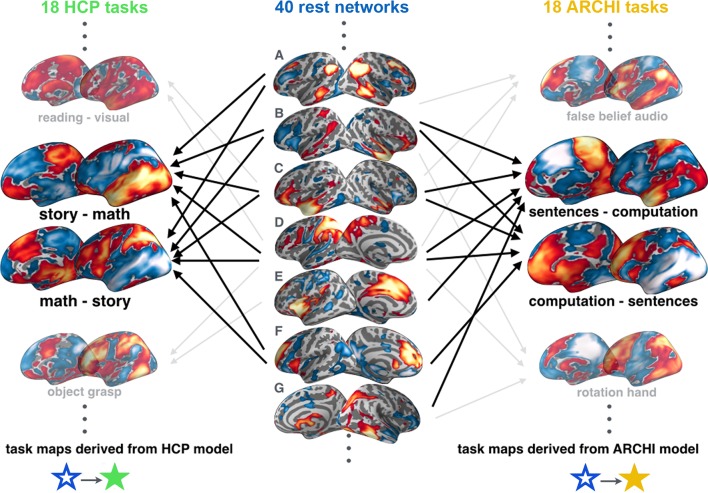
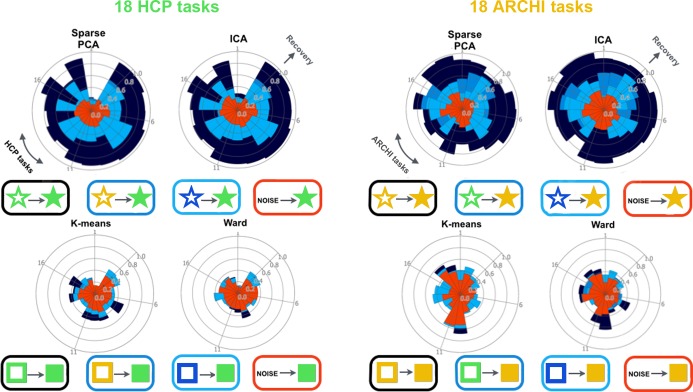
Systems neuroscience has identified a set of canonical large-scale networks in humans. These have predominantly been characterized by resting-state analyses of the task-unconstrained, mind-wandering brain. Their explicit relationship to defined task performance is largely unknown and remains challenging. The present work contributes a multivariate statistical learning approach that can extract the major brain networks and quantify their configuration during various psychological tasks. The method is validated in two extensive datasets (n = 500 and n = 81) by model-based generation of synthetic activity maps from recombination of shared network topographies. To study a use case, we formally revisited the poorly understood difference between neural activity underlying idling versus goal-directed behavior. We demonstrate that task-specific neural activity patterns can be explained by plausible combinations of resting-state networks. The possibility of decomposing a mental task into the relative contributions of major brain networks, the "network co-occurrence architecture" of a given task, opens an alternative access to the neural substrates of human cognition.


Conflict of interest statement

The authors have declared that no competing interests exist.

Figures

Fig 1
Fig 1. Overview of experimental analyses.
The schematic summaries the modeling experiments undertaken in the present study. Symbols are introduced that describe how the HCP task data (green), the ARCHI task data (yellow), and the rest data (blue) were used to (A) evaluate the idea of network co-occurrence modeling and (B) test explicit hypotheses about the commonalities and differences between human brain activity in task-constrained and idling brain states [3, 6]. Stars indicate brain networks derived as mutually overlapping spatiotemporal patterns from independent component analysis (ICA), principle component analysis (PCA), sparse PCA, and factor analysis (FA). Cubes indicate discrete brain regions derived as mutually disjoint voxel groups from k-means and ward clustering. Empty stars or cubes indicate learning a network decomposition or region segregation from brain activity maps without the task labels (i.e., "unsupervised statistical learning"). Filled stars or cubes indicate learning a classification algorithm of 18 typical psychological tasks based on brain activity maps summarized as networks or regions with the task labels (i.e., "supervised statistical learning"). The origin of the arrows indicate from what data (HCP tasks, ARCHI tasks, or rest) the networks and regions were obtained. The arrows point to the set of psychological tasks that was captured by a predictive model based on the previously derived networks and regions. These symbols indicate the provenance of the results shown in the other figures.
Fig 2
Fig 2. Network co-occurrence modeling: Workflow.
The three steps of the proposed analysis approach are outlined. (1) In two large neuroimaging datasets (HCP with n = 500, ARCHI with n = 81), the spatial patterns of neural activity dominant across time series were discovered by data-driven decomposition of neural activity maps (first half of the data). The repertoire of major networks in the human brain was hence derived without access to what experimental task each activity map belongs. (2) This dictionary of explicit network definitions allowed reducing the remaining task activity maps (second half of the data) underlying traditional psychological concepts into 40 component loadings per neural activity map. Statistical learning based on these biologically motivated features found a linear model to distinguish 18 tasks by leave-one-participant-out cross-validation. A characteristic configuration of network engagements was thus automatically derived for each of 18 experimental tasks. (3) As face-validity criterion, task activity maps were generated from the weights of the trained classification models. These allowed quantifying the recovery performance of a given statistical model as a measure of biological meaningfulness of the learned model parameters (cf. methods section).
Fig 3
Fig 3. Network co-occurrence modeling: Predictive accuracy across network dictionary sizes.
40 ICA networks (upper row) and 40 sparse PCA networks (lower row) were discovered in HCP task data (left column) and ARCHI task data (right column) and used for feature engineering to facilitate classification of 18 psychological tasks (l2-penalized support vector machines, multi-class, one-versus-rest). One half of the task data (i.e., 4325 activity maps from HCP, 702 activity maps from ARCHI) were used for discovery of the ICA and sparse PCA networks. The network loadings of the previously unseen half of the task data (i.e., 4325 HCP maps, 702 ARCHI maps) were then submitted to an 18-task classification problem. The support vector machines were penalized by l2-regularization because classifier fitting was preceded by automatic selection of the k most relevant networks for each task (cf. methods section). We used a univariate feature selection procedure to evaluate the classification performance (y axis) as a function of k known network loadings per task (x axis). A two-step procedure therefore first subselected the k = 40, 20, 10, 5, and 1 most important network predictors for each task by univariate ANOVA tests and subsequent multivariate support vector machine fitting on the k most relevant network loadings per task. Note that each psychological task could therefore be associated with a different subselection of network loading features. To measure generalization performance, all task maps of one selected participant were left out in each cross-validation fold. See Fig 4 and S1–S3 Figs for the network topographies and the complete task-network assignments for each k.
Fig 4
Fig 4. Network co-occurrence modeling: Sparse PCA network decomposition of ARCHI task maps and network-task assignment.
40 network components underlying 18 ARCHI tasks have been discovered by sparse PCA (Comp1-40 on the left). The ensuing network loadings from the second half of the ARCHI task data were submitted to classification of the psychological tasks based on the implication of brain networks (l2-penalized support vector machines, multi-class, one-versus-rest). l2-penalized support vector machines was employed to choose the most discriminative network variables by a preceding classical univariate test in a discrete fashion rather than by sparse variable selection based on l1 penalization (cf. methods section). This diagnostic analysis (right) revealed the most distinctive k = 1, 5, 10, and 20 network features (red cubes) for each experimental condition of the task battery (cf. Fig 3). The thus discretely selected network features per task were then fed into supervised multi-task classification as a feature space of activity-map-wise continuous activity values. The color intensity of the k cubes quantifies how often the corresponding brain network was selected as important for a task across cross-validation folds. This diagnostic test performed inference on a) the single most discriminative network for each task at k = 1, b) the network variables that are added step-by-step to the feature space of network implications with increasing k, and c) what network variables are unspecific (i.e., not selected) for a given task at k = 20. See tables for the corresponding descriptions of task 1–18. See S1–S3 Figs for analogous plots based on different matrix factorizations and datasets.
Fig 5
Fig 5. Network co-occurrence modeling: Comparing whole-brain reconstruction performance to region co-occurrence models.
40 networks from ICA or sparse PCA decomposition and 40 regions from ward or k-means clustering were discovered in HCP task data (upper rows) or ARCHI task data (lower rows) and used for classifying (l1-penalized support vector machines, multi-class, one-versus-rest) 18 psychological tasks in the remaining 50% of that same task data. For three exemplary tasks from HCP and ARCHI, the mean activity pattern across all participants is depicted (leftmost column). The corresponding whole-brain task activity derived from the network decomposition models ICA and sparse PCA capture proxies of functional brain networks by emphasis on functional integration (S4–S7 Figs). In contrast, task activity derived from the region parcellation models ward clustering (all region voxels are always spatially connected) and k-means clustering (no spatial constraint) capture proxies of functional brain regions by emphasis on regional specialization (S8–S10 Figs). The correlation values r quantify the voxel-wise similarity between the reconstructed activity map and the average activity map for each task and network decomposition method. This measure of recovery performance indicates the information loss incurred when first expressing activity maps as 40 network-wise loading values or 40 region-wise activity averages and then translating these values back into whole-brain space (cf. methods section). Consequently, learning network co-occurrence models outperformed region co-occurrence models in recovering realistic task activity, given an equal number of latent network and region components.
Fig 6
Fig 6. Task-rest correspondence: Composition of resting networks underlying psychological tasks.
As a use case for network co-occurrence modeling, an insufficiently understood question of human brain organization has been quantitatively revisited: the correspondence between neural activity during goal-directed tasks and idling mind-wandering. 40 sparse PCA networks were revealed in rest data and used for supervised classification (l1-penalized support vector machines, multi-class, one-versus-rest) of 18 psychological tasks from the ARCHI task battery. (1) Seven examples from the 40 spatiotemporal activity patterns drawn from task-unrelated resting-state fluctuations using sparse PCA decomposition. This enabled translation of whole-brain task activity maps (>60,000 voxels) from the ARCHI task data into 40 network component loadings per activity map. (2) These measures of network implication served as basis for statistical learning of a sparse classification model that disambiguates activity maps from the 18 psychological task. In the depicted matrix, each square represents an automatically determined classification model weight that corresponds to the importance of one specific large-scale network (x axis) during a given cognitive task (y axis). l1-penalization of the classification algorithm induced zero model weights (white) for automatic variable selection of the resting-state networks that are specifically associated with a given task (red or blue), in contrast to discrete selection of the k best network features (Figs 3 and 4). (3) The network weights of the fitted model is exploited for de-novo generation of realistic whole-brain activity maps for each of the 18 tasks. This is exemplified by gender judgments and trustworthiness judgments on visually presented faces: Consistent with previously published experimental fMRI studies [53], the default-mode network (black square), implicated in higher-order social processing, exhibited significant increase with trustworthiness judgments but decrease with gender judgments on faces. Both face discrimination tasks rely on the visual cortex (yellow square), the limbic system (red square), and the reward- and choice-related ventromedial prefrontal cortex (brown square). The dorsal attention/visual network (orange square) was detected as non-discriminatory for the two facial judgments tasks (i.e., weight is zero). Further, the frontoparietal network with extensive dorsolateral prefrontal cortex implication (purple square) was only associated with gender judgments, whereas the sensorimotor network (blue square) was only associated with trustworthiness judgments.
Fig 7
Fig 7. Task-rest correspondence: Reconstructing two similar tasks from two different datasets based on the same resting networks.
40 sparse PCA networks were discovered from the same rest data and used for feature engineering as a basis for classification (l1-penalized support vector machines, multi-class, one-versus-rest) of 18 psychological tasks from HCP (left) and from ARCHI (right). Middle column: Examples of resting-state networks derived from decomposing rest data using sparse PCA. Networks B and C might be related to semantics processing in the anterior temporal lobe [54], network D covers extended parts of the parietal cortex, while networks E and F appear to be variants of the so-called “salience” network [10]. Left/Right column: Examples of task-specific neural activity generated from network co-occurrence models of the HCP/ARCHI task batteries. Arrows: A diagnostic subanalysis indicated what rest networks were automatically ranked top-five in distinguishing a given task from the respective 17 other tasks (i.e., k = 5 analogous to analyses in Figs 3 and 4). Although the experimental tasks in the HCP and ARCHI repositories, “story versus math” and “sentences versus computation” were the most similar cognitive contrasts in both datasets. For these four experimental conditions the model-derived task maps are highly similar. Consequently, two independent classification problems in two independent datasets with a six-fold difference in sample size resulted in two independent explicit models that, nevertheless, generated comparable task-specific maps. This indicated that network co-occurrence modeling indeed captures genuine aspects of neurobiology rather than arbitrary discriminatory aspects of the data.
Fig 8
Fig 8. Task-rest correspondence: Recovery performance across network and region atlases.
40 networks (upper row) were discovered in independent component analysis (ICA) and sparse principal component analysis (sparse PCA). 40 regions (lower row) were derived from k-means and ward clustering based on four diverging types of neural activity data. Network and region atlases were derived from i) identical task-data as positive test (dark blue), ii) non-identical task-data (medium blue), iii) resting-state data (light blue), and iv) Gaussian noise as negative test (red). The ensuing networks and regions were then used to create a feature space of neural activity patterns for 18-task classification (l1-penalized support vector machines, multi-class, one-versus-rest) and subsequently measure the per-task recovery performance. The recovery performance of all 18 tasks (radial columns) is measured by the Pearson correlation between the model-derived task activity maps and the average first-level task map. As an important observation, network dictionaries derived from different tasks and from rest data were similarly successful in recovering whole-brain activity during diverging experimental tasks, while specialized regions achieved much worse recovery performances in both datasets. See S11 and S12 Figs for additional analyses.

References

    1. Biswal BB, Mennes M, Zuo XN, Gohel S, Kelly C, Smith SM, et al. Toward discovery science of human brain function. Proceedings of the National Academy of Sciences of the United States of America. 2010;107(10):4734–9. 10.1073/pnas.0911855107 - DOI - PMC - PubMed
    1. Zhang D, Raichle ME. Disease and the brain's dark energy. Nature reviews Neurology. 2010;6(1):15–28. 10.1038/nrneurol.2009.198 - DOI - PubMed
    1. Cole MW, Bassett DS, Power JD, Braver TS, Petersen SE. Intrinsic and task-evoked network architectures of the human brain. Neuron. 2014;83(1):238–51. 10.1016/j.neuron.2014.05.014 - DOI - PMC - PubMed
    1. Mennes M, Kelly C, Colcombe S, Castellanos FX, Milham MP. The Extrinsic and Intrinsic Functional Architectures of the Human Brain are not equivalent. Cerebral cortex. 2013;23:223–9. 10.1093/cercor/bhs010 - DOI - PMC - PubMed
    1. Fair DA, Bathula D, Mills KL, Dias TG, Blythe MS, Zhang D, et al. Maturing thalamocortical functional connectivity across development. Frontiers in systems neuroscience. 2010;4:10 10.3389/fnsys.2010.00010 - DOI - PMC - PubMed

Publication types

LinkOut - more resources