. 2016 Jun 16;11(6):e0157368.
doi: 10.1371/journal.pone.0157368. eCollection 2016.

Refinement of Triple-Negative Breast Cancer Molecular Subtypes: Implications for Neoadjuvant Chemotherapy Selection

Affiliations

Refinement of Triple-Negative Breast Cancer Molecular Subtypes: Implications for Neoadjuvant Chemotherapy Selection

Brian D Lehmann et al. PLoS One. .

Abstract

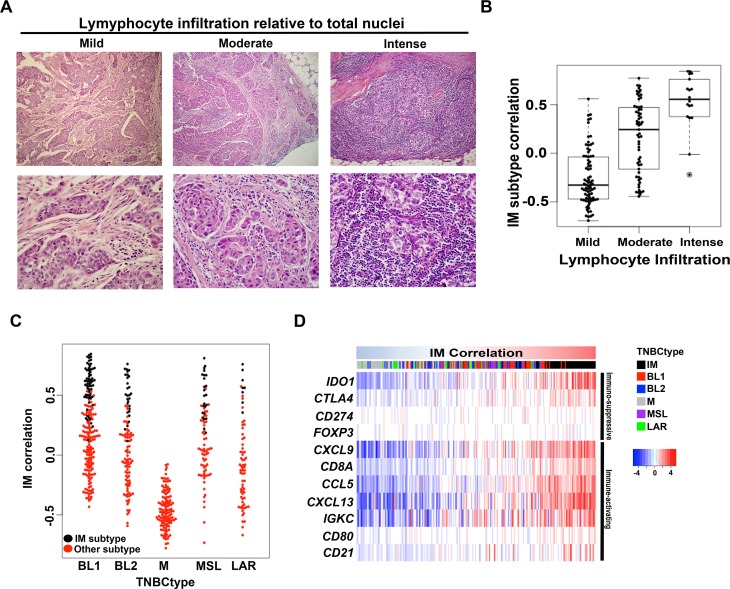
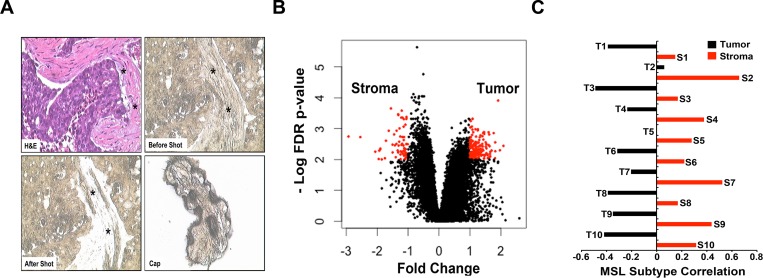
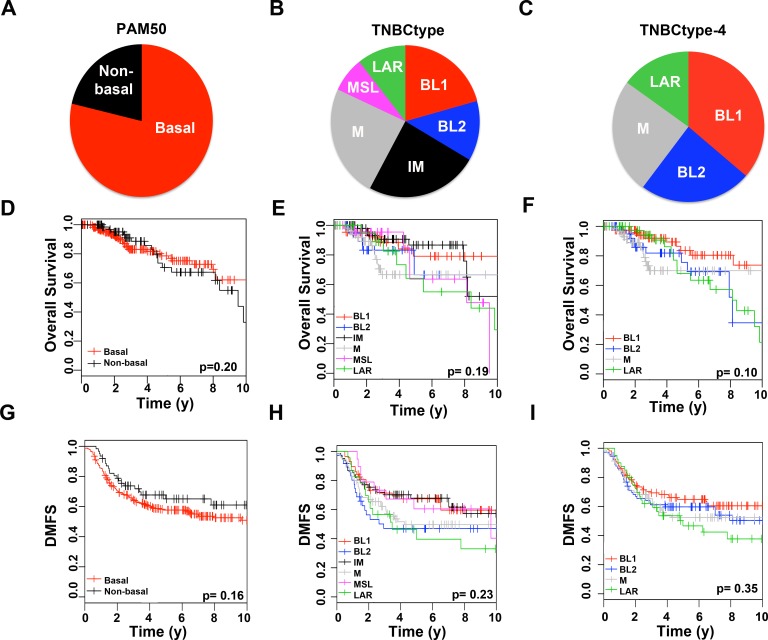
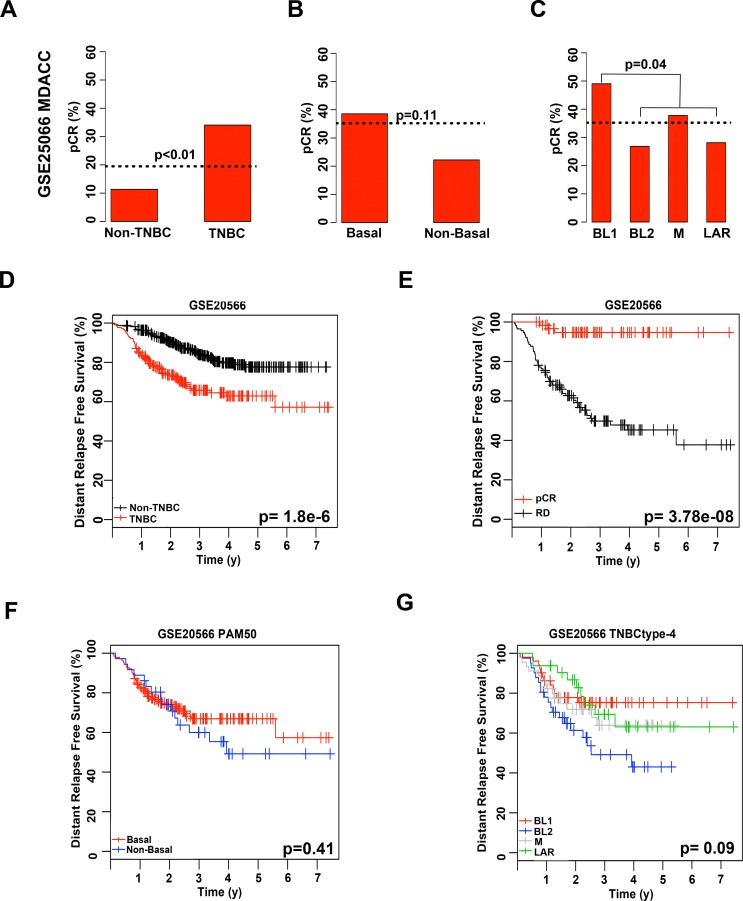
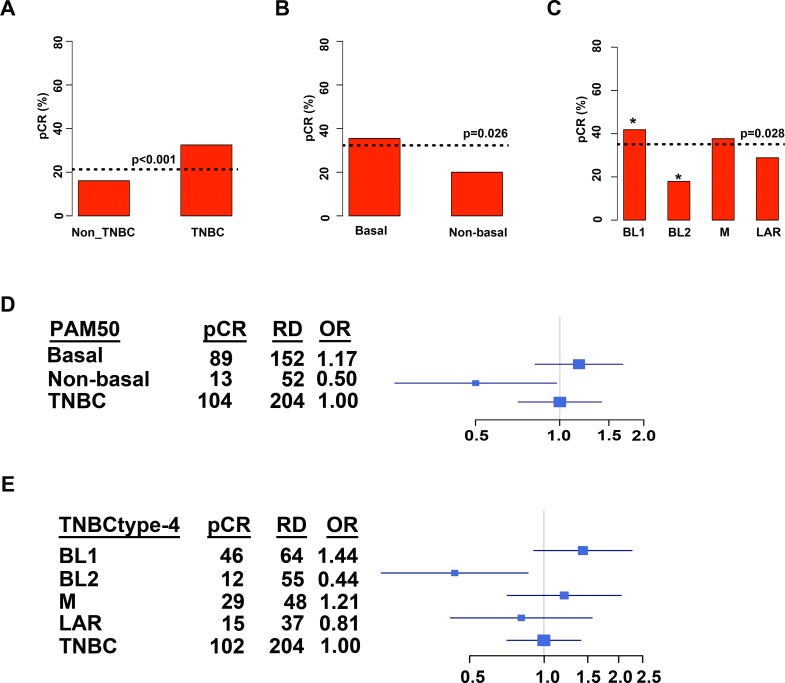
Triple-negative breast cancer (TNBC) is a heterogeneous disease that can be classified into distinct molecular subtypes by gene expression profiling. Considered a difficult-to-treat cancer, a fraction of TNBC patients benefit significantly from neoadjuvant chemotherapy and have far better overall survival. Outside of BRCA1/2 mutation status, biomarkers do not exist to identify patients most likely to respond to current chemotherapy; and, to date, no FDA-approved targeted therapies are available for TNBC patients. Previously, we developed an approach to identify six molecular subtypes TNBC (TNBCtype), with each subtype displaying unique ontologies and differential response to standard-of-care chemotherapy. Given the complexity of the varying histological landscape of tumor specimens, we used histopathological quantification and laser-capture microdissection to determine that transcripts in the previously described immunomodulatory (IM) and mesenchymal stem-like (MSL) subtypes were contributed from infiltrating lymphocytes and tumor-associated stromal cells, respectively. Therefore, we refined TNBC molecular subtypes from six (TNBCtype) into four (TNBCtype-4) tumor-specific subtypes (BL1, BL2, M and LAR) and demonstrate differences in diagnosis age, grade, local and distant disease progression and histopathology. Using five publicly available, neoadjuvant chemotherapy breast cancer gene expression datasets, we retrospectively evaluated chemotherapy response of over 300 TNBC patients from pretreatment biopsies subtyped using either the intrinsic (PAM50) or TNBCtype approaches. Combined analysis of TNBC patients demonstrated that TNBC subtypes significantly differ in response to similar neoadjuvant chemotherapy with 41% of BL1 patients achieving a pathological complete response compared to 18% for BL2 and 29% for LAR with 95% confidence intervals (CIs; [33, 51], [9, 28], [17, 41], respectively). Collectively, we provide pre-clinical data that could inform clinical trials designed to test the hypothesis that improved outcomes can be achieved for TNBC patients, if selection and combination of existing chemotherapies is directed by knowledge of molecular TNBC subtypes.


Conflict of interest statement

Competing Interests: The authors have read and understood the PLOS journal policy on reporting conflict of interest and declare the following interests: BDL and JAP are inventors (PCT/US2012/065724) of intellectual property (TNBCtype) licensed by Insight Genetics Inc. This does not alter the authors’ adherence to PLOS ONE policies on sharing data and materials.

Figures

Fig 1
Fig 1. Analysis of lymphocyte infiltration and immune signaling gene expression in IM subtype TNBC.
(A) Representative H&E images TNBC tumors that were scored for mild (0–10%) moderate (20–40%) or intense (>50%) levels of infiltrating lymphocytes relative to total nuclei. (B) Boxplot shows IM subtype gene expression correlation for each TCGA TNBC tumor binned into mild, moderate or intense levels by pathological evaluation of H&E slides. (C) Beeswarm plot shows the IM subtype correlation for 587 TNBC tumors according to TNBC subtypes (red). Tumors that were initially subtyped as IM, but have strong secondary correlations to other subtypes, are shown in black. (D) Heatmap shows expression of immuno-regulatory genes across 587 TNBC tumors ranked by increasing correlations to the IM TNBC centroid.
Fig 2
Fig 2. LCM followed by gene expression analysis of tumor epithelium and adjacent stroma identifies normal stromal cell gene expression in the MSL TNBC subtype.
(A) Representative images of H&E (upper left), tissue before (upper right) and after (lower left) LCM and cells isolated (lower right) for gene expression analysis in adjacent tumor stroma (asterisk). (B) Scatter-plot shows differentially expressed genes (FC> 2, FDR< 0.01) between LCM-isolated tumor epithelium and stromal cells from 10 TNBC tumors. (C) Bar-plot shows the correlation of each tumor epithelial and stromal pairs to the MSL subtype.
Fig 3
Fig 3. Molecular subtype distribution and survival analysis of TNBC samples stratified by PAM50, TNBCtype or refined TNBCtype-4.
Piecharts show the distribution of 767 TNBC samples by (A) PAM50 (B) TNBCtype or (C) refined TNBCtype-4. Kaplan-Meier curves show overall survival for TNBC patients stratified by (D) PAM50 (E) TNBCtype or (F) refined TNBCtype-4 or relapse-free survival stratified by (G) PAM50 (H) TNBCtype or (I) refined TNBCtype-4. P-values shown were determined by logrank test. * indicates significant (p<0.05) pairwise survival differences between a subtype and all other subtypes combined not adjusted for multiple comparisons.
Fig 4
Fig 4. Chemotherapy response and distant relapse-free survival of TNBC treated with neoadjuvant anthracycline and taxane relative to PAM50 or refined TNBCtype-4 subtyping.
Barplots show pCR rates achieved for patients stratified by (A) TNBC, (B) PAM50 or (C) TNBCtype-4. Dotted horizontal line indicates pCR for the individual cohort. Statistical significance determined by Fisher’s exact test. Kaplan-Meier plots display distant relapse-free survival from GSE25066 for (D) TNBC patients; (E) TNBC patients stratified by pCR or RD; (F) TNBC patients stratified by PAM50; and (G) TNBC patients stratified by refined TNBCtype-4.
Fig 5
Fig 5. Combined retrospective analyses of 306 TNBC tumors treated with neoadjuvant chemotherapy stratified by molecular subtype.
Barplots show pCR for (A) all breast cancer stratified by non-TNBC and TNBC or (B) TNBC patients stratified by PAM50 or (C) TNBCtype-4. Dotted horizontal lines indicate pCR for the stratified individual cohort. Table shows distribution of pCR, residual disease (RD) and odds ratio (OR) for a pCR in TNBC patients stratified by (D) PAM50 or (E) TNBCtype-4. Forrest plots display OR for pCR in subtypes relative to all TNBC.

References

    1. Esserman LJ, Berry DA, Cheang MCU, Yau C, Perou CM, Carey L, et al. Chemotherapy response and recurrence-free survival in neoadjuvant breast cancer depends on biomarker profiles: results from the I-SPY 1 TRIAL (CALGB 150007/150012; ACRIN 6657). Breast Cancer Res Treat. 2012;132: 1049–1062. 10.1007/s10549-011-1895-2 - DOI - PMC - PubMed
    1. Timms KM, Abkevich V, Hughes E, Neff C, Reid J, Morris B, et al. Association of BRCA1/2 defects with genomic scores predictive of DNA damage repair deficiency among breast cancer subtypes. Breast Cancer Res. 2014;16: 475 10.1186/s13058-014-0475-x - DOI - PMC - PubMed
    1. Carey LA, Perou CM, Livasy CA, Dressler LG, Cowan D, Conway K, et al. Race, breast cancer subtypes, and survival in the Carolina Breast Cancer Study. JAMA. 2006;295: 2492–2502. 10.1001/jama.295.21.2492 - DOI - PubMed
    1. Amirikia KC, Mills P, Bush J, Newman LA. Higher population-based incidence rates of triple-negative breast cancer among young African-American women: Implications for breast cancer screening recommendations. Cancer. 2011;117: 2747–2753. 10.1002/cncr.25862 - DOI - PMC - PubMed
    1. Miyake T, Nakayama T, Naoi Y, Yamamoto N, Otani Y, Kim SJ, et al. GSTP1 expression predicts poor pathological complete response to neoadjuvant chemotherapy in ER-negative breast cancer. Cancer Sci. 2012;103: 913–920. 10.1111/j.1349-7006.2012.02231.x - DOI - PMC - PubMed

MeSH terms