

Lower serum uric acid level predicts mortality in dialysis patients
- PMID: 27310949
- PMCID: PMC4998435
- DOI: 10.1097/MD.0000000000003701
Lower serum uric acid level predicts mortality in dialysis patients
Erratum in
-
Erratum: Medicine, Volume 95, Issue 24: Erratum.Medicine (Baltimore). 2016 Aug 7;95(31):e5074. doi: 10.1097/01.md.0000490009.39850.74. eCollection 2016 Aug. Medicine (Baltimore). 2016. PMID: 31265618 Free PMC article.
-
Lower serum uric acid level predicts mortality in dialysis patients: Erratum.Medicine (Baltimore). 2021 Sep 17;100(37):e27274. doi: 10.1097/MD.0000000000027274. Medicine (Baltimore). 2021. PMID: 34664884 Free PMC article. No abstract available.
Abstract
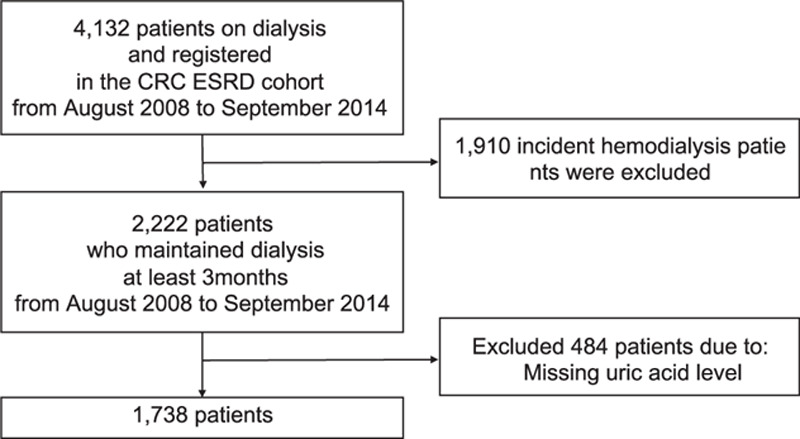
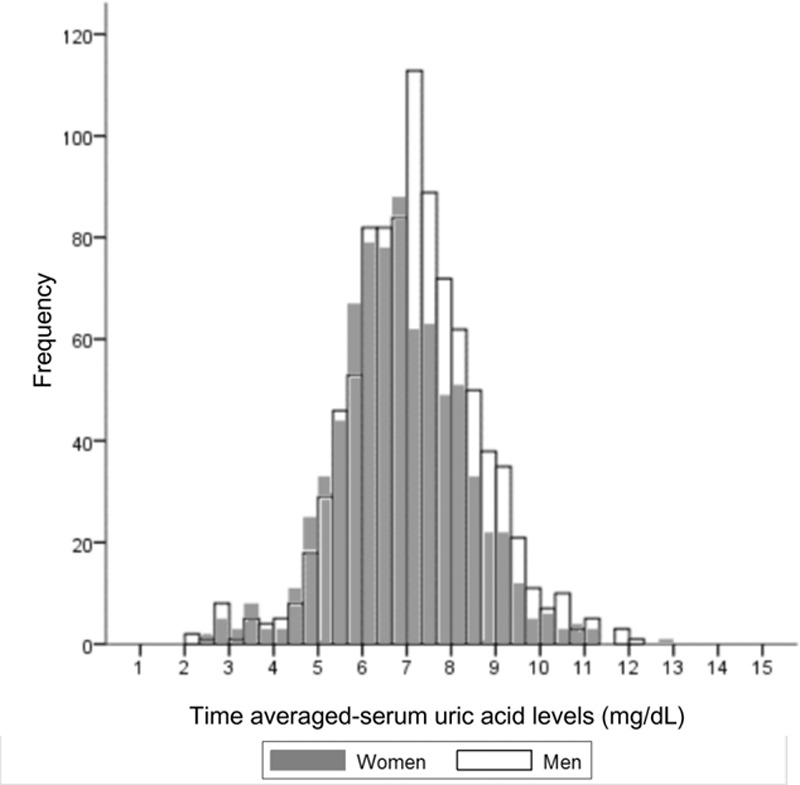
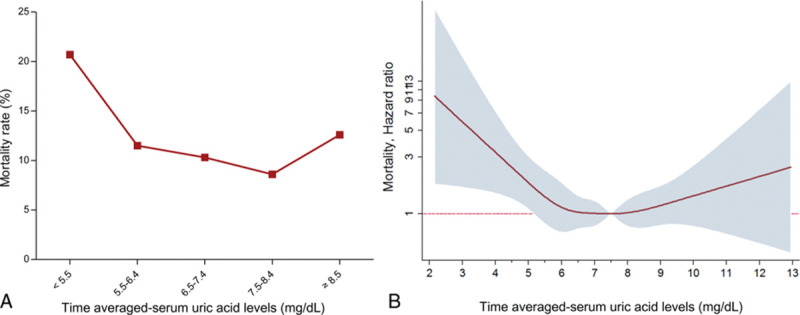
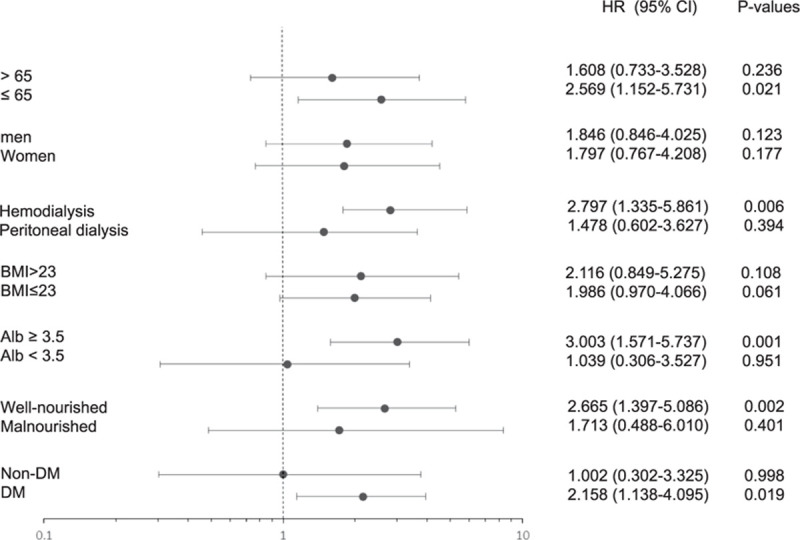
We evaluated the impact of serum uric acid (SUA) on mortality in patients with chronic dialysis. A total of 4132 adult patients on dialysis were enrolled prospectively between August 2008 and September 2014. Among them, we included 1738 patients who maintained dialysis for at least 3 months and had available SUA in the database. We categorized the time averaged-SUA (TA-SUA) into 5 groups: <5.5, 5.5-6.4, 6.5-7.4, 7.5-8.4, and ≥8.5 mg/dL. Cox regression analysis was used to calculate the hazard ratio (HR) of all-cause mortality according to SUA group. The mean TA-SUA level was slightly higher in men than in women. Patients with lower TA-SUA level tended to have lower body mass index (BMI), phosphorus, serum albumin level, higher proportion of diabetes mellitus (DM), and higher proportion of malnourishment on the subjective global assessment (SGA). During a median follow-up of 43.9 months, 206 patients died. Patients with the highest SUA had a similar risk to the middle 3 TA-SUA groups, but the lowest TA-SUA group had a significantly elevated HR for mortality. The lowest TA-SUA group was significantly associated with increased all-cause mortality (adjusted HR, 1.720; 95% confidence interval, 1.007-2.937; P = 0.047) even after adjusting for demographic, comorbid, nutritional covariables, and medication use that could affect SUA levels. This association was prominent in patients with well nourishment on the SGA, a preserved serum albumin level, a higher BMI, and concomitant DM although these parameters had no significant interaction in the TA-SUA-mortality relationship except DM. In conclusion, a lower TA-SUA level <5.5 mg/dL predicted all-cause mortality in patients with chronic dialysis.
Conflict of interest statement
The authors have no conflicts of interest to disclose.
Figures

References
Publication types
MeSH terms
Substances
LinkOut - more resources
Full Text Sources
Other Literature Sources
Medical
