. 2016 Aug 12;291(33):16948-62.
doi: 10.1074/jbc.M116.734038. Epub 2016 Jun 16.

Super-resolution Microscopy Reveals Compartmentalization of Peroxisomal Membrane Proteins

Affiliations

Super-resolution Microscopy Reveals Compartmentalization of Peroxisomal Membrane Proteins

Silvia Galiani et al. J Biol Chem. .

Abstract

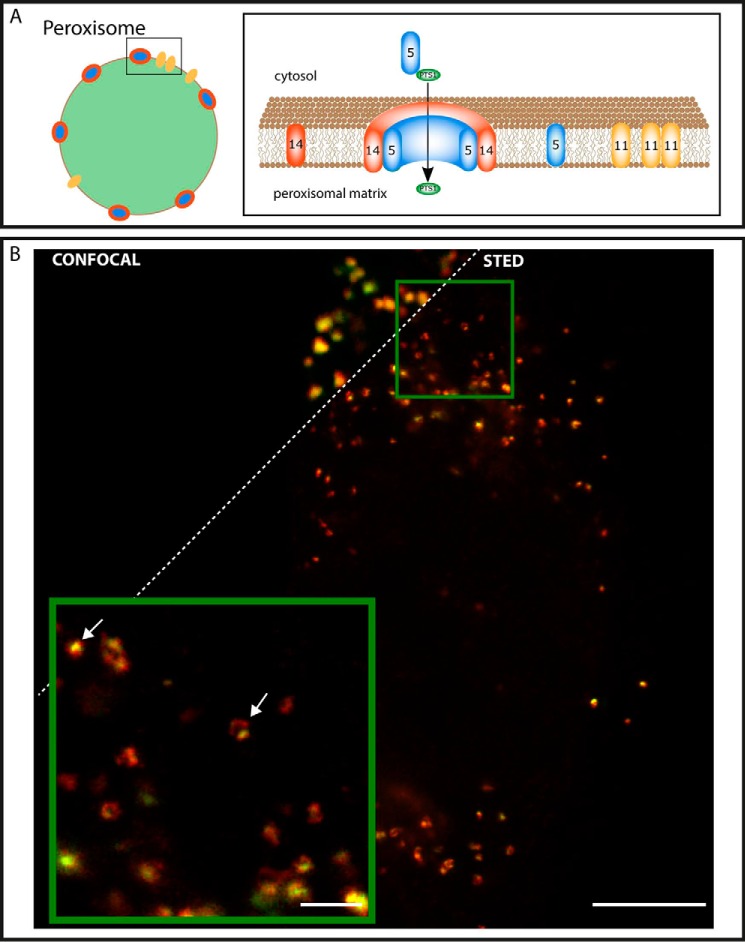
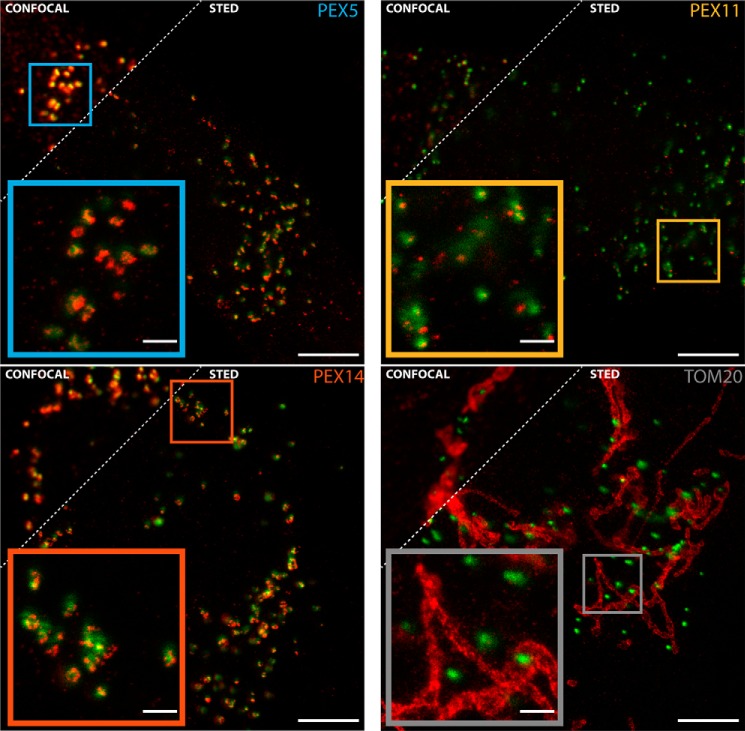
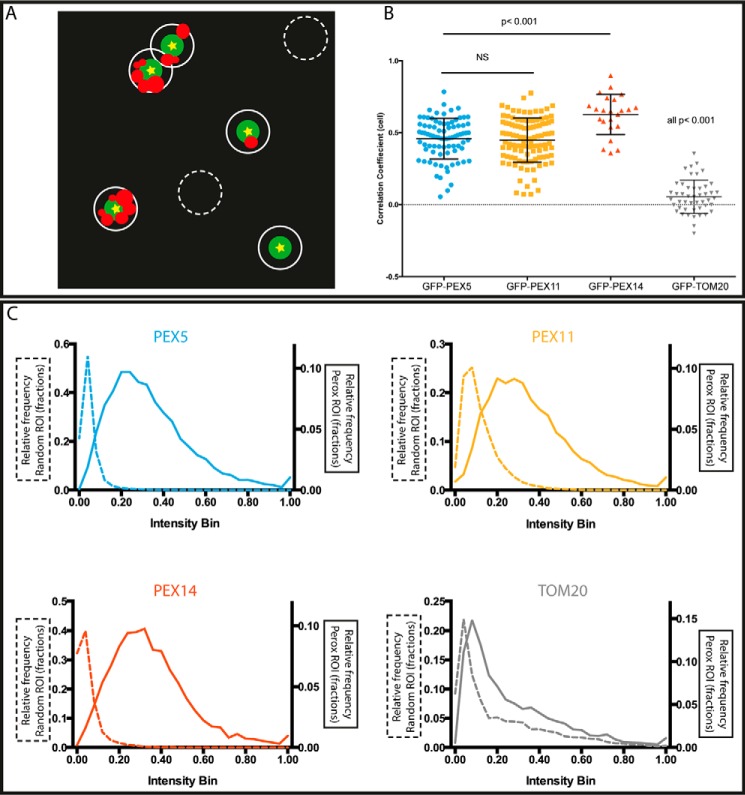
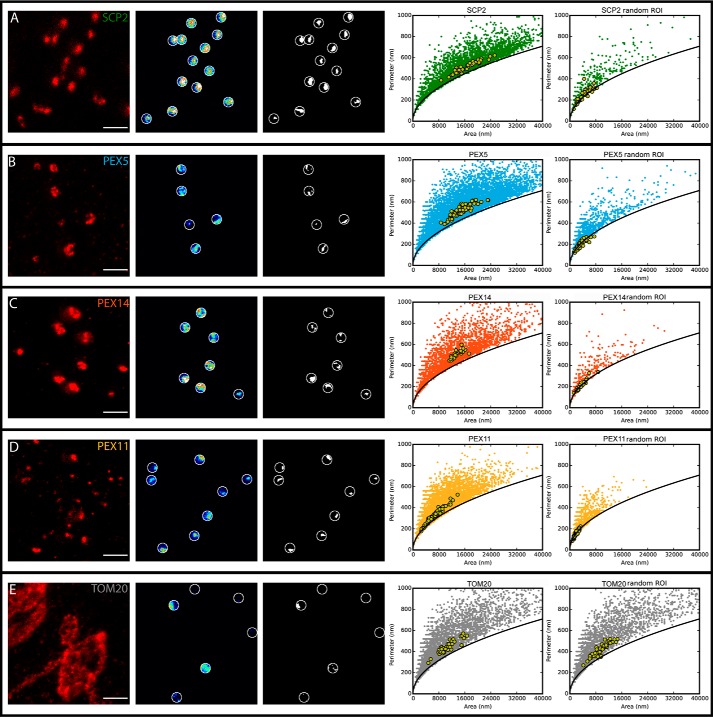
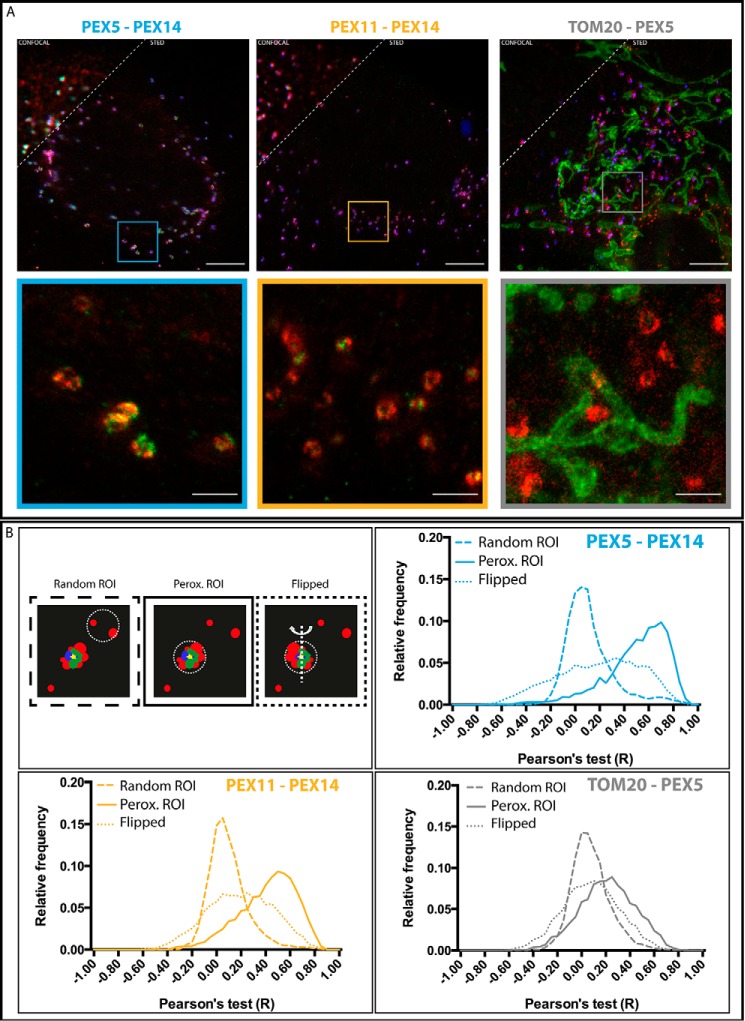
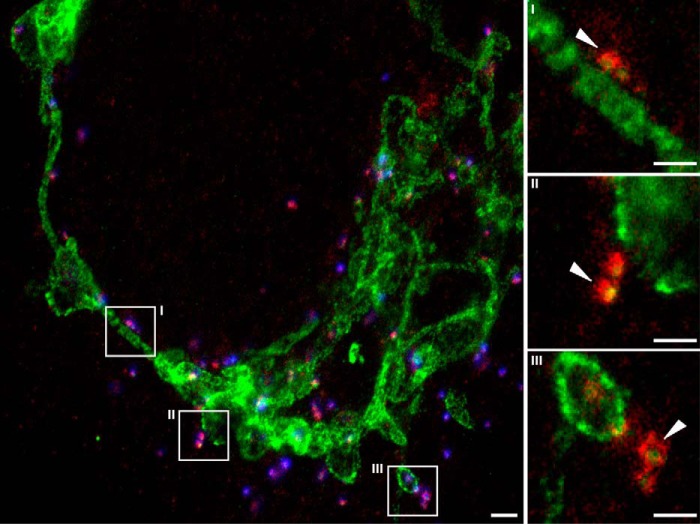
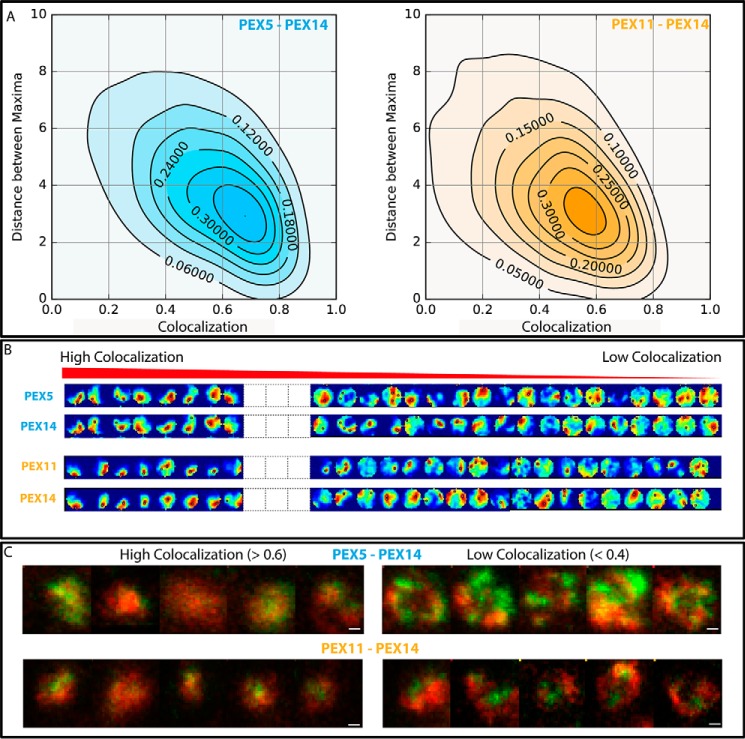
Membrane-associated events during peroxisomal protein import processes play an essential role in peroxisome functionality. Many details of these processes are not known due to missing spatial resolution of technologies capable of investigating peroxisomes directly in the cell. Here, we present the use of super-resolution optical stimulated emission depletion microscopy to investigate with sub-60-nm resolution the heterogeneous spatial organization of the peroxisomal proteins PEX5, PEX14, and PEX11 around actively importing peroxisomes, showing distinct differences between these peroxins. Moreover, imported protein sterol carrier protein 2 (SCP2) occupies only a subregion of larger peroxisomes, highlighting the heterogeneous distribution of proteins even within the peroxisome. Finally, our data reveal subpopulations of peroxisomes showing only weak colocalization between PEX14 and PEX5 or PEX11 but at the same time a clear compartmentalized organization. This compartmentalization, which was less evident in cases of strong colocalization, indicates dynamic protein reorganization linked to changes occurring in the peroxisomes. Through the use of multicolor stimulated emission depletion microscopy, we have been able to characterize peroxisomes and their constituents to a yet unseen level of detail while maintaining a highly statistical approach, paving the way for equally complex biological studies in the future.

Keywords: STED microscopy; membrane protein; membrane trafficking; microscopy; peroxisome; protein import; super-resolution optical microscopy.


Figures

FIGURE 1.
FIGURE 1.
STED imaging of peroxisomal membrane and matrix. A, peroxisomal protein import process. A sketch of a peroxisome (left) and a close-up of a part of the peroxisomal membrane (right) with peroxisomal import receptor PEX5 (blue); membrane protein PEX14 (orange), both components of the translocation pore; PTS1 cargo protein (green); and proliferation factor PEX11 (yellow). The cargo receptor PEX5 binds PTS1-containing cargo proteins in the cytosol, directs them to the peroxisomal membrane where PEX5 becomes part of the translocation pore, the PTS1-containing cargo proteins become imported, and PEX5 is released afterward. B, representative dual color confocal (upper left) and STED (lower right) images of fixed human fibroblast cells transfected with the peroxisomal matrix marker GFP-SCP2 and immunostained for PEX14 (red; Abberior STAR 600 secondary antibody) and GFP-SCP2 (green; GFP nanobooster Abberior STAR 635P); overview (main panel) and zoom (inset; STED) of area marked in the overview. Arrows, examples of pointlike and ringlike SCP2 intensity patterns surrounded by PEX14, i.e. the peroxisomal membrane. Scale bars, 5 (overview) and 1 μm (inset).
FIGURE 2.
FIGURE 2.
STED imaging of selected peroxisomal and mitochondrial membrane proteins. Representative dual color confocal (upper left) and STED (lower right) images of fixed human fibroblast cells transfected with the peroxisomal matrix marker GFP-SCP2 (green; always confocal) and immunostained (red) for PEX5 (upper left panel), PEX14 (lower left panel), PEX11 (upper right panel), and TOM20 (lower right panel), overviews (main panels), and zooms (insets; STED) of areas marked in the overviews are shown. Scale bars, 5 (overviews) and 1 μm (insets).
FIGURE 3.
FIGURE 3.
Intensity analysis of protein distributions at peroxisomes. A, scheme of automated algorithm for defining peroxisomal (Perox) (white circles) and random non-peroxisomal (dashed white circles) regions of interest (ROI). Only peroxisomes with GFP-SCP2 signal, i.e. active protein import, were chosen. For the analysis, circular patches of 190-nm radius centered at the maximal intensity (yellow stars) of the confocal GFP-SCP2 signal (green) were chosen for peroxisomal regions and patches enclosing no GFP-SCP2 signal for random regions and the detected intensity of the antibody staining within these regions were analyzed. B, intensity correlation analysis of GFP-SCP2 and antibody staining signal (for different proteins PEX5, PEX11, PEX14, and TOM20 as labeled); values of 1 indicate maximum correlation, and 0 indicates no correlation (dashed horizontal line). Shown are individual values from 82 (PEX5), 107 (PEX11), 23 (PEX14), and 47 (TOM20) selected peroxisomes (average and S.D. (error bars); horizontal bars, p test results (NS, non-significant)). C, histograms of the normalized intensity distribution of PEX5 (top left), PEX11 (top right), PEX14 (bottom left), and TOM20 (bottom right) in the peroxisomal (full lines) and random (dashed lines) regions.
FIGURE 4.
FIGURE 4.
Morphology analysis of protein distributions. A morphology study of GFP-SCP2 (A), PEX14 (B), PEX5 (C), PEX11 (D) and TOM20 (E) is shown. Left panels, representative image of the antibody staining in STED resolution (scale bar, 1 μm); second panels from left, intensity distribution of the antibody staining in selected peroxisomal regions; third panels from left, thresholded features of distributions of antibody staining around peroxisomes as the basis for the morphology analysis; right panels, scatter plot of value pairs of area and perimeter of the selected features for all peroxisomes (filled circles; 13,759 (GFP-SCP2), 9,058 (PEX5), 9,784 (PEX11), 2,570 (PEX14), and 4,699 (TOM20) peroxisomes) and for cell-averaged values (green circles; 111 (GFP-SCP2), 82 (PEX5), 107 (PEX11), 23 (PEX14), and 47 (TOM20) cells). Solid lines depict expected dependence for circular features. ROI, region of interest.
FIGURE 5.
FIGURE 5.
Colocalization study of proteins at peroxisomes. A, representative confocal (upper left) and STED (lower right) images of fibroblast cells transfected with the peroxisomal matrix marker GFP-SCP2 (blue; only confocal and only in top panels), fixed, and immunolabeled for PEX14 (red) and PEX5 (green) (left), PEX14 (red) and PEX11 (green) (middle), and TOM20 (green) and PEX5 (red) (right). Overviews (upper panels) and zooms (insets) of regions marked in overviews are shown. Scale bars, 5 (overviews) and 1 μm (insets). B, Pearson's test colocalization analysis of different peroxisomal proteins. Upper left panel, scheme of the analysis procedure. Circular patches surrounding GFP-SCP2 signal (peroxisomal regions of interest (ROI)) and non-GFP-SCP2 signal (random regions of interest) were selected, and colocalization values were calculated using a pixel-wise Pearson's test. Upper right and lower panels, frequency histogram of Pearson's test values (−1, opposing colocalization; 0, no colocalization; 1, maximum colocalization) for PEX5 versus PEX14 (upper right), PEX11 versus PEX14 (lower left), and TOM20 versus PEX5 (lower right) and for random regions of interest (dashed lines), peroxisomal (Perox) regions of interest (solid lines), and flipped (dotted lines) (number of data points: PEX5-PEX14, 5439; PEX11-PEX14, 6178; TOM20-PEX5, 4305).
FIGURE 6.
FIGURE 6.
Examples of colocalization of PEX5 and TOM20. A representative STED image of human fibroblasts transfected with GFP-SCP2 (blue), fixed, and immunolabeled for PEX5 (red) and TOM20 (green) is shown. Also shown are an overview image (left panel) and zooms I–III (right panels) of the respective highlighted areas in the overview images, visualizing events of colocalization between PEX5 and TOM20 (white arrows). Scale bars, 2 (overview) and 0.5 μm (zooms).
FIGURE 7.
FIGURE 7.
Compartmentalization of peroxisomal membrane proteins. A, anticorrelation between compartmentalization and colocalization of PEX5 versus PEX14 (left) and PEX11 versus PEX14 (right). Normalized frequency plots of value pairs of average nearest distance between maxima within the intensity distribution (as a measure of compartmentalization) and Pearson's colocalization test from single peroxisomes (5439 for PEX5-PEX14 and 6178 for PEX11-PEX14) are shown. B, representative patterns of the intensity distribution in the circular regions around single peroxisomes from PEX5 and PEX14 (upper two panels) and PEX11 and PEX14 (lower two panels) derived from dual color STED images and ordered from the highest to the lowest Pearson's test colocalization value (left to right as labeled). Only the extreme cases of high and low colocalization are shown; medium cases are left out (white boxes; for full sequences see supplemental Fig. 2). C, representative dual color STED images of PEX5 (green) and PEX14 (red) (upper panels) as well as PEX11 (green) and PEX14 (red) (lower panels) for strong colocalization (Pearson's test values >0.6) and low compartmentalization of both proteins (left panels) and for low colocalization (Pearson's test values <0.4) and high compartmentalization of both proteins (right panels). Scale bars, 200 nm.
FIGURE 8.
FIGURE 8.
A, example of synchronized appearance of ringlike PEX5-PEX14 intensity distribution patterns around single peroxisomes. A representative dual color STED image of human fibroblasts fixed and immunolabeled for the PEX5 (green) and PEX14 (red), overview image (main panel), and zoom (inset) of the marked area depicting the ringlike patterns are shown. Scale bars, 5 (overview) and 1 μm (inset). B, four-color imaging. Representative confocal (upper left corner) and STED (lower right) images of fixed human fibroblast cells transfected with GFP-SCP2 (cyan; always confocal mode), fixed, and immunolabeled for PEX5 (green), PEX14 (red), and β-actin (gray) are shown. Scale bar, 5 μm.

References

    1. Smith J. J., and Aitchison J. D. (2013) Peroxisomes take shape. Nat. Rev. Mol. Cell Biol. 14, 803–817 - PMC - PubMed
    1. Kunau W.-H. (2006) Peroxisomes: morphology, function, biogenesis and disorders. Biochim. Biophys. Acta 1763, 1363–1808
    1. Gabaldón T. (2010) Peroxisome diversity and evolution. Philos. Trans. R. Soc. Lond. B Biol. Sci. 365, 765–773 - PMC - PubMed
    1. Islinger M., Grille S., Fahimi H. D., and Schrader M. (2012) The peroxisome: an update on mysteries. Histochem. Cell Biol. 137, 547–574 - PubMed
    1. Braverman N. E., and Moser A. B. (2012) Functions of plasmalogen lipids in health and disease. Biochim. Biophys. Acta 1822, 1442–1452 - PubMed

Publication types

MeSH terms

LinkOut - more resources