. 2016 Oct;29(10):1143-54.
doi: 10.1038/modpathol.2016.112. Epub 2016 Jun 17.

Validation of tumor protein marker quantification by two independent automated immunofluorescence image analysis platforms

Affiliations

Validation of tumor protein marker quantification by two independent automated immunofluorescence image analysis platforms

Amy R Peck et al. Mod Pathol. 2016 Oct.

Abstract

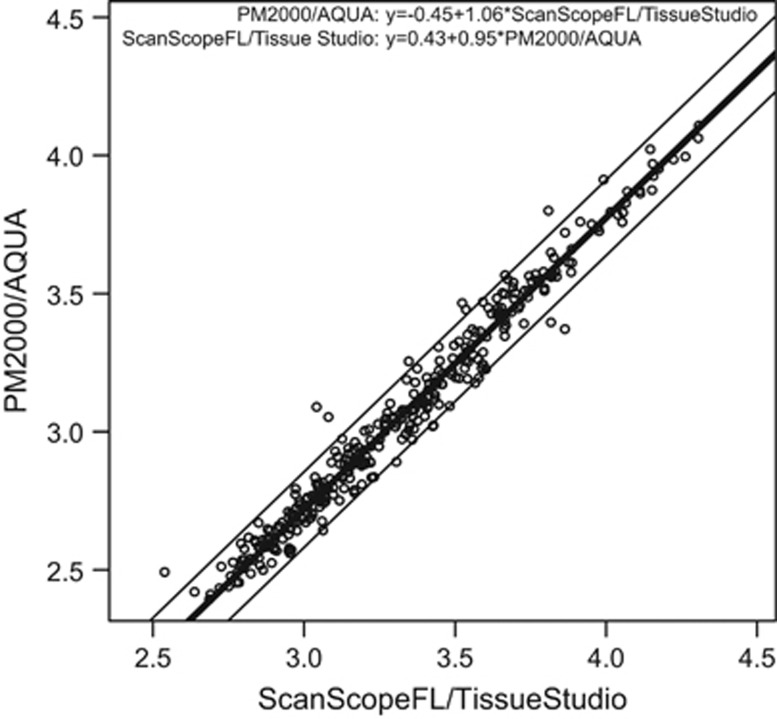
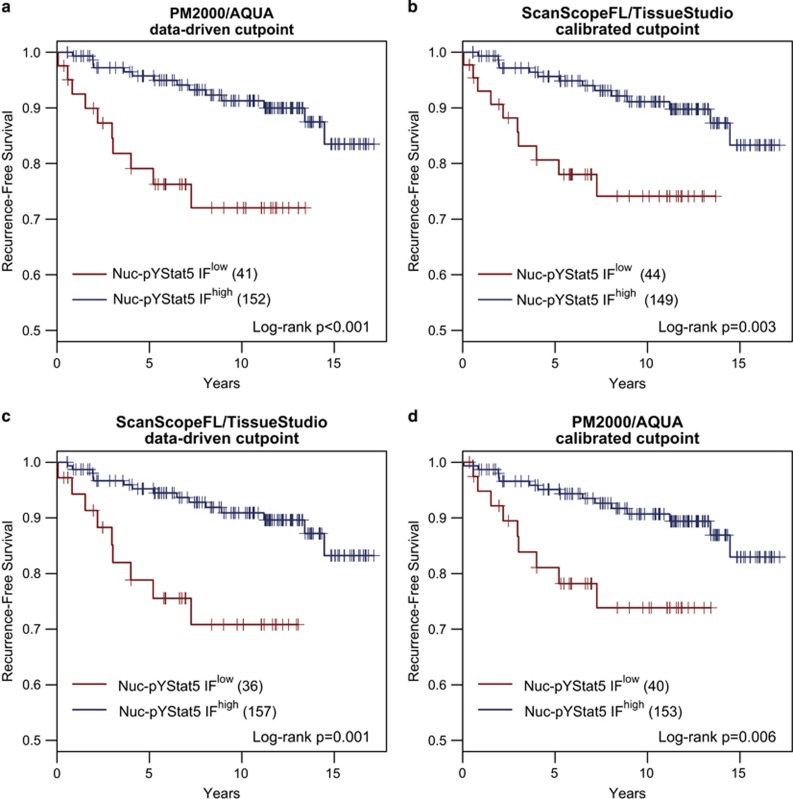
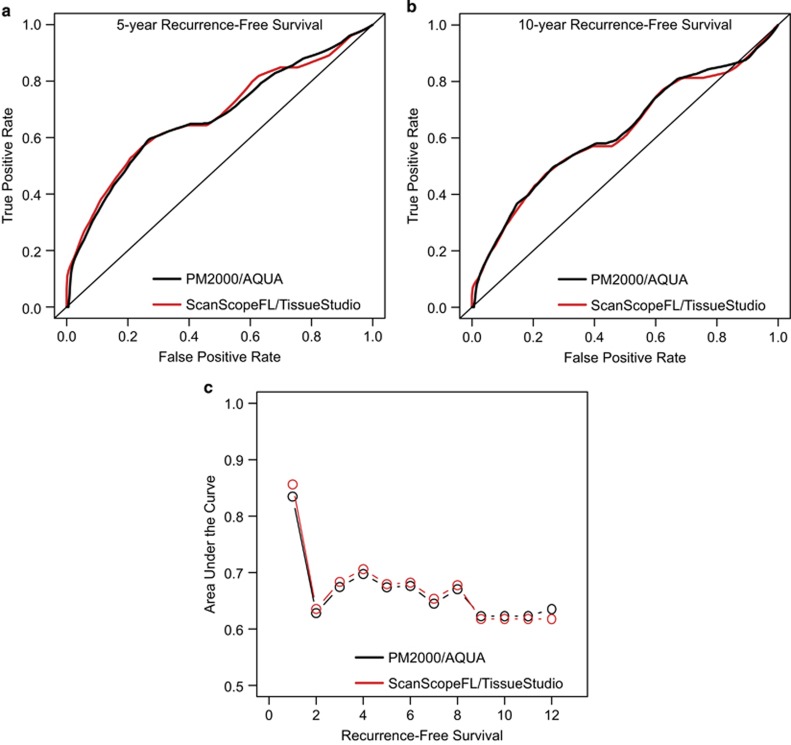
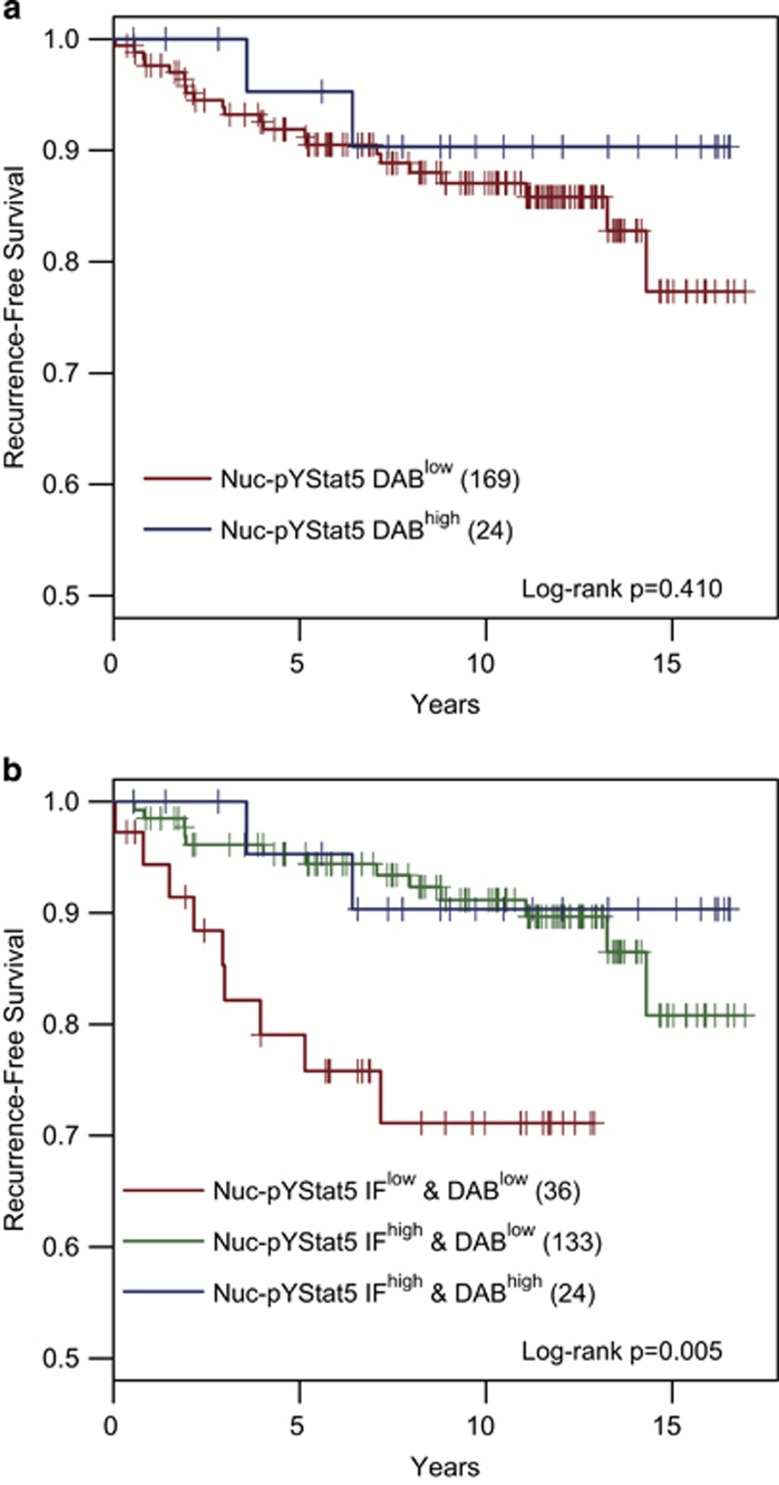
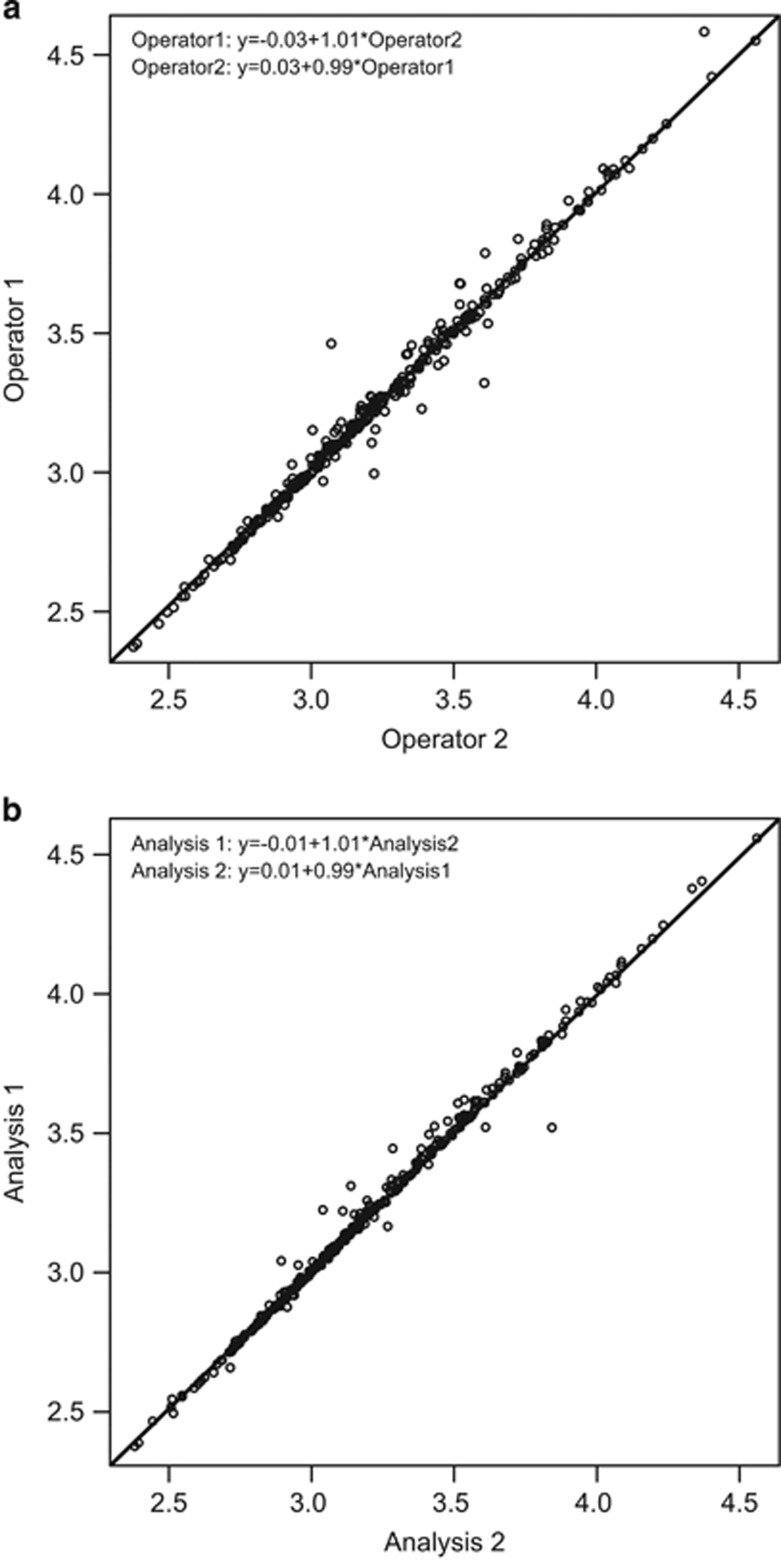
Protein marker levels in formalin-fixed, paraffin-embedded tissue sections traditionally have been assayed by chromogenic immunohistochemistry and evaluated visually by pathologists. Pathologist scoring of chromogen staining intensity is subjective and generates low-resolution ordinal or nominal data rather than continuous data. Emerging digital pathology platforms now allow quantification of chromogen or fluorescence signals by computer-assisted image analysis, providing continuous immunohistochemistry values. Fluorescence immunohistochemistry offers greater dynamic signal range than chromogen immunohistochemistry, and combined with image analysis holds the promise of enhanced sensitivity and analytic resolution, and consequently more robust quantification. However, commercial fluorescence scanners and image analysis software differ in features and capabilities, and claims of objective quantitative immunohistochemistry are difficult to validate as pathologist scoring is subjective and there is no accepted gold standard. Here we provide the first side-by-side validation of two technologically distinct commercial fluorescence immunohistochemistry analysis platforms. We document highly consistent results by (1) concordance analysis of fluorescence immunohistochemistry values and (2) agreement in outcome predictions both for objective, data-driven cutpoint dichotomization with Kaplan-Meier analyses or employment of continuous marker values to compute receiver-operating curves. The two platforms examined rely on distinct fluorescence immunohistochemistry imaging hardware, microscopy vs line scanning, and functionally distinct image analysis software. Fluorescence immunohistochemistry values for nuclear-localized and tyrosine-phosphorylated Stat5a/b computed by each platform on a cohort of 323 breast cancer cases revealed high concordance after linear calibration, a finding confirmed on an independent 382 case cohort, with concordance correlation coefficients >0.98. Data-driven optimal cutpoints for outcome prediction by either platform were reciprocally applicable to the data derived by the alternate platform, identifying patients with low Nuc-pYStat5 at ~3.5-fold increased risk of disease progression. Our analyses identified two highly concordant fluorescence immunohistochemistry platforms that may serve as benchmarks for testing of other platforms, and low interoperator variability supports the implementation of objective tumor marker quantification in pathology laboratories.


Conflict of interest statement

The authors have no financial relation to any of the companies mentioned in this report. HR owns equity in Advantex BioReagents LLC (Houston, TX), which holds intellectual property rights to Nuc-pYStat5 in breast cancer diagnostics. The views expressed in this article are those of the author and do not reflect the official policy of the Department of Defense, or U.S. Government.

Figures

Figure 1
Figure 1
Two technologically distinct platforms for fluorescent image capture and quantitative analysis produce highly concordant quantitative immunohistochemistry values. Quantitative fluorescence immunohistochemistry for nuclear pYStat5 was performed on a cohort of 323 breast cancer patients using two distinct methodologies, PM2000 image capture/AQUA software (PM2000/AQUA) and ScanScopeFL image capture/TissueStudio software (ScanScopeFL/TissueStudio). Log-transformed fluorescence immunohistochemistry values from each platform are displayed by scatter plot. Assay comparison analysis subsequently was performed to generate linear calibration equations from the Bland–Altman difference vs mean regression. The thick line corresponds to the conversion equation from Tissue Studio to AQUA log-transformed values, and the thin lines represent the transformed 95% limits of agreement. The two fluorescence immunohistochemistry methodologies showed excellent concordance following linear calibration.
Figure 2
Figure 2
AQUA and Tissue Studio quantification and data-driven dichotomization of nuclear pYStat5 levels reproducibly identify a similar subset of estrogen receptor-positive breast cancer patients with low tumor levels of nuclear pYStat5 at increased risk of disease recurrence. Quantitative fluorescence immunohistochemistry values were computed for Nuc-pYStat5 in 193 estrogen receptor-positive breast cancer specimens using the PM2000/AQUA and ScanScopeFL/TissueStudio platforms. Data-driven, objective cutpoints to identify tumors with low fluorescent immunohistochemistry-detected Nuc-pYStat5 (Nuc-pYStat5 IFlow) or high Nuc-pYStat5 (Nuc-pYStat5 IFhigh) were derived from data generated on the (a) PM2000/AQUA or (c) ScanScopeFL/TissueStudio platform, and Kaplan–Meier analysis of recurrence-free survival was performed for each platform. Both platforms identified a similar sub-population of patients whose tumors displayed low Nuc-pYStat5 (≈20%) and were at increased risk of recurrence. The data-driven optimal cutpoint for PM2000/AQUA was linearly calibrated to the (b) ScanScopeFL/TissueStudio data using the equation ScanScopeFL/TissueStudio=0.43+0.95 × PM2000/AQUA and the data-driven optimal cutpoint for ScanScopeFL/TissueStudio was linearly calibrated for the (d) PM2000-AQUA data using the equation PM2000/AQUA=−0.45+1.06 × ScanScopeFL/TissueStudio. Calibrated cutpoints derived from one platform were then applied to the fluorescence immunohistochemistry values of the alternative platform and subjected to a second Kaplan–Meier analysis (b and d).
Figure 3
Figure 3
AQUA and Tissue Studio quantification of nuclear pYStat5 levels yielded excellent agreement in clinical outcome prediction based on continuous marker levels. Quantitative fluorescence immunohistochemistry values computed for Nuc-pYStat5 in 193 estrogen receptor-positive breast cancer specimens using the PM2000-AQUA and ScanScopeFL/TissueStudio platforms were used to generate receiver-operating curves for the two platforms for (a) 5-year and b) 10-year recurrence-free survival. Similar results were observed for corresponding receiver-operator curves computed across all years 1–12 (Supplementary Figure 4), resulting in overlapping area under the receiver-operating curve values (c). Notably, this analysis used the raw Nuc-pYStat5 values from each fluorescence immunohistochemistry platform and calibration of the values was not necessary.
Figure 4
Figure 4
Increased dynamic range of fluorescence immunohistochemistry provides novel information about nuclear pYStat5 expression in breast cancer. Nuclear pYStat5 was evaluated in 193 estrogen receptor-positive breast cancer tumors, comparing standard chromogen immunohistochemistry with pathologist manual scoring and fluorescence immunohistochemistry data. (a) Pathologist determination of positive (DABhigh) and negative (DABlow), as determined by ≥1% immunoreactive nuclei, did not readily identify Nuc-pYStat5 as a marker of breast cancer recurrence in Kaplan–Meier analysis of ER-positive breast cancer patients. (b) Patients were stratified into three groups based on high/low Nuc-pYStat5 tumor status as determined by fluorescence immunohistochemistry (IFhigh, IFlow) and positive/negative Nuc-pYStat5 tumor status as determined by chromogen immunohistochemistry (DABhigh, DABlow) and time to breast cancer recurrence was analyzed. Greater resolution and sensitivity of fluorescence immunohistochemistry allowed identification of patients with the lowest Nuc-pYStat5-expressing tumors at elevated risk of recurrence.
Figure 5
Figure 5
Validation of inter- and intraoperator variability for Tissue Studio analysis of Nuc-pYStat5 in breast cancer by fluorescence immunohistochemistry analysis. (a) Two operators (ARP and HR) followed the same standard operating procedure for Tissue Studio image analysis of levels of Nuc-pYStat5 within 336 breast cancer specimens in tissue microarray format, independently selecting tumor tissue features from 12 of the specimens for region-of-interest training according to established guidelines. Interoperator concordance analysis showed high concordance correlation coefficient of 0.993 (95% confidence interval: 0.991, 0.994). (b) Intraoperator concordance analysis showed high concordance correlation coefficient of 0.996 (95% confidence interval: 0.995, 0.997) on repeated analysis by the same operator (ARP) using Tissue Studio image analysis. Solid line indicates the line of perfect agreement.

References

    1. McCabe A, Dolled-Filhart M, Camp RL et al. Automated quantitative analysis (AQUA) of in situ protein expression, antibody concentration, and prognosis. J Natl Cancer Inst 2005;97:1808–1815. - PubMed
    1. Camp RL, Chung GG, Rimm DL. Automated subcellular localization and quantification of protein expression in tissue microarrays. Nat Med 2002;8:1323–1327. - PubMed
    1. Rimm DL. What brown cannot do for you. Nat Biotechnol 2006;24:914–916. - PubMed
    1. Lee JW. Method validation and application of protein biomarkers: basic similarities and differences from biotherapeutics. Bioanalysis 2009;1:1461–1474. - PubMed
    1. Cummings J, Ward TH, Dive C. Fit-for-purpose biomarker method validation in anticancer drug development. Drug Discov Today 2010;15:816–825. - PubMed

Publication types

MeSH terms

Substances