. 2016 Jun 16;8(1):68.
doi: 10.1186/s13073-016-0322-z.

B-cell repertoire dynamics after sequential hepatitis B vaccination and evidence for cross-reactive B-cell activation

Affiliations

B-cell repertoire dynamics after sequential hepatitis B vaccination and evidence for cross-reactive B-cell activation

Jacob D Galson et al. Genome Med. .

Erratum in

Abstract

Background: A diverse B-cell repertoire is essential for recognition and response to infectious and vaccine antigens. High-throughput sequencing of B-cell receptor (BCR) genes can now be used to study the B-cell repertoire at great depth and may shed more light on B-cell responses than conventional immunological methods. Here, we use high-throughput BCR sequencing to provide novel insight into B-cell dynamics following a primary course of hepatitis B vaccination.

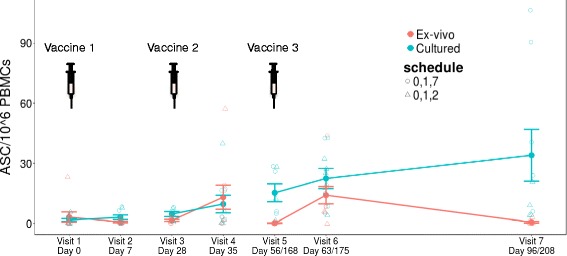
Methods: Nine vaccine-naïve participants were administered three doses of hepatitis B vaccine (months 0, 1, and 2 or 7). High-throughput Illumina sequencing of the total BCR repertoire was combined with targeted sequencing of sorted vaccine antigen-enriched B cells to analyze the longitudinal response of both the total and vaccine-specific repertoire after each vaccine. ELISpot was used to determine vaccine-specific cell numbers following each vaccine.

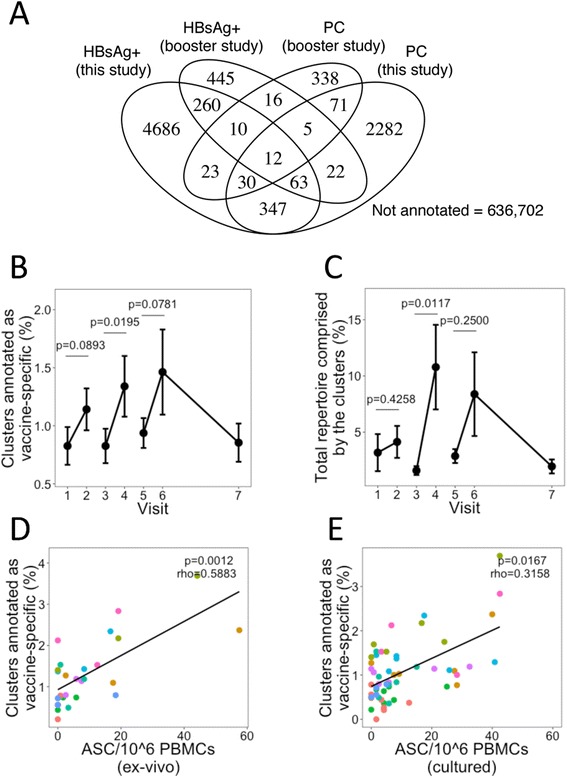
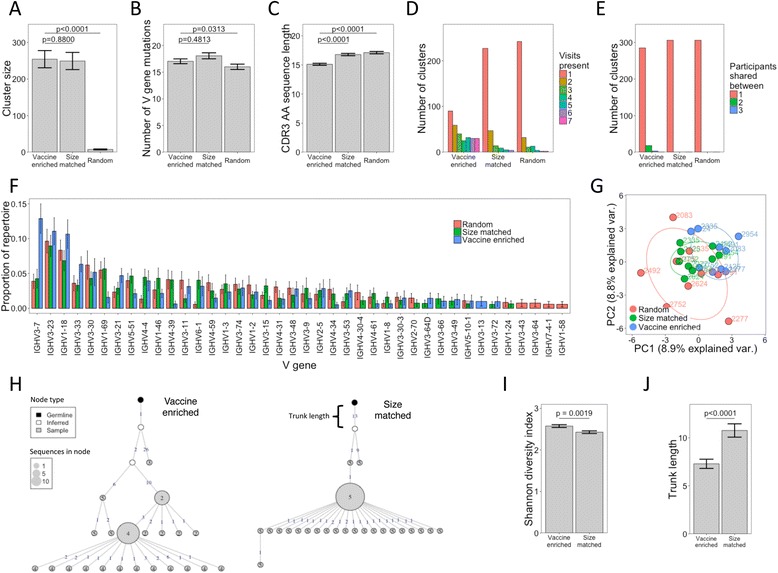
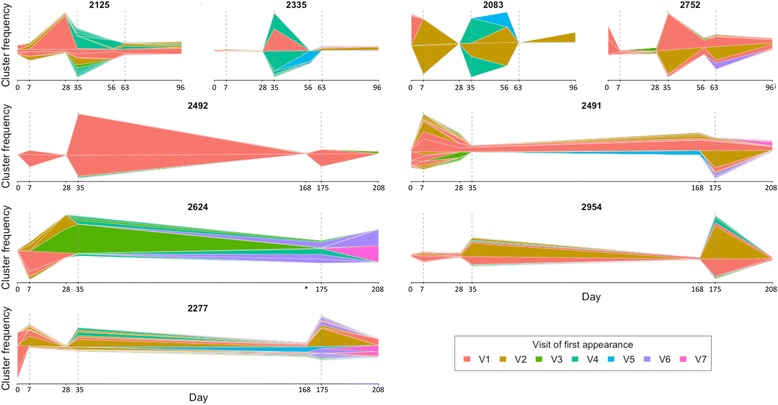
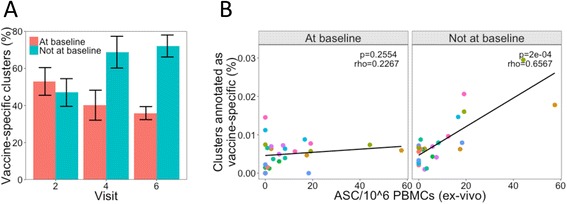
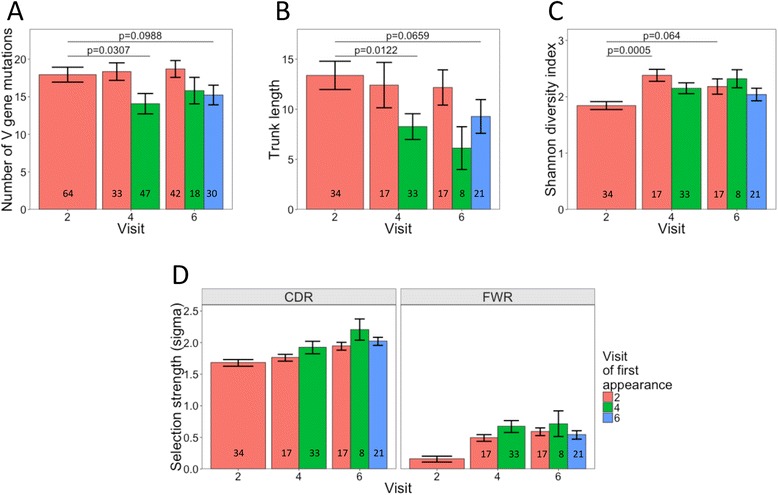
Results: Deconvoluting the vaccine-specific from total BCR repertoire showed that vaccine-specific sequence clusters comprised <0.1 % of total sequence clusters, and had certain stereotypic features. The vaccine-specific BCR sequence clusters were expanded after each of the three vaccine doses, despite no vaccine-specific B cells being detected by ELISpot after the first vaccine dose. These vaccine-specific BCR clusters detected after the first vaccine dose had distinct properties compared to those detected after subsequent doses; they were more mutated, present at low frequency even prior to vaccination, and appeared to be derived from more mature B cells.

Conclusions: These results demonstrate the high-sensitivity of our vaccine-specific BCR analysis approach and suggest an alternative view of the B-cell response to novel antigens. In the response to the first vaccine dose, many vaccine-specific BCR clusters appeared to largely derive from previously activated cross-reactive B cells that have low affinity for the vaccine antigen, and subsequent doses were required to yield higher affinity B cells.

Keywords: Antibody; B-cell repertoire; Hepatitis B; Polyreactive; VDJ; Vaccination.


Figures

Fig. 1
Fig. 1
HBsAg-specific B-cell response kinetics determined by ELISpot and expressed as the number of antibody-secreting cells (ASC) per 106 peripheral blood mononuclear cells (PBMCs) used in each assay. PBMCs are used ex vivo to detect PCs and are cultured to detect memory cells. Shown are the mean values ± standard error of the mean (SEM) for all nine participants. Detailed plots for each participant are shown in Additional file 1: Figure S2
Fig. 2
Fig. 2
Fluctuations in the total repertoire. a Mean percentage of the total repertoire comprising the 50 most frequent clusters at each day (see also Additional file 1: Figure S3). b Mean number of V gene mutations from all sequences in the repertoire. c Mean CDR3 AA sequence length from all sequences in the repertoire. For ac, error bars indicate ± SEM from nine participants. d The percentage of clusters shared by each pair of participants at each visit was determined (nine participants, giving 36 pairings). Shown are the mean values ± SEM of the percentage of clusters shared between each pair. Percent is calculated as (A∩B/size(A∪B)) × 100. Shared clusters are defined as those which share the same V and J gene segment and cluster center CDR3 nucleotide sequence. All p values were obtained from Mann–Whitney U tests
Fig. 3
Fig. 3
Enriching vaccine-specific clusters from the total repertoire. a The number of clusters from the total repertoire which were annotated by the four vaccine-enriched sequence datasets. b The percentage of abundant (>0.01 % of total repertoire) clusters at each visit that were characterized as vaccine-specific based on being annotated by at least two of the vaccine-enriched datasets. c Same as b but corrected for cluster size by considering the percentage of the repertoire comprising the vaccine-specific clusters. For b and c, mean values ± SEM are shown for all nine participants and p values were obtained from two-sided Mann–Whitney U tests. d Correlation (Spearman) between the percentage of abundant clusters characterized as vaccine-specific and PC numbers determined by ELISpot. Different colored points represent samples from the different participants. e Same as d but correlated with memory cell numbers determined by ELISpot. For d and e, samples where no cells were detected by ELISpot have been omitted
Fig. 4
Fig. 4
Comparing vaccine-specific clusters to a size-matched random set of clusters and a non-size-matched random set of clusters. ac Differences in size, number of V gene mutations, and CDR3 AA sequence length of the clusters belonging to the three datasets. Shown are the mean values ± SEM of the 312 clusters in each dataset. Comparisons were performed using a t-test. d The number of visits where at least a single sequence from each cluster was found was determined and the number of clusters present at different numbers of visits in the different datasets plotted. e Same as d but counting the number of participants where a similar cluster was found (same CDR3 cluster center sequence and V/J gene usage). f The proportion of total clusters in the three different datasets utilizing different V gene segments in each participant. Error bars show mean values ± SEM of the nine participants. g Principal component analysis of V gene segment usage of the clusters in each of the datasets. h Representative lineage trees of a vaccine-specific and size-matched cluster. Each node represents a unique sequence within the cluster, with the size indicative of the number of duplicate sequences. The number within the node indicates the visit at which the sequence is first present. Shading of the node represents whether the sequence is found in the cluster, an inferred common ancestor to sequences found in the cluster, or the germline sequence. Numbers on the edges of adjoining nodes show the number of mutations between the sequences. i, j Lineage trees were created for all clusters which contained at least 50 sequences in the dataset (N = 200). Diversity was calculated for each cluster using the Shannon index and trunk length is the number of mutations between the most recent common ancestor and germline sequence. Shown are the mean values ± SEM. Comparisons were performed using a t-test
Fig. 5
Fig. 5
Kinetics of the vaccine-enriched clusters. The vaccine-enriched clusters were found in each participant and, at each day, the frequencies of these clusters are plotted as a stacked bar chart, centered to the middle of the y-axis. Clusters from each day are then joined using a horizontal stream to illustrate how the frequency of the clusters changes over time. The width of the stream represents the frequency of the cluster at that time and the color of the stream represents the first visit at which sequences from the cluster can be found. The top four plots are from participants who were given the accelerated vaccine schedule and the bottom five plots are from participants who were given the conventional vaccine schedule. Dotted vertical lines highlight the day 7 post-vaccination visits. *The day 168 blood sample was missing from this participant but the vaccine was still given on this day. See also Additional file 1: Figure S4 and Table S3 for kinetics of vaccine-enriched clusters as defined by similarity to previously publish HBsAg-specific monoclonal antibody sequences
Fig. 6
Fig. 6
Vaccine-enriched clusters present at baseline. a In each of the nine participants, of the vaccine-specific clusters present at each post-vaccination time point (visit 2, 4, or 6), the percentage of these that were also present at baseline was determined. Mean ± SEM shown. b Correlation (Spearman) between the percentage of abundant clusters characterized as vaccine-specific and PC numbers determined by ELISpot, split according to whether the vaccine-specific clusters are also present at baseline. Different colored points represent samples from the different participants
Fig. 7
Fig. 7
Properties of vaccine-enriched clusters present at each of the three day 7 post-vaccination visits. At each visit, the clusters were split according to the visit when they were first identified. a Difference in number of V gene mutations of vaccine-enriched clusters at each visit. b, c Lineage trees were constructed where these clusters contained at least 25 sequences and the trunk length (b) and sequence diversity within the lineage (c) calculated for each. Mean values ± SEM are shown and the number of clusters is indicated at the bottom of each bar. Comparisons were performed using a Mann–Whitney U test. See also Additional file 1: Figure S5. d Difference in selection strength in the CDR and framework regions (FWR) of the clusters identified at different visits. Mean values ± 95 % confidence interval are shown

References

    1. Glanville J, Zhai W, Berka J, Telman D, Huerta G, Mehta GR, et al. Precise determination of the diversity of a combinatorial antibody library gives insight into the human immunoglobulin repertoire. Proc Natl Acad Sci U S A. 2009;106:20216–20221. doi: 10.1073/pnas.0909775106. - DOI - PMC - PubMed
    1. Galson JD, Trück J, Fowler A, Clutterbuck EA, Münz M, Cerundolo V, et al. Analysis of B cell repertoire dynamics following hepatitis B vaccination in humans, and enrichment of vaccine-specific antibody sequences. EBioMedicine. 2015;2:2070–2079. doi: 10.1016/j.ebiom.2015.11.034. - DOI - PMC - PubMed
    1. Laserson U, Vigneault F, Gadala-Maria D, Yaari G, Uduman M, Vander Heiden JA, et al. High-resolution antibody dynamics of vaccine-induced immune responses. Proc Natl Acad Sci U S A. 2014;111:4928–4933. doi: 10.1073/pnas.1323862111. - DOI - PMC - PubMed
    1. Jackson KJL, Liu Y, Roskin KM, Glanville J, Hoh RA, Seo K, et al. Human responses to influenza vaccination show seroconversion signatures and convergent antibody rearrangements. Cell Host Microbe. 2014;16:105–114. doi: 10.1016/j.chom.2014.05.013. - DOI - PMC - PubMed
    1. Wang C, Liu Y, Cavanagh MM, Le Saux S, Qi Q, Roskin KM, et al. B-cell repertoire responses to varicella-zoster vaccination in human identical twins. Proc Natl Acad Sci U S A. 2014;112:500–505. doi: 10.1073/pnas.1415875112. - DOI - PMC - PubMed

Substances

LinkOut - more resources