

MultiQC: summarize analysis results for multiple tools and samples in a single report
- PMID: 27312411
- PMCID: PMC5039924
- DOI: 10.1093/bioinformatics/btw354
MultiQC: summarize analysis results for multiple tools and samples in a single report
Abstract
Motivation: Fast and accurate quality control is essential for studies involving next-generation sequencing data. Whilst numerous tools exist to quantify QC metrics, there is no common approach to flexibly integrate these across tools and large sample sets. Assessing analysis results across an entire project can be time consuming and error prone; batch effects and outlier samples can easily be missed in the early stages of analysis.
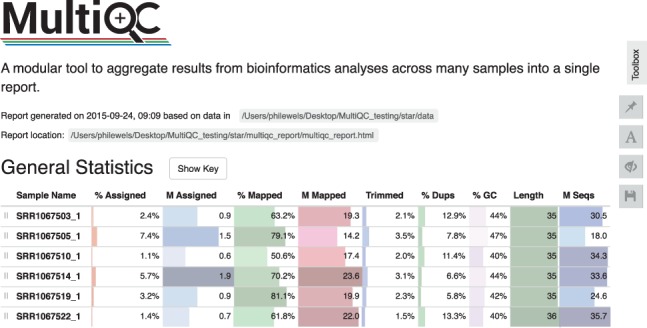
Results: We present MultiQC, a tool to create a single report visualising output from multiple tools across many samples, enabling global trends and biases to be quickly identified. MultiQC can plot data from many common bioinformatics tools and is built to allow easy extension and customization.
Availability and implementation: MultiQC is available with an GNU GPLv3 license on GitHub, the Python Package Index and Bioconda. Documentation and example reports are available at http://multiqc.info
Contact: phil.ewels@scilifelab.se.
© The Author 2016. Published by Oxford University Press.
Figures
References
-
- Hunter J.D. (2007) Matplotlib: A 2D Graphics Environment. Comput. Sci. Eng., 9, 9095.
MeSH terms
LinkOut - more resources
Full Text Sources
Other Literature Sources
Molecular Biology Databases
