. 2016 Jun 17:6:28083.
doi: 10.1038/srep28083.

A novel TP53 pathway influences the HGS-mediated exosome formation in colorectal cancer

Affiliations

A novel TP53 pathway influences the HGS-mediated exosome formation in colorectal cancer

Yulin Sun et al. Sci Rep. .

Abstract

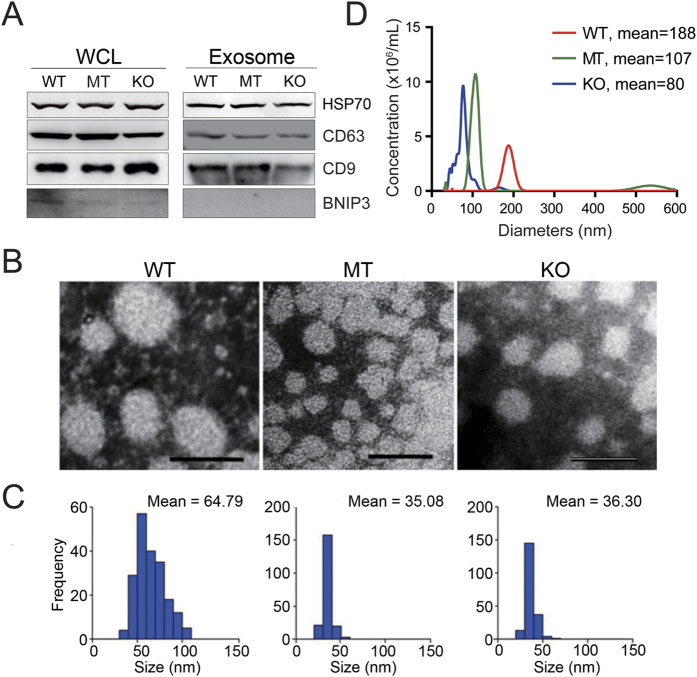
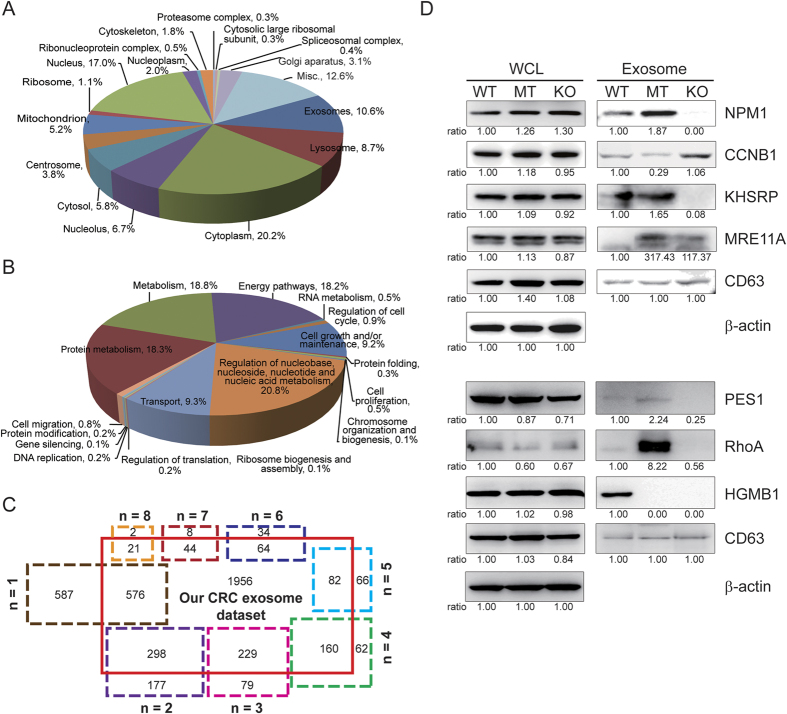
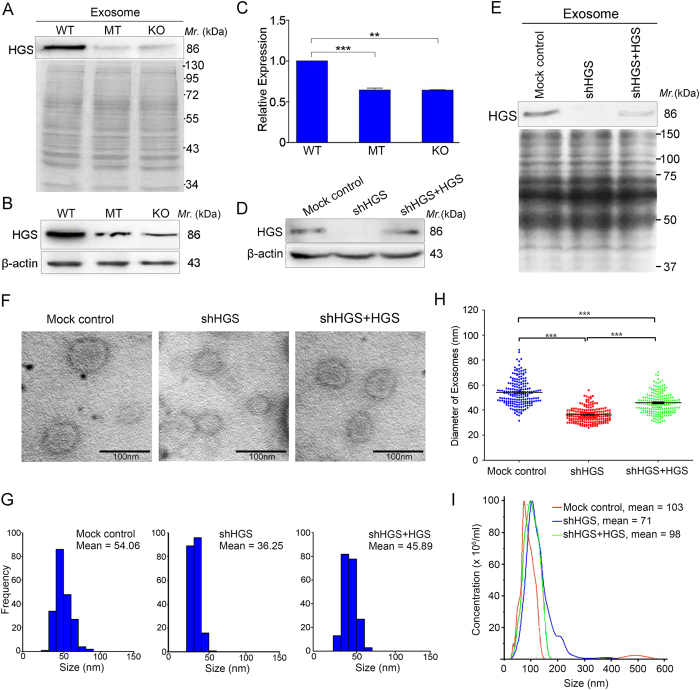
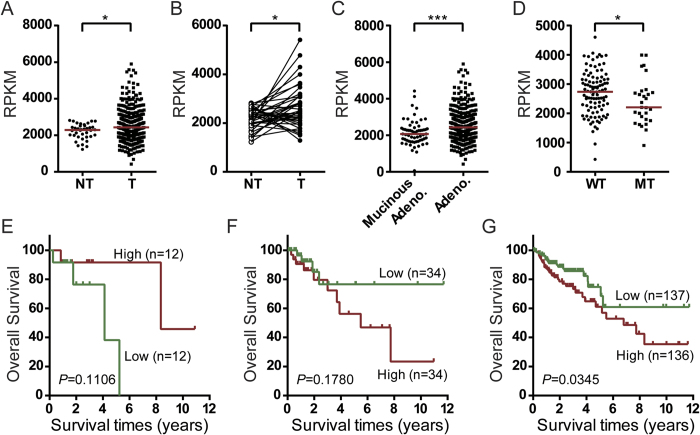
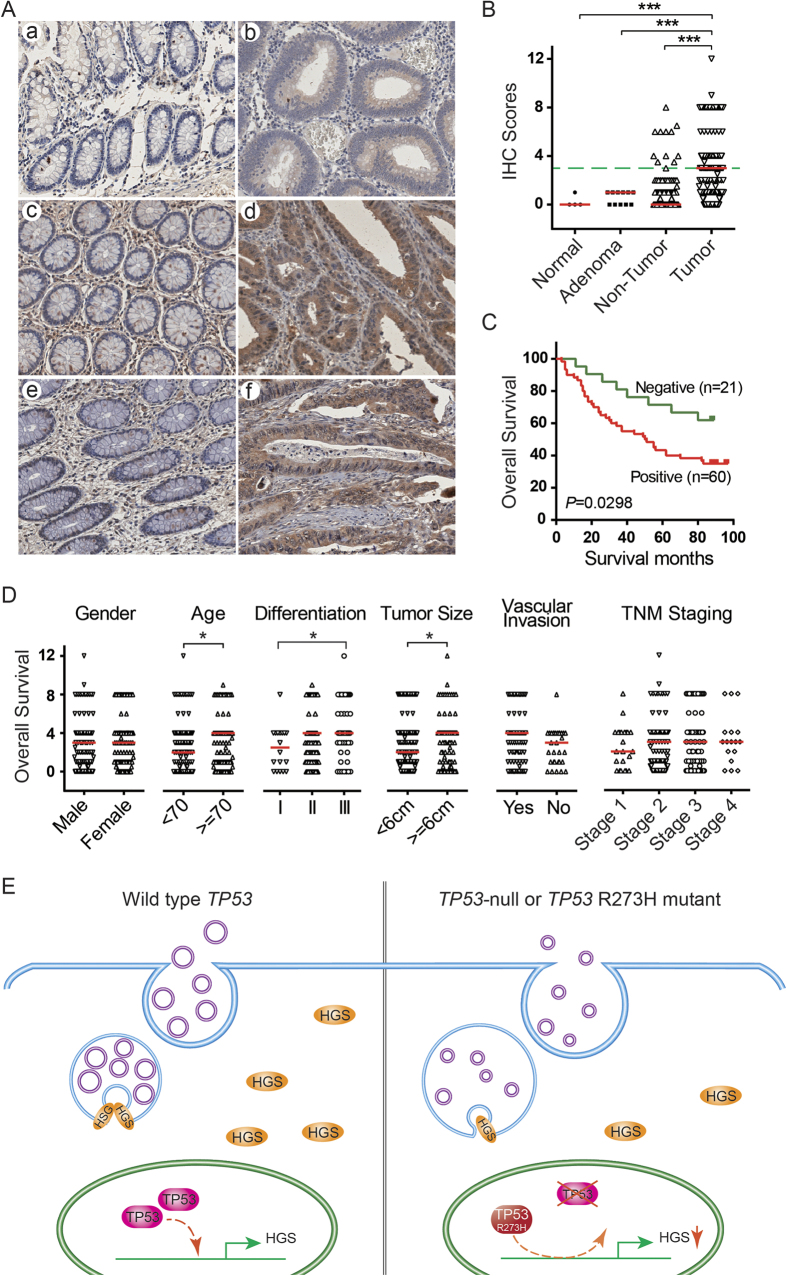
Tumor-derived exosomes are important for cell-cell communication. However, the role of TP53 in the control of exosome production in colorectal cancer (CRC) is controversial and unclear. The features of exosomes secreted from HCT116 TP53-wild type (WT), TP53-knockout (KO) and constructed TP53 (R273H)-mutant (MT) cells were assessed. The exosomes from the MT and KO cells exhibited significantly reduced sizes compared with the WT cells. A comprehensive proteomic analysis of exosomal proteins was performed using the isobaric tag for relative and absolute quantitation (iTRAQ)-2D-LC-MS/MS strategy. A total of 3437 protein groups with ≥2 matched peptides were identified. Specifically, hepatocyte growth factor-regulated tyrosine kinase substrate (HGS) was consistently down-regulated in the exosomes from the MT and KO cells. Functional studies demonstrated that low HGS levels were responsible for the decreased exosome size. TP53 regulated HGS expression and thus HGS-dependent exosome formation. Furthermore, the HGS expression was gradually increased concomitant with CRC carcinogenesis and was an independent poor prognostic factor. In conclusion, a novel HGS-dependent TP53 mechanism in exosome formation was identified in CRC. HGS may serve as a novel prognostic biomarker and a candidate target for therapeutic interventions.


Figures

Figure 1
Figure 1. Exosomes purified from HCT116 cells with different TP53 statuses exhibit distinct sizes.
(A) Western blot analysis of whole cell lysates (WCL) and vesicles isolated from serum-free conditional media from wild-type TP53 (WT), TP53 (R273H) mutant (MT) and TP53-null (KO) HCT116 cells. The exosomal markers HSP70, CD63 and CD9 and the mitochondrial protein BNIP3 were detected. The experiments were performed at least in triplicate. (B) Electron micrograph of exosomes isolated from WT, MT and KO cells. Negative-staining images indicated that the exosomes exhibited a smooth, saucer-like morphology. Scale bars are 100 nm. (C) The mean diameter distribution of 200 exosomes was calculated from electron micrograph images, and the exosome frequency was plotted for the indicated sizes. (D) Representative size distribution of exosomes isolated from three groups via NanoSight particle-tracking analysis.
Figure 2
Figure 2. Bioinformatics analysis and Western blotting validation of 3437 quantified exosomal proteins.
(A) Pie chart of the significantly enriched cellular component analysis based on Gene Ontology annotation. Classifications that contained <0.3% of the total proteins were categorized as miscellaneous (Misc.). (B) Pie chart of the biological process analysis based on Gene Ontology annotation. (C) Venn diagram indicates the presence, absence, or overlap of proteins identified by our iTRAQ-2D-LC-MS/MS strategy and 2489 previously reported exosomal proteins in CRC cells derived from 8 proteomic studies. These 2489 known proteins were categorized into 8 groups based on their identification number counts, which ranged from n = 1 to n = 8. The higher identified counts represented higher reliability. (D) Western blotting validation of the differentially expressed exosomal proteins. The densitometry was performed to quantify each lane, and the ratio of each protein over the loading control β-actin in the whole cell lysate or CD63 in exosome is presented under each blot, with the ratio in the WT cells being the reference value. Based on our quantitative proteomic results, the CD63 expression was relatively consistent among the three types of exosomes, thus it was used as a loading control for exosome fraction in this study. The representative Coomassie blue-stained SDS-PAGE gel was shown in Supplementary Fig. S3. The results indicate equivalent levels of exosomal proteins in the three preparations.
Figure 3
Figure 3. HGS depletion results in smaller exosomes.
(A) Confirmation of the HGS levels in exosomes from different cell lines using Western blotting. A Coomassie blue-stained SDS-PAGE gel was used as the loading control. (B) HGS protein levels detected by Western blotting in the whole cell lysates from wild-type TP53 (WT), TP53 (R273H)-mutant (MT) and TP53-null (KO) HCT116 cells. β-actin was used as the internal control. (C) Real-time PCR detection of the HGS mRNA levels in the WT, MT and KO cells. **P < 0.01; ***P < 0.001. (D) Knockdown and rescue of HGS in HCT116 cells. The HCT116 cells were stably transfected with pLKO.1-shHGS or the mock control plasmid using lentiviruses. For the rescue experiments, HGS was ectopically expressed in HCT116-shHGS cells via transfection with the pCMV6-Myc-DDK-HGS plasmid. β-actin was used as the internal control. (E) Western blotting detection of HGS levels in exosomes secreted from the HGS knockdown (HCT116-shHGS), HGS recovered (HCT116-shHGS-HGS) and mock control cells. A Coomassie blue-stained SDS-PAGE gel was used as the loading control. (F) Representative electron micrographs of exosomes isolated from serum-free conditional media collected from the indicated groups. Scale bar, 100 nm; direct magnification, 120,000x. (G) The mean diameter distribution of 200 exosomes was calculated from the electron micrograph images, and the exosome frequency was plotted for the indicated size. (H) Statistical analysis of the size distribution for exosomes derived from each group. n = 200 exosomes per group; ***P < 0.0001. (I) Representative size distribution of exosomes isolated from the indicated groups via NanoSight particle-tracking analysis.
Figure 4
Figure 4. HGS transcript expression was associated with TP53 status in the RNA-Seq dataset of colon cancer from TCGA.
In the University of California, Santa Cruz, genome browser database (UCSC, hg19), the HGS gene has two transcripts, uc002kbg.3 and uc010wus.2. The former transcript comprises the primary transcript, and its average abundance in CRC is more than 350-fold compared with uc010wus.2. In addition, the TP53 gene possesses 13 transcripts. Uc002gij.3 is the dominant full-length variant, whereas the other transcripts are barely expressed in CRC. Therefore, we performed these analyses based on uc002kbg.3 and uc002gij.3. (A) HGS mRNA was significantly up-regulated in the tumor tissues of patients with colon adenocarcinoma (n = 392) compared with the adjacent non-tumor tissues (n = 38). *P < 0.05. (B) In paired colon adenocarcinoma and non-tumor tissues (n = 38), the same tendency was observed. *P < 0.05. (C) For the two pathological subtypes of colon cancer, the HGS mRNA levels were significantly increased in the tumor tissues of adenocarcinoma (n = 392) compared with mucinous adenocarcinoma (n = 62). ***P < 0.0001. (D) In colon adenocarcinoma, the somatic mutation of the TP53 gene was validated in 130 patients. The HGS mRNA levels were significantly lower in the TP53 mutant group (MT, n = 29) compared with the wild-type group (WT, n = 101). *P < 0.05. (E) Kaplan-Meier curve of colon adenocarcinoma patients with TP53 mutation (n = 48). (F) Kaplan-Meier curve of colon adenocarcinoma patients with wild-type TP53 (n = 68). (G) Kaplan-Meier curve of all patients with colon adenocarcinoma (n = 273). Log-rank test was performed in (E–G).
Figure 5
Figure 5. Expression and clinicopathological characteristics of HGS protein in human CRC samples.
(A) Representative immunohistochemistry images of HGS expression in normal colorectal mucosa (a), tubular adenoma (b), adjacent non-tumor tissues (c,e) and CRC tumors (d,f) (x200 magnification). (B) Distribution of HGS levels determined by immunohistochemistry in the normal colorectal mucosa (n = 4), tubular adenoma (n = 11), adjacent non-tumor tissue and matched CRC tumor (n = 235) groups. The short red line represents the median value of each group. The green dashed line represents the threshold of positive staining. (C) Kaplan-Meier curve of CRC patients with negative and positive HGS expression. The log-rank test was performed. (D) Clinicopathological characteristic analysis of HGS expression in 235 CRC cases. The short red line represents the median value of each group. ***P < 0.0001; *P < 0.05. (E) A schematic diagram of the roles of TP53 in exosome production in CRC. Wild-type TP53 stimulates the high level expression of HGS. As a key molecule for MVB sorting, HGS recognizes and subsequently directs cargos to the endosomal lumen. With the cooperation of the other ESCRT complexes, the mature MVBs contain several ILVs that form and fuse with the plasma membrane to release their ILVs, which are referred to as exosomes. However, when TP53 is deficient or mutated at codon 273 (R273H), HGS expression is decreased. In this situation, HGS-dependent ILV formation is inhibited. Enlarged MVBs that contain uniformly small ILVs are present. HGS is necessary to maintain the size and control the components of exosomes.

References

    1. Jemal A. et al. Global cancer statistics. CA Cancer J. Clin. 61, 69–90 (2011). - PubMed
    1. Fearon E. R. & Vogelstein B. A genetic model for colorectal tumorigenesis. Cell 61, 759–767 (1990). - PubMed
    1. Markowitz S. D. & Bertagnolli M. M. Molecular origins of cancer: Molecular basis of colorectal cancer. N. Engl. J. Med. 361, 2449–2460 (2009). - PMC - PubMed
    1. Brosh R. & Rotter V. When mutants gain new powers: news from the mutant p53 field. Nature reviews. Cancer 9, 701–713 (2009). - PubMed
    1. Naccarati A. et al. Mutations and polymorphisms in TP53 gene–an overview on the role in colorectal cancer. Mutagenesis 27, 211–218 (2012). - PubMed

Publication types

MeSH terms

Substances