. 2016 Jun 16;5(6):e002860.
doi: 10.1161/JAHA.115.002860.

Systematic Evaluation of the Cellular Innate Immune Response During the Process of Human Atherosclerosis

Affiliations

Systematic Evaluation of the Cellular Innate Immune Response During the Process of Human Atherosclerosis

Rogier A van Dijk et al. J Am Heart Assoc. .

Abstract

Background: The concept of innate immunity is well recognized within the spectrum of atherosclerosis, which is primarily dictated by macrophages. Although current insights to this process are largely based on murine models, there are fundamental differences in the atherosclerotic microenvironment and associated inflammatory response relative to humans. In this light, we characterized the cellular aspects of innate immune response in normal, nonprogressive, and progressive human atherosclerotic plaques.

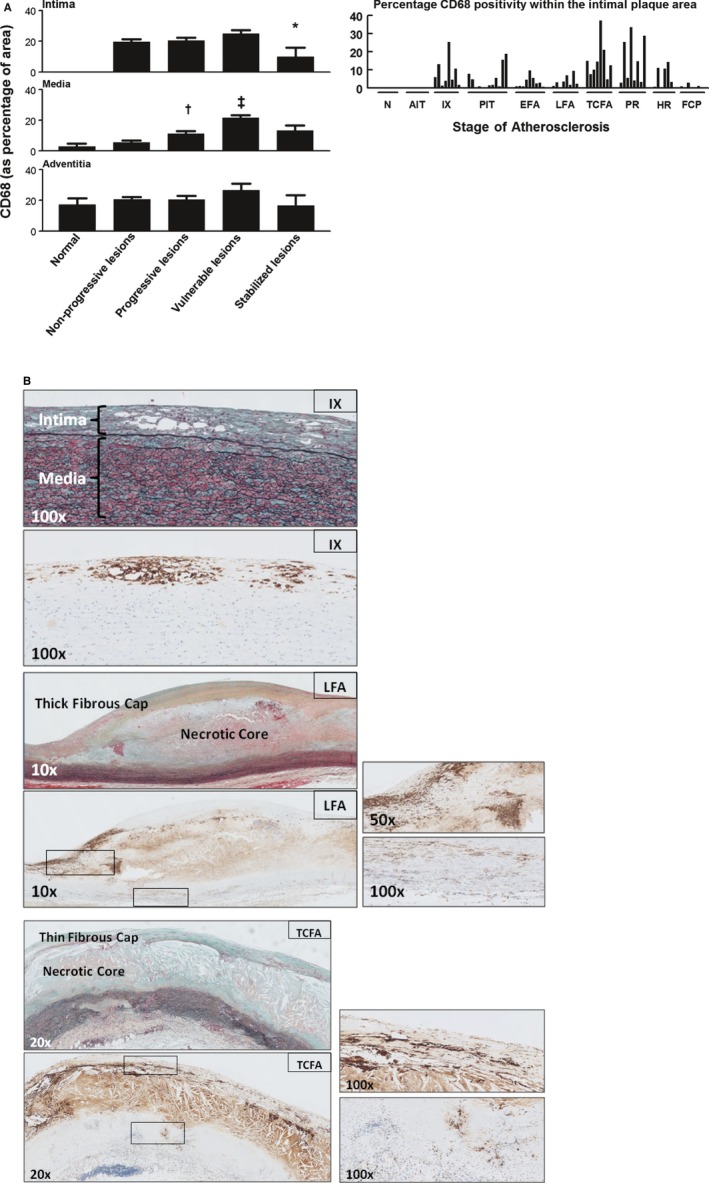
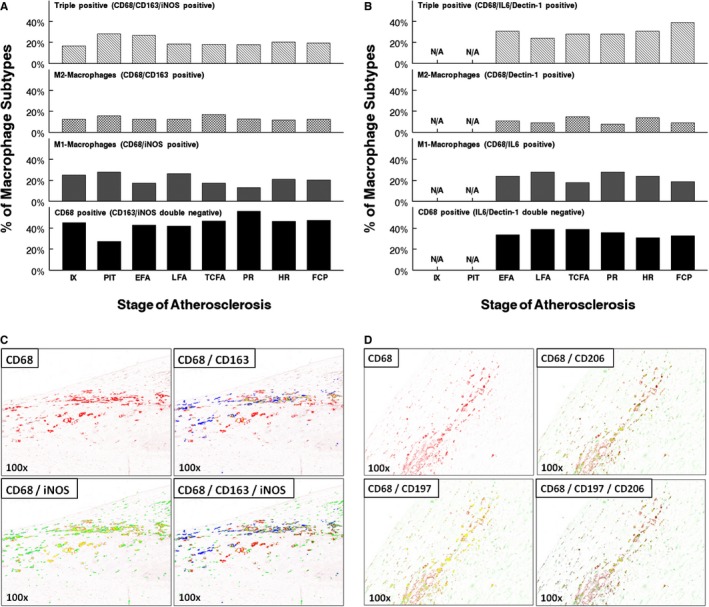
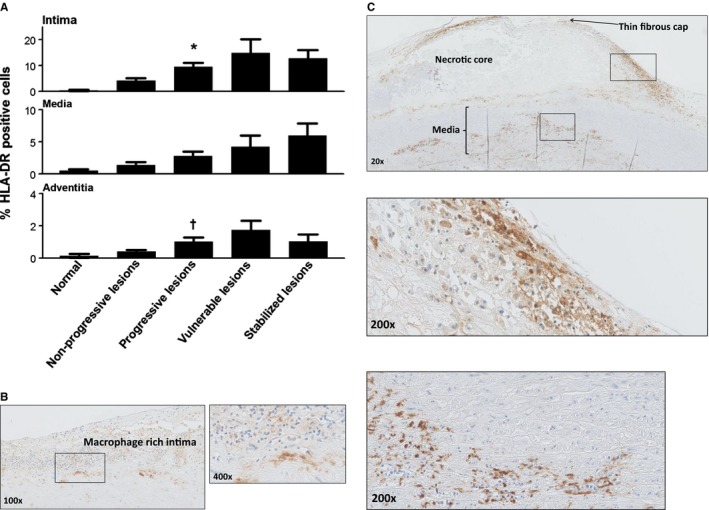
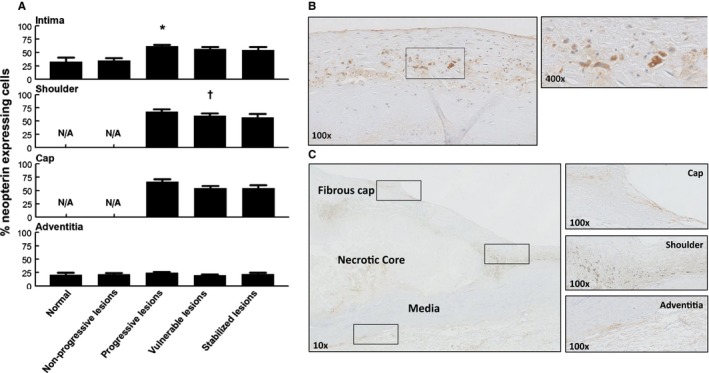
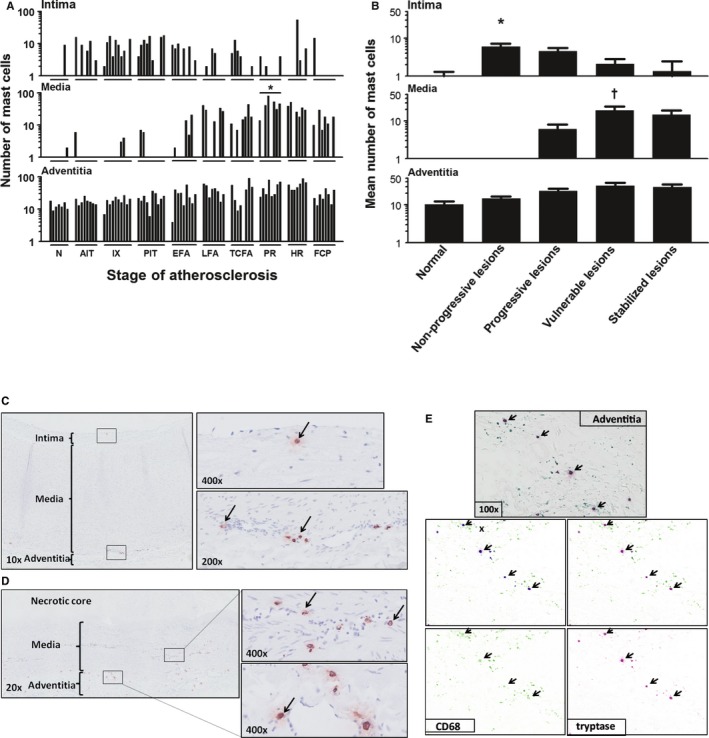
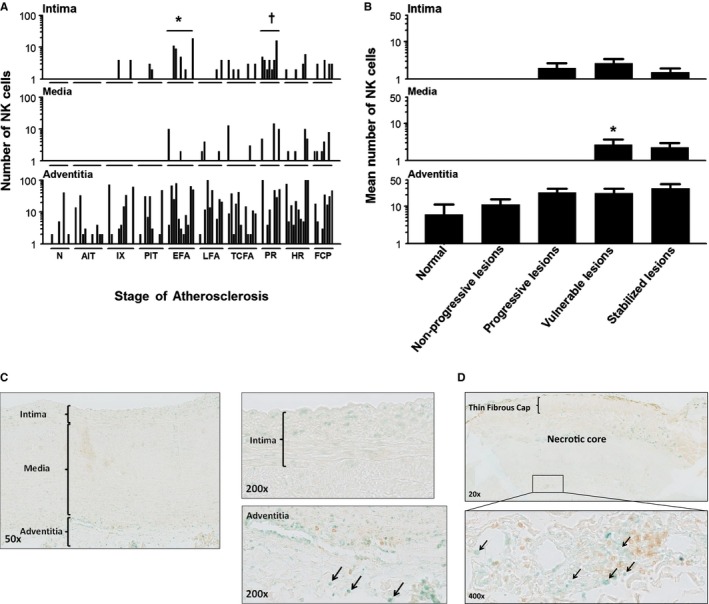
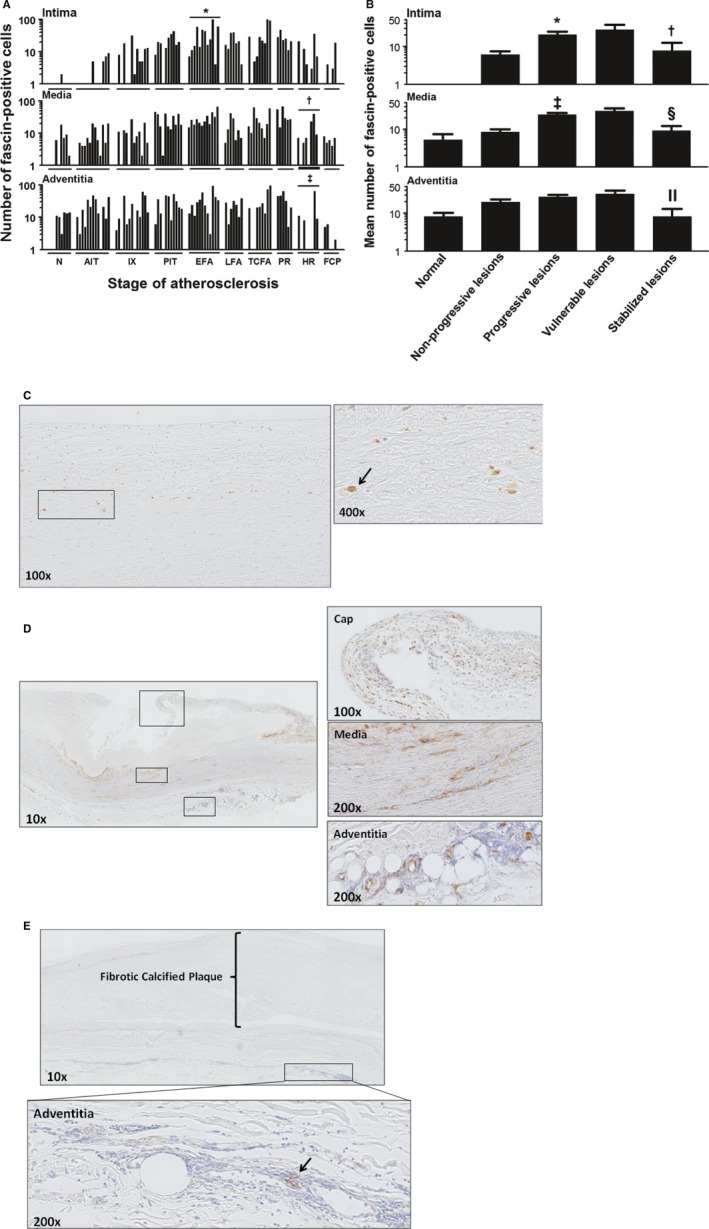
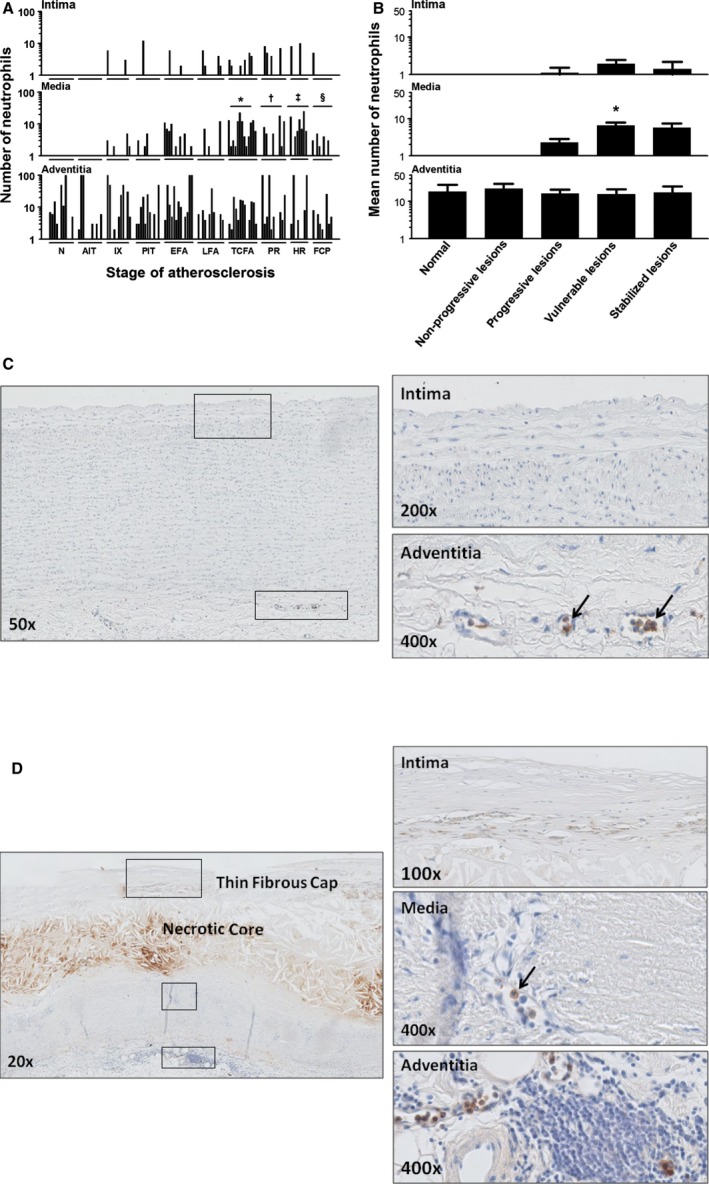
Methods and results: A systematic analysis of innate immune response was performed on 110 well-characterized human perirenal aortic plaques with immunostaining for specific macrophage subtypes (M1 and M2 lineage) and their activation markers, neopterin and human leukocyte antigen-antigen D related (HLA-DR), together with dendritic cells (DCs), natural killer (NK) cells, mast cells, neutrophils, and eosinophils. Normal aortae were devoid of low-density lipoprotein, macrophages, DCs, NK cells, mast cells, eosinophils, and neutrophils. Early, atherosclerotic lesions exhibited heterogeneous populations of (CD68(+)) macrophages, whereby 25% were double positive "M1" (CD68(+)/ inducible nitric oxide synthase [iNOS](+)/CD163(-)), 13% "M2" double positive (CD68(+)/iNOS(-)/CD163(+)), and 17% triple positive for (M1) iNOS (M2)/CD163 and CD68, with the remaining (≈40%) only stained for CD68. Progressive fibroatheromatous lesions, including vulnerable plaques, showed increasing numbers of NK cells and fascin-positive cells mainly localized to the media and adventitia whereas the M1/M2 ratio and level of macrophage activation (HLA-DR and neopterin) remained unchanged. On the contrary, stabilized (fibrotic) plaques showed a marked reduction in macrophages and cell activation with a concomitant decrease in NK cells, DCs, and neutrophils.

Conclusions: Macrophage "M1" and "M2" subsets, together with fascin-positive DCs, are strongly associated with progressive and vulnerable atherosclerotic disease of human aorta. The observations here support a more complex theory of macrophage heterogeneity than the existing paradigm predicated on murine data and further indicate the involvement of (poorly defined) macrophage subtypes or greater dynamic range of macrophage plasticity than previously considered.

Keywords: aorta; atherosclerosis; immune system; inflammation; macrophage.


Figures

Figure 1
Figure 1
Defining the 9 regions of interest (ROIs) within atherosclerotic lesions. Early aortic fibroatheroma stained by Movat pentachrome with ROIs (boxed areas) selected within the fibrous cap, flanking shoulders, and underlying media and the adventitia. Immunostaining for select inflammatory markers within ROIs was quantitatively assessed with an image processing program (ImageJ; plug‐in Cellcounter). An additional high‐resolution image of an adventitial inflammatory infiltrate at ×200 magnification is shown to illustrate the cellular detail. LFA indicates late fibroatheroma.
Figure 2
Figure 2
Apolipoprotein B100 (ApoB100) (low‐density lipoprotein) deposition. A, Representative image (×200) of an aorta with adaptive intimal thickening stained for ApoB100 with a high‐resolution image at a ×400 magnification. ApoB100 accumulation is confined to the intima (black arrow). B, Representative image (×50) of an intimal xanthoma stained for ApoB100 with a high‐resolution image at a ×200 magnification. Increase in intimal ApoB100 deposition within the intima. Accumulation of ApoB100 is restricted to the intima (dotted arrows represent the internal elastic lamina). C, Representative image (×20) of a late fibroatheroma stained for ApoB100 with a high‐resolution image at a ×200 magnification at the intimal‐medial border. This stage of atherosclerosis is characterized by accumulation of ApoB100 within the media, coinciding with loss of integrity of the internal elastic lamina. All ApoB100 samples were visualized with diaminobenzidine (DAB) and counterstained with hematoxylin.
Figure 3
Figure 3
Macrophage (CD68+) distribution in normal, nonprogressive, progressive, vulnerable, and stable atherosclerotic plaques. A, Mean percentage of CD68‐positive area within various regions of interest (intima, media, and adventitia) plotted by lesion morphology (±SEM). An additional plot of the intima illustrates the percentage of CD68 positivity for individual plaque stratified by the stage of atherosclerosis. CD68 is seen from the stage of intimal xanthoma (IX). CD68 positivity increases during disease progression and is maximal for vulnerable plaques, followed by a significant decrease when the lesions stabilize (*P<0.005; compared to vulnerable lesions). CD68 positivity in the media increases with progressive atherosclerotic lesions and vulnerable lesions ( P<0.004; P<0.001; compared to nonprogressive lesions and progressive lesions, respectively) in contrary to the adventitia, which remained relatively constant except for a slight decrease for stabilizing lesions. Spearman's rho correlation coefficient is not significant in the intima, media, and adventitia. B, Representative images of IX, late fibroatheroma (LFA), and a thin‐cap fibroatheroma (TCFA) stained by Movat pentachrome with corresponding immunostain for macrophages (CD68; KP‐1). Macrophages and macrophage foam cells essentially form the IX. The necrotic core in LFA stains highly positive for CD68, representing accumulation of macrophage remnants and therefore was excluded during morphometric analysis. Whereas the thick fibrous cap of the LFA is mainly negative for CD68, the shoulder regions show infiltration by macrophages and macrophage foam cells (see the ×50 magnification) in addition to a notable presence within the media (see the ×100 magnification). More‐advanced TCFAs demonstrate increased macrophage accumulation in the cap. Total number of cases in (A): 85—normal 9, nonprogressive lesions 18 (viz AIT [10] and IX [8]), progressive lesions 29 (viz PIT [12], EFA [9] and LFA [8]), vulnerable lesions 16 (viz TCFA [8] and PR [8]), and stabilized lesions 13 (viz HR [7] and FCP [6]). AIT indicates adaptive intimal thickening; EFA, early fibroatheroma; FCP, fibrotic calcified plaque; HR, healed rupture; N, normal; PIT, pathological intimal thickening; PR, plaque rupture. For a detailed description concerning the classification, see the Material and Methods section.
Figure 4
Figure 4
Macrophage subclass distribution (intima) during aortic atherosclerosis. A, Lesional macrophages were identified by the pan macrophage marker, CD68, and respective subclasses identified based on the expression of inducible nitric oxide synthase (iNOS; M1) and CD163 (M2). Various macrophage subtypes are plotted as a relative percentage of the total amount of CD68 cells for each atherosclerotic stage. As lesions progress toward a vulnerable phase (ie, TCFA and PR), there is a slight decreases in the extent of M1 macrophages whereas the M2 lineage increases, resulting in a 1:1 ratio. Within healed and stabilized FCP, the M1:M2 ratio is ≈2:1. Around 20% to 30% of the macrophages stain positive for both iNOS and CD163 and over 40% of the macrophages are double negative for the selective markers. B, Confirmation of M1 (iNOS) and M2 (CD163) expressing macrophages within various progressive, vulnerable lesions, and stable aortic lesions substituting IL6 and Dectin‐1 as respective “M1” and “M2” markers. Nearly the same percentages and distribution of M1 and M2 macrophages were observed when compared with lesions triple stained for iNOS and CD163, where ≈20% to 30% of the macrophages express both IL6 and dectin‐1 and nearly 40% of the macrophages are double negative for both markers. C, Representative images of a shoulder region at a ×100 magnification triple stained with CD68 (pan macrophage marker, Warp Red chromogen; spectral image color red), iNOS (inducible nitric oxide synthase; M1 macrophages, diaminobenzidine (DAB); spectral image color green) and CD163 (macrophage scavenger receptor; M2 macrophages, Ferangi Blue; spectral image color blue). Yellow indicates the amount of colocalization between the various macrophage markers. D, Representative images of a shoulder region at a ×100 magnification triple stained with CD68 (pan macrophage marker, Vina Green chromogen; spectral image color red), CD197 (M1 macrophages, Vulcan Red; spectral image color green) and CD206 (M2 macrophages, Ferangi Blue; spectral image color blue). Yellow indicates the amount of colocalization between the various macrophage markers. EFA indicates early fibroatheroma; FCP, fibrotic calcified plaque; HR, healed rupture; IX, intimal xanthoma; LFA, late fibroatheroma; N/A, not applicable; PIT, pathological intimal thickening; PR, plaque rupture; TCFA, thin‐cap fibroatheroma.
Figure 5
Figure 5
Human leukocyte antigen–antigen D related (HLADR) expression during aortic atherosclerosis. A, Mean percentage of HLADR expression (intima, media, and adventitia) based on lesion morphology. HLADR expression increases within all the vascular layers (significant within the intima and the adventitia with progressive atherosclerosis; *P<0.002; P<0.01; compared to nonprogressive lesions) and tend to decrease in the stabilized phase. B, Representative image of an intimal xanthoma stained for HLADR at ×100 magnification with a high‐resolution image at a ×400 magnification. HLADR staining is clearly seen in macrophage rich areas located in the intima. C, Representative image of a thin‐cap fibroatheroma stained for HLADR at ×20 magnification with more detail (×200 magnification) of the macrophage foam cell‐rich shoulder region and media. Expression of HLADR is more extensive in advanced and vulnerable stages of atherosclerosis. Total number of cases in (A): 89 (normal 8, nonprogressive lesions 24, progressive lesions 34, vulnerable lesions 14, and stabilized lesions 9). Large solid bars in (A): represent the mean percentage of HLADR within the aortic wall section per atherosclerotic phase±SEM. All sections were developed with diaminobenzidine (DAB) and counterstained with Mayer's hematoxylin.
Figure 6
Figure 6
Neopterin expression during aortic atherosclerosis. A, Mean percentage of neopterin (intima, media, and adventitia) based on lesion morphology. Neopterin expression is minimal in early atherosclerosis, but increases during progressive disease (*P<0.0007; compared to nonprogressive lesions); afterward, remains relatively unchanged for stable healed plaque ruptures and fibrocalcific plaques. There is a small, but significant, decrease in neopterin expression within the shoulder regions of vulnerable plaques ( P<0.043; compared to progressive lesions). Adventitial neopterin staining is relatively minimal and stable throughout all lesion morphologies. Spearman's rho correlation coefficient is not significant in the intima, shoulder, cap, and adventitia. B, Representative image of an intimal xanthoma stained for neopterin with a high‐resolution image at a ×400 magnification. Neopterin expression is seen in areas containing macrophage foam cells. C, Representative image of a healed rupture stained for neopterin with high‐resolution details of the cap, shoulder, and adventitia at a ×100 magnification. Neopterin expression is present within the various areas of the atherosclerotic lesion. Total number of cases in (A): 102 (normal 7, nonprogressive lesions 23, progressive lesions 35, vulnerable lesions 22, and stabilized lesions 15). Large solid bars in (A) represent the mean percentage of neopterin expression within the aortic wall section per atherosclerotic phase±SEM. All sections were developed with diaminobenzidine (DAB) and counterstained with Mayer's hematoxylin. N/A indicates not applicable.
Figure 7
Figure 7
Mast cell (tryptase+) distribution during aortic atherosclerosis. A, Mast cells are constitutively present in the intima and adventitia in the aortic wall. The media practically remains devoid of mast cells until the progressive lesions. Significantly more mast cells are seen in the media of ruptured plaques (*P<0.01; compared to TCFA). B, The highest number of mast cells within the intima is present in the nonprogressive phase (P<0.01) while showing a gradual decrease with lesion progression achieving a minimum for stable fibrocalcific plaques. The media remains almost devoid of mast cells in the normal aorta's and in the nonprogressive lesions, but significantly increases in vulnerable plaques ( P<0.0001; compared to progressive lesions) in contrast to adventitial mast cells, which remain relatively stable throughout the atherosclerotic process. C, Representative image of a normal aorta stained for tryptase with high‐resolution images of the intima (×400 magnification) and adventitia (×200 magnification), as indicated by black arrows. Note that adventitial mast cells are scattered and mainly located near vasa vasorum. D, Representative image of a late fibroatheroma with a large necrotic core stained for Tryptase at ×20 magnification with high‐resolution images of media and adventitia at a ×400 magnification. Mast cells are relatively more and remain in close proximity to the vasa vasorum. E, Representative image of the adventitia of an intimal xanthoma double stained for CD68 (Vina Green) and tryptase (Warp Red). CD68‐positive mast cells are identified (arrows), and using the Nuance multispectral imaging system FX, the colocalization can be separately analyzed. Total number of cases in (A and B): 83—normal 7, nonprogressive lesions 18 (viz AIT [8] and IX [10]), progressive lesions 27 (viz PIT [10], EFA [9], and LFA [8]), vulnerable lesions 16 (viz TCFA [8] and PR [8]), and stabilized lesions 15 (viz HR [7] and FCP [8]). In (A), the vertical axis of the intima, media, and adventitia is presented as a log scale. Each solid bar in (A) represents the number of positively stained mast cells within the intima, media, and adventitia of 1 aortic plaque. Large solid bars in (B) represent the mean total number of mast cells within the entire aortic wall per atherosclerotic phase±SEM. For abbreviations and a detailed description concerning the classification, see the Material and Methods section. All sections were developed with diaminobenzidine (DAB) and counterstained with Mayer's hematoxylin. AIT indicates adaptive intimal thickening; EFA, early fibroatheroma; FCP, fibrotic calcified plaque; HR, healed rupture; IX, intimal xanthoma; LFA, late fibroatheroma; N, normal; PIT, pathological intimal thickening; PR, plaque rupture; TCFA, thin cap fibroatheroma.
Figure 8
Figure 8
Natural killer (NK) cell (T‐bet+/CD4) distribution during aortic atherosclerosis. A, Significantly more NK cells are seen in the intima in EFA (*P<0.01; compared to PIT) and in ruptured plaques ( P<0.011; compared to TCFA). The media practically remains devoid of NK cells in progressive atherosclerosis. NK cells are constitutively and similarly present in the adventitia throughout the disease process. B, NK cells are minimally present in the aortic intima and media. NK cells are largely confined to the adventitia and the medial‐adventitial border zone, and the number of NK cells increases during the atherosclerotic process. A small, but significant, increase in NK cells in the media is seen in the vulnerable phase (viz TCFA and PR). (*P<0.001; compared to progressive lesions). Spearman's rho correlation coefficient is not significant in the intima, media, and adventitia. C, Illustrative images of a nonprogressive lesion (AIT) showing T‐Bet+/CD4 cells (methylgreen; black arrows). Note T‐helper cells (CD4+ single positive) cells in the adventitia (brown; diaminobenzidine chromogen) and the T‐helper 1 cells (CD4 and T‐bet double‐positive cells). D, Representative low‐power image of a TCFA dual immunostained for CD4/T‐bet with a high‐resolution image of the adventitia at ×20 magnification. Note the predominant adventitial location of NK cells (Vinagreen; black arrows). The lesion is a consecutive slide from the Movat and CD68 shown in Figure 3B. Total number of cases in (A and B): 100—normal 8, nonprogressive lesions 23 (viz AIT [12] and IX [11]), progressive lesions 31 (viz PIT [10], EFA [11] and LFA [10]), vulnerable lesions 20 (viz TCFA [12] and PR [8]), and stabilized lesions 18 (viz HR [10] and FCP [8]). Each solid bar in (A) represents the number of positively stained NK cells within the intima, media, and adventitia of a single lesion whereas the large solid bars in (B) represent the mean total number of NK cells within the aortic wall section per atherosclerotic phase±SEM. For abbreviations and a detailed description concerning the classification, see the Material and Methods section. All sections were developed with Vina green and diaminobenzidine (DAB) and counterstained with Mayer's hematoxylin. AIT indicates adaptive intimal thickening; EFA, early fibroatheroma; FCP, fibrotic calcified plaque; HR, healed rupture; IX, intimal xanthoma; LFA, late fibroatheroma; N, normal; PIT, pathological intimal thickening; PR, plaque rupture; TCFA, thin cap fibroatheroma.
Figure 9
Figure 9
Dendritic cell (DC; fascin+) distribution during aortic atherosclerosis. A, DCs are mainly localized to the adventitia near the medial border and gradually increase in number with lesion progression. DCs are minimally present in the normal intima and intima of nonprogressive lesions and significantly more DCs are seen in EFA (*P<0.046; compared to PIT). On the contrary, significantly less DCs are seen in stabilizing lesions ( P<0.001 and P<0.029; compared to PR). B, The amount of DCs in the intima and media increases significantly in the progressive phase (*P<0.0004; P<0.0001; compared to nonprogressive lesions). In postruptured stabilized atherosclerotic lesions, the number of fascin‐positive cells decrease in all the vascular layers ( P<0.015, § P<0.0004, and P<0.002; compared to vulnerable lesions). C, Representative image (×100) of a nonprogressive lesion (IX) stained for fascin. Only a few DCs are identified in the deeper intima. D, Representative image (×20) of TCFA stained for fascin. This example of a TCFA is from a consecutive slide as the example seen in Figure 6C. Note the abundance of fascin‐positive cells in the intima, media, and adventitia. E, Illustrative image (×10) of a FCP stained for fascin with a high‐resolution image of the adventitia (×200) showing a relative decrease in fascin‐positive cells in all vascular layers. Total number of cases in (A and B): 92—normal 8, nonprogressive lesions 26 (viz AIT [13] and IX [13]), progressive lesions 30 (viz PIT [11], EFA [12] and LFA [7]), vulnerable lesions 15 (viz TCFA [9] and PR [6]), and stabilized lesions 13 (viz HR [8] and FCP [5]). The vertical axis of the intima, media, and adventitia in (A and B) is presented as a log‐scale. Each solid bar in (A) represents the number of fascin‐positive cells within the intima, media, and adventitia of 1 aortic plaque. The large solid bars in (B) represent the mean total number of fascin‐positive cells within the aortic wall section per atherosclerotic phase±SEM. For abbreviations and a detailed description concerning the classification, see the Material and Methods section. All sections were developed with diaminobenzidine (DAB) and counterstained with Mayer's hematoxylin. AIT indicates adaptive intimal thickening; EFA, early fibroatheroma; FCP, fibrotic calcified plaque; HR, healed rupture; IX, intimal xanthoma; LFA, late fibroatheroma; N, normal; PIT, pathological intimal thickening; PR, plaque rupture; TCFA, thin cap fibroatheroma.
Figure 10
Figure 10
Neutrophil (myeloperoxidase+) distribution during aortic atherosclerosis. A, Minimal presence of intimal neutrophils during the atherosclerotic process. There are significantly more medial located neutrophils in TCFA and PR (*P<0.0002; P<0.033; compared to LFA and TCFA, respectively) and healing ruptures ( P<0.007; compared to PR) and significantly less in FCP (§ P<0.0002; compared to HR). B, Overall, the mean amount of neutrophils within the media significantly increase in vulnerable lesions (*P<0.0005; compared to progressive lesions). Spearman's rho correlation coefficient is not significant in the intima and adventitia. C, Illustrative image (×50) of a normal aorta stained for myeloperoxidase (MPO) with high‐resolution images of the intima (×200) and the adventitia (×400). Identified neutrophils are all intravascular located in the vaso vasorum (black arrows). D, Representative image of a TCFA stained for MPO with a high‐resolution image of the intima, media, and adventitia. This example of a TCFA is again a consecutive section of the Movat and CD68 provided in Figures 3B and 8D. Neutrophils in the media and adventitia are located within the infiltrating vaso vasorum (black arrows). Total number of cases in (A and B): 108—normal 11, nonprogressive lesions 22 (viz AIT [11] and IX [11]), progressive lesions 35 (viz PIT [11], EFA [13] and LFA [11]), vulnerable lesions 24 (viz TCFA [13] and PR [11]), and stabilized lesions 16 (viz HR [7] and FCP [9]). The vertical axis of the intima, media, and adventitia in (A and B) is presented as a log scale. Each solid bar in (A) represents the number of neutrophils within the intima, media, and adventitia of one aortic plaque. Large solid bars in (B) represent the mean total number of neutrophils within the aortic wall section per atherosclerotic phase±SEM. For abbreviations and a detailed description concerning the classification, see the Material and Methods section. All sections were developed with diaminobenzidine (DAB) and counterstained with Mayer's hematoxylin. AIT indicates adaptive intimal thickening; EFA, early fibroatheroma; FCP, fibrotic calcified plaque; HR, healed rupture; IX, intimal xanthoma; LFA, late fibroatheroma; N, normal; PIT, pathological intimal thickening; PR, plaque rupture; TCFA, thin cap fibroatheroma.

References

    1. Fernández‐Velasco M, González‐Ramos S, Boscá L. Involvement of monocytes/macrophages as key factors in the development and progression of cardiovascular diseases. Biochem J. 2014;458:187–193. - PubMed
    1. Douaiher J, Succar J, Lancerotto L, Gurish MF, Orgill DP, Hamilton MJ, Krilis SA, Stevens RL. Development of mast cells and importance of their tryptase and chymase serine proteases in inflammation and wound healing. Adv Immunol. 2014;122:211–252. - PMC - PubMed
    1. Ma Y, Yabluchanskiy A, Lindsey ML. Neutrophil roles in left ventricular remodeling following myocardial infarction. Fibrogenesis Tissue Repair. 2013;6:11. - PMC - PubMed
    1. Hansson GK, Libby P, Schönbeck U, Yan ZQ. Innate and adaptive immunity in the pathogenesis of atherosclerosis. Circ Res. 2002;91:281–291. - PubMed
    1. Peled M, Fisher EA. Dynamic aspects of macrophage polarization during atherosclerosis progression and regression. Front Immunol. 2014;5:579. - PMC - PubMed

Publication types

Substances