. 2016 Jun 17:7:11915.
doi: 10.1038/ncomms11915.

Early synaptic deficits in the APP/PS1 mouse model of Alzheimer's disease involve neuronal adenosine A2A receptors

Affiliations

Early synaptic deficits in the APP/PS1 mouse model of Alzheimer's disease involve neuronal adenosine A2A receptors

Silvia Viana da Silva et al. Nat Commun. .

Abstract

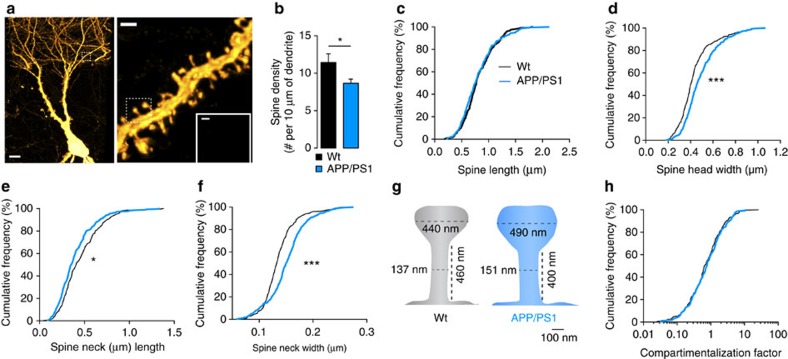
Synaptic plasticity in the autoassociative network of recurrent connections among hippocampal CA3 pyramidal cells is thought to enable the storage of episodic memory. Impaired episodic memory is an early manifestation of cognitive deficits in Alzheimer's disease (AD). In the APP/PS1 mouse model of AD amyloidosis, we show that associative long-term synaptic potentiation (LTP) is abolished in CA3 pyramidal cells at an early stage. This is caused by activation of upregulated neuronal adenosine A2A receptors (A2AR) rather than by dysregulation of NMDAR signalling or altered dendritic spine morphology. Neutralization of A2AR by acute pharmacological inhibition, or downregulation driven by shRNA interference in a single postsynaptic neuron restore associative CA3 LTP. Accordingly, treatment with A2AR antagonists reverts one-trial memory deficits. These results provide mechanistic support to encourage testing the therapeutic efficacy of A2AR antagonists in early AD patients.


Conflict of interest statement

The authors declare no competing financial interests.

Figures

Figure 1
Figure 1. Early synaptic alterations in 6-month-old APP/PS1 CA3 PCs.
(a) Scheme illustrating the hippocampus with a recording electrode on a CA3 PC (R) and a stimulating electrode (S) in the stratum radiatum. Depo-pairing protocol used to trigger NMDAR-dependent LTP: depolarization of postsynaptic cell to 0 mV paired with 100 stimuli at 2 Hz frequency. (b) Example traces of paired-pulse responses (40 ms interval, average of 5 sweeps) in cells from both genotypes. (c) Bar graph summarizing PPR values in wt (n=21) and APP/PS1 mice (n=25; P=0.054, unpaired t-test). (d) Sample traces representing average A/C-EPSCs 10 min before and 30 min after depo-pairing protocol. (e) Summary time course of normalized A/C-EPSCs in the experiments illustrated in d. (f) The robust LTP of A/C synapses found in 6-month-old wt mice (n=12) is abolished in APP/PS1 mice (n=11, ***P<0.0001, unpaired t-test; Supplementary Table 1). Recordings were performed in the presence of 10 μM bicuculline and 3 μM CGP55845.
Figure 2
Figure 2. Alterations in A/C spine morphology.
(a) Representative STED images obtained from RABVΔG-GFP(RG) infected neurons. Scale bar, left panel, 10 μm; right panel, 1 μm; inset, 250 nm. (b) Bar graph summarizing the reduction of spine density. Several branches of distal dendrites of CA3 PCs were analysed in wt (n=8 branches, 4 mice) and in APP/PS1 mice (n=9 branches, 4 mice; *P=0.037, unpaired t-test). (c) Cumulative distribution illustrating the absence of any difference in spine lengths between both genotypes (Kolmogorov–Smirnov (KS) test P=0.144). Number of spines analysed was equal for graphs from c to h, n=300 for wt and n=288 for APP/PS1, from four mice for each genotype. (d) Cumulative distribution of spine head width (KS-test ***P<0.0001), (e) spine neck length (KS-test *P=0.015) and (f) spine neck width (KS-test ***P<0.0001) from wt and APP/PS1 mice. (g) Schematic spines illustration of morphological alterations observed in A/C spines with mean values indicated. (h) The cumulative distribution of the compartmentalization factor calculated for each spine was not different between wt (1.35±0.13) and APP/PS1 mice (1.35±0.10, P=0.063, KS-test).
Figure 3
Figure 3. Loss of A/C LTP is not associated with dysregulation of NMDAR.
(a) A/C EPSCs were recorded at negative and positive potentials, and NMDAR-EPSCs were pharmacologically isolated with 20 μM NBQX (darker traces at +40 mV). Traces represent the average of 40 sweeps recorded at 0.1 Hz. (b) Mean values of NMDAR/AMPAR ratios obtained with isolated currents at −70 mV (AMPAR) and +40 mV (NMDAR) from wt (n=18) and APP/PS1 mice (n=16; P=0.894, unpaired t-test). (c) Summary plot of the time course of A/C NMDAR-EPSCs amplitude during the application of Ro25-698 in wt (n=13) and APP/PS1 cells (n=16, P=0.155, unpaired t-test). Amplitude of A/C NMDAR-mediated EPSCs was normalized to the mean amplitude of an 8 min baseline period and quantification was performed after 30 min of drug application. (d) Average traces of pharmacologically isolated (20 μM NBQX) A/C NMDAR-EPSCs obtained at a stimulation frequency of 0.1 Hz during baseline and after 30 min of Ro25-698 (1 μM) application (lighter traces). (e) Representative examples of the shift in holding current observed in CA3 PCs clamped at +40 mV in response to D-AP5 revealing the tonic activation of extrasynaptic NMDAR at rest. AMPAR and KAR were blocked with 20 μM NBQX. (f) Summarizing bar graph representing the shift of inward current in wt (n=14) and APP/PS1 cells (n=14, P=0.573, unpaired t-test). Data calculated as the difference between the last min of baseline and the last min after a 6-min D-AP5 application. Recordings were performed in the presence of 10 μM bicuculline and 3 μM CGP55845.
Figure 4
Figure 4. Blockade of neuronal A2AR restores synaptic plasticity in CA3 PCs.
(a) The density of A2AR is increased in synaptic membranes prepared from the CA3 region of APP/PS1 mice compared with wt littermates (n=6, **P=0.002, Mann–Whitney test). (b) Example traces representing a 10 min average of A/C-EPSCs before and 30 min after depo-pairing LTP protocol in the presence of SCH58261 (50 nM) or ZM241385 (50 nM). (c) Summary time course of normalized A/C-EPSCs recorded from APP/PS1 mice during LTP protocol performed in the presence of the two different A2AR antagonists or in control conditions. (d) Bar graph representing mean LTP amplitude recorded at 30–40 min after depo-pairing protocol represented in c. A 10-min incubation period with two different classes of A2AR antagonists, SCH58261 (n=11) and ZM241385 (n=12, P=0.006 Kruskal–Wallis test with Dunn's multiple comparison test), rescued the LTP of A/C synapses in APP/PS1 mice (n=11 for vehicle, Supplementary Table 1). Electrophysiology recordings were performed in the presence of 10 μM bicuculline and 3 μM CGP55845.
Figure 5
Figure 5. A2AR and mGluR5 are involved in the loss of A/C LTP in APP/PS1 mice.
(a) Example traces representing the average of A/C-EPSCs 10 min before and 30 min after depo-pairing LTP protocol. Recordings were performed in the presence of 10 μM bicuculline and 3 μM CGP55845. (b) Summary time course of normalized A/C-EPSCs recorded from APP/PS1 mice during LTP protocol performed in the presence of MTEP (10 μM) and MTEP+SCH58261 (50 nM). (c) Bar graph representing mean LTP amplitude recorded at 30–40 min after depo-pairing protocol represented in b. A 10-min incubation with MTEP (n=12) or MTEP+SCH58261 (n=11, P=0.008 Kruskal–Wallis test with Dunn's multiple comparison test) rescued the LTP of A/C synapses in APP/PS1 mice (n=11 for vehicle group, Supplementary Table 1).
Figure 6
Figure 6. Treatment with A2AR blockers restores one-trial memory impairment in APP/PS1 mice.
(a) Average occupation plot representing the pattern of exploration of the mice in the object displacement test. Mice were treated with SCH58261 or saline for 6 days (b) Bar graph representing the percentage of time spent by mice exploring the displaced object. The displacement index is higher in wtsaline (n=12) when compared with APP/PS1saline (n=9, *P=0.034, two-way ANOVA, genotype effect; Sidak's multiple comparisons test wtsaline versus APP/PS1saline, *P=0.0374). By contrast, whereas SCH58261 is devoid of effects in wt (n=11, Sidak's multiple comparisons test wtsaline Saline versus wtSCH58361, P=0.594), it reverted the lower percentage of time that APP/PS1 mice interacted with the novel object (n=10, Sidak's multiple comparisons test APP/PS1saline versus APP/PS1SCH58361, P=0.6047). (c) No alterations were found in the average distance travelled by mice (wtSaline: 12.2±1.6 m, n=12, APP/PS1Saline: 14.5±1.9 m, n=9, P=0.405; wtSCH58261: 11.0±0.9 m, n=11, APP/PS1SCH58261: 11.0±0.9 m, n=10, P=0.096, two-way ANOVA). (d) Average occupation plot of exploration in the Y-maze task. (e) Bar graph representing the percentage of time spent in the novel arm by wt and APP/PS1 mice treated with SCH58261 or saline for 7 days. When comparing APP/PS1 (n=9) and wt (n=12) mice in the saline groups, we observed a difference in the percentage of time spent in the novel arm (*P=0.024, two-way ANOVA, genotype effect; Sidak's multiple comparisons test wtsaline versus wtSCH58361, *P=0.0347). SCH58261 treatment had no effect in wt groups (n=11, Sidak's multiple comparisons test wtsaline versus wtSCH58361, P=0.901), but reverted the memory deficit in APP/PS1 mice (n=10, Sidak's multiple comparisons test APP/PS1saline versus APP/PS1SCH58361, P=0.410) (f) Distance travelled in the test phase of the modified Y-maze (wtSaline: 77.9±6.7 m, n=12, APP/PS1Saline: 104.2±8.6 m, n=9; wtSCH58261: 71.5±6.7 m, n=11, APP/PS1SCH58261: 70.8±4.8 m, n=10, **P=0.006, two-way ANOVA with Sidak's multiple comparisons test). Horizontal dashed lines in b and e represent the random displacement values for better visualization.
Figure 7
Figure 7. Genetic silencing of neuronal A2AR restores A/C LTP.
(a) Example pictures of CA3 PCs infected with shRNA lentivirus. Infected cells (shRNA+) and non-infected cells (shRNA) in the proximity of infected cells were patched for the experiments in b. Scale bar represents 10 μm. (b) Example traces representing average A/C-EPSCs 10 min before and 30 min after LTP protocol in infected and non-infected cells. (c) Summary time course of normalized A/C-EPSCs during depo-pairing LTP protocol, recorded from APP/PS1 mice injected with A2AR shRNA; in shRNA+ cells there was a rescue of the A/C LTP (n=7) that was absent in shRNA cells (n=7, **P=0.001, Mann–Whitney test, Supplementary Table 1). (d) Example traces representing the average of A/C-EPSCs 10 min before and 30 min after depo-pairing LTP protocol in infected cells with A2AR shRNA or srcRNA lentivirus. (e) Summary time course of normalized A/C-EPSCs recorded from APP/PS1 mice during LTP protocol performed in scrRNA+ cells (n=9) in the absence and scrRNA+ (n=7) or shRNA+ cells (n=9) in the presence of SCH58261 (50 nM). (f) Bar graph representing mean LTP amplitude recorded at 30–40 min after depo-pairing protocol represented in e. APP/PS1 cells infected with scrRNA virus (scrRNA+) do not sustain LTP (Supplementary Table 1). A 10-min incubation period with SCH58261 increased LTP amplitude of scrRNA+ cells to levels similar to the genetic silencing of A2AR (Supplementary Table 1). In shRNA+ cells, SCH58261 did not further increase the LTP levels (**P=0.0014, Kruskal–Wallis test with Dunn's multiple comparison test between groups). All electrophysiology recordings were performed in the presence of 10 μM bicuculline and 3 μM CGP55845.

Similar articles

Cited by

References

    1. Sperling R. Functional MRI studies of associative encoding in normal aging, mild cognitive impairment, and Alzheimer's disease. Ann. N. Y. Acad. Sci. 1097, 146–155 (2007). - PubMed
    1. Selkoe D. J. Alzheimer's disease is a synaptic failure. Science 298, 789–791 (2002). - PubMed
    1. Kesner R. P. A process analysis of the CA3 subregion of the hippocampus. Front. Cell. Neurosci. 7, 78 (2013). - PMC - PubMed
    1. Nakazawa K. et al. Hippocampal CA3 NMDA receptors are crucial for memory acquisition of one-time experience. Neuron 38, 305–315 (2003). - PubMed
    1. Rolls E. T. & Treves A. The neuronal encoding of information in the brain. Prog. Neurobiol. 95, 448–490 (2011). - PubMed

Publication types

MeSH terms