. 2017 Feb;197(2):191-198.
doi: 10.1016/j.jsb.2016.06.007. Epub 2016 Jun 14.

Implementation of a cryo-electron tomography tilt-scheme optimized for high resolution subtomogram averaging

Affiliations

Implementation of a cryo-electron tomography tilt-scheme optimized for high resolution subtomogram averaging

Wim J H Hagen et al. J Struct Biol. 2017 Feb.

Abstract

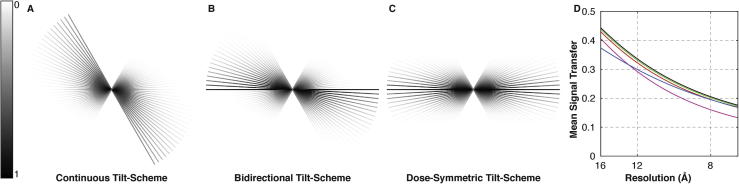
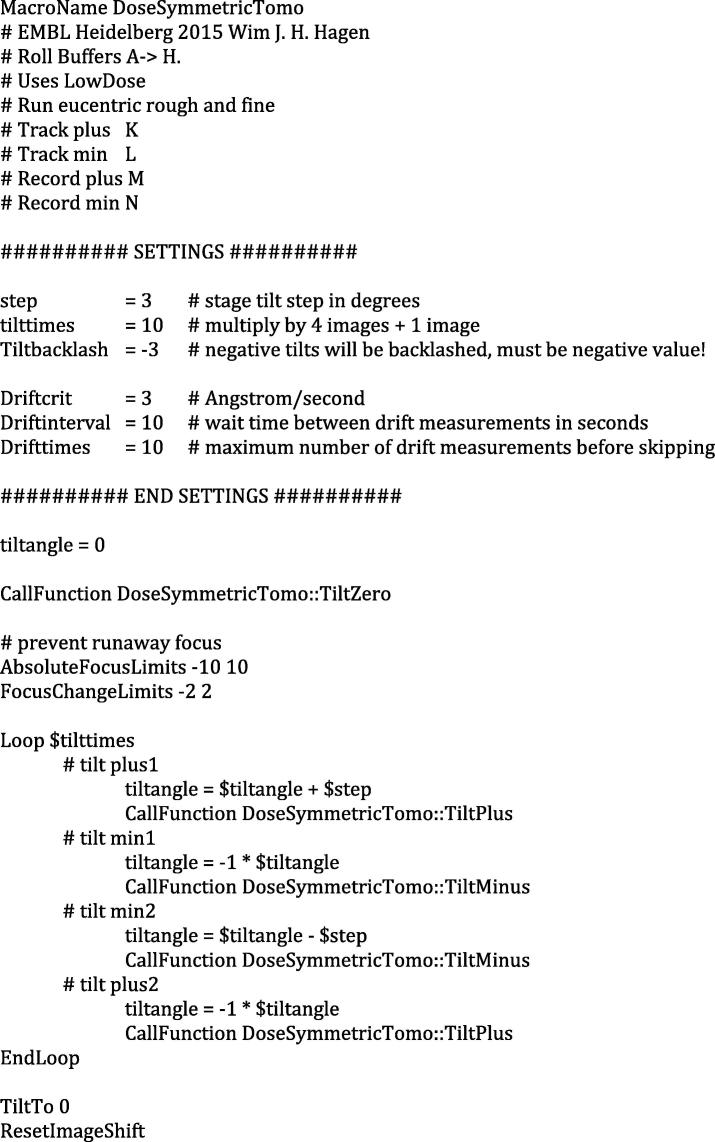
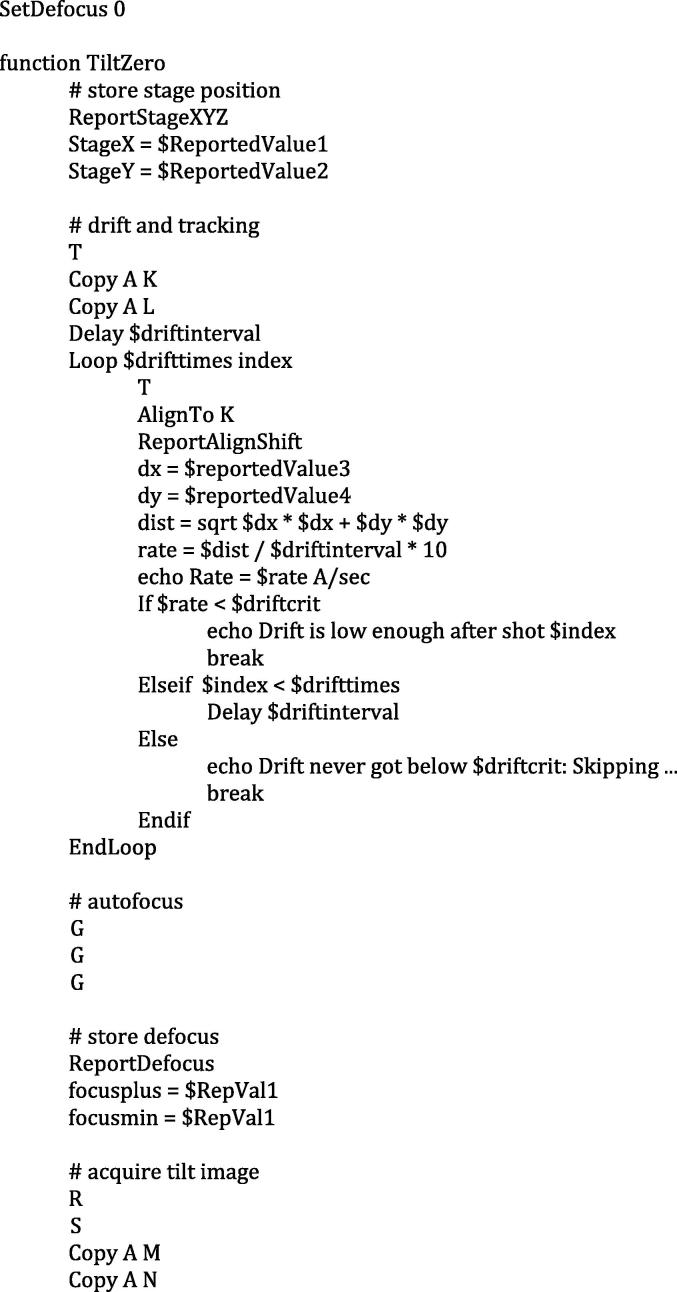
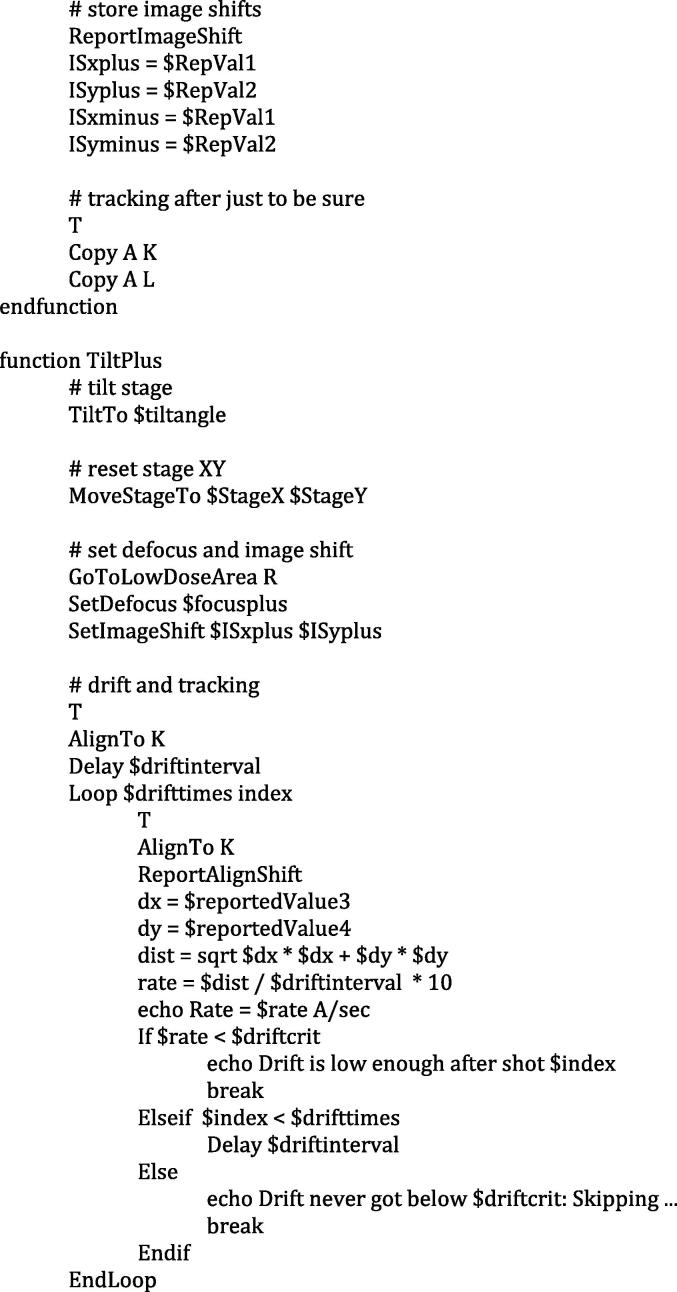
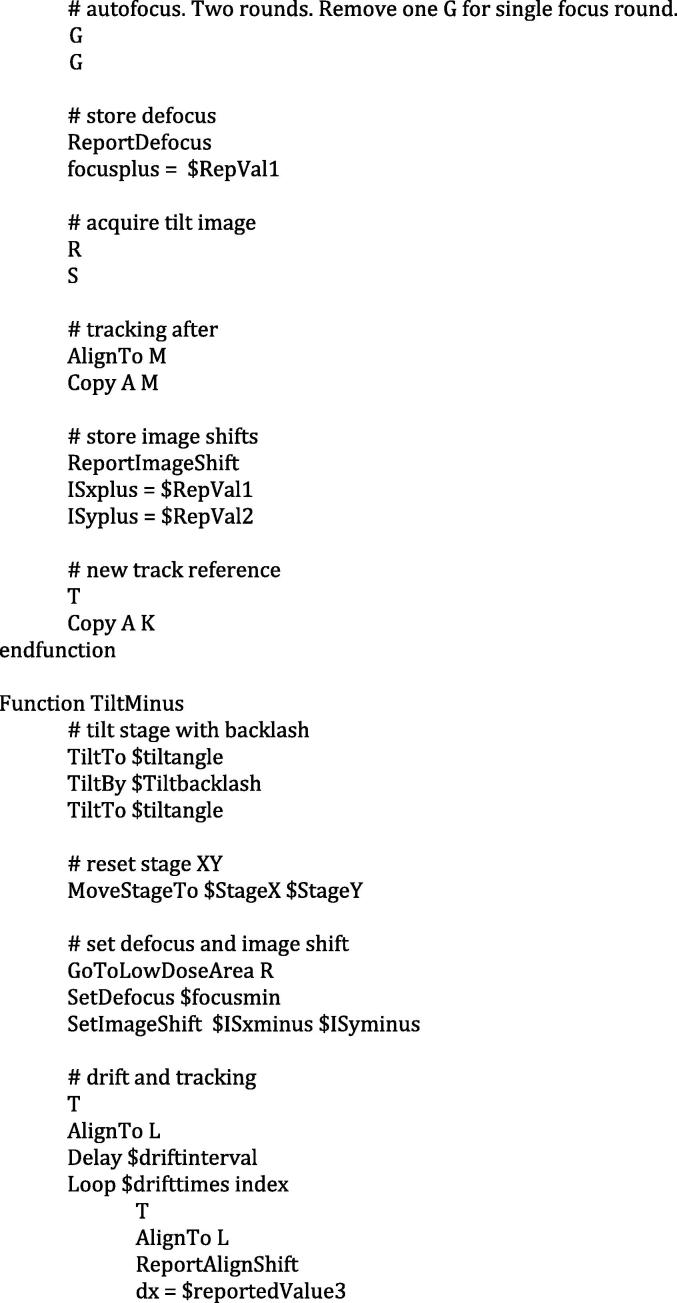
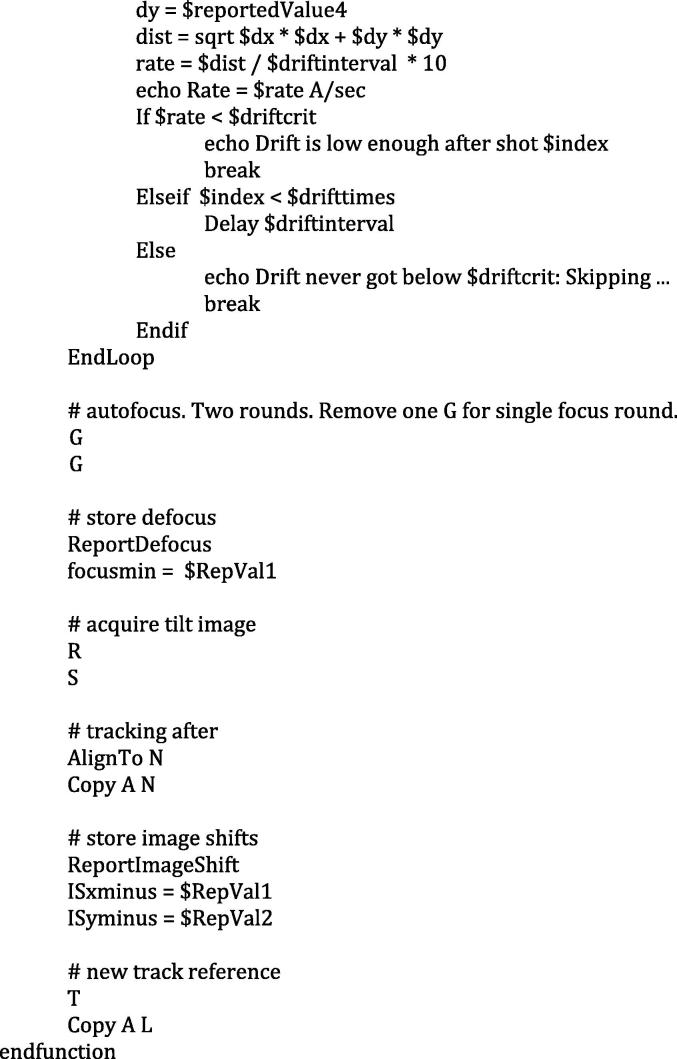
Cryo-electron tomography (cryoET) allows 3D structural information to be obtained from cells and other biological samples in their close-to-native state. In combination with subtomogram averaging, detailed structures of repeating features can be resolved. CryoET data is collected as a series of images of the sample from different tilt angles; this is performed by physically rotating the sample in the microscope between each image. The angles at which the images are collected, and the order in which they are collected, together are called the tilt-scheme. Here we describe a "dose-symmetric tilt-scheme" that begins at low tilt and then alternates between increasingly positive and negative tilts. This tilt-scheme maximizes the amount of high-resolution information maintained in the tomogram for subsequent subtomogram averaging, and may also be advantageous for other applications. We describe implementation of the tilt-scheme in combination with further data-collection refinements including setting thresholds on acceptable drift and improving focus accuracy. Requirements for microscope set-up are introduced, and a macro is provided which automates the application of the tilt-scheme within SerialEM.

Keywords: Cryo-electron microscopy; Electron tomography; Subtomogram averaging; Tilt-scheme.


Figures

Fig. 1
Fig. 1
Schematic showing information transfer for (A) continuous, (B) bidirectional and (C) dose-symmetric tilt-schemes. Tilts are shown from −60° to +60° in 3° increments for a total of 41 tilts. Grey values correspond to the information transfer at each tilt according to the color map shown on the left. The reduction of information transfer at high-tilts due to the increased apparent thickness of the sample is simulated by multiplication with the cosine of the tilt angle. The loss of high-resolution information due to accumulated electron dose is simulated by multiplication by low pass filters according to the measurements described in (Grant and Grigorieff, 2015) assuming constant exposure times. The dose-symmetric tilt-scheme shows optimized, near-symmetric information transfer. (D) Plot of mean signal transfer for different tilt-schemes: continuous (magenta); bidirectional starting at 0° (red); bidirectional starting at −21° (green); bidirectional starting at −21° in the case that the second branch is deleted before averaging to reduce impact of the jump-at-start problem (blue); dose-symmetric (black). Mean signal transfers are calculated as the mean of the signal transfer for all tilts within the tomogram.
Fig. 2
Fig. 2
Alignment errors in tilt series collected using different tilt-schemes. Five tomograms were acquired from 3 grids using either bidirectional starting at −21° (green) or dose-symmetric (black) tilt-schemes, during the same data collection sessions. Tilt series were aligned, and the mean fiducial shifts parallel to the tilt axis between each tilt and the adjacent tilt in the positive direction were calculated (e.g. between −60° and −57°, −57° and −54°, …). This is equivalent to the slope of the “marker tilt line” at each tilt. These were then averaged over all tomograms and plotted with respect to tilt-image collection order. Error bars are the standard deviation of the mean fiducial shifts between each tomogram. The mean fiducial shifts are similar for bidirectional and dose-symmetric tilt series, with the exception of a large mean fiducial shift in the bidirectional tilt-scheme between −21° and −24°, i.e. the point where the two branches are joined. This results from the jump-at-start problem, where the second branch of the tilt series is collected after the sample has a larger accumulated dose with resulting specimen deformation.
None
None
None
None
None

References

    1. Bharat T.A.M., Russo C.J., Löwe J., Passmore L.A., Scheres S.H.W. Advances in single-particle electron cryomicroscopy structure determination applied to sub-tomogram averaging. Structure. 2015;23:1743–1753. - PMC - PubMed
    1. Briggs J.A.G. Structural biology in situ–the potential of subtomogram averaging. Curr. Opin. Struct. Biol. 2013;23:261–267. - PubMed
    1. Crowther R.A., Derosier D.J., Klug A. Presented at the Proceedings of the Royal Society of London. Series A. 1970. The reconstruction of a three-dimensional structure from projections and its application to electron microscopy; pp. 319–340. - PubMed
    1. Förster F., Hegerl R. Structure determination in situ by averaging of tomograms. Methods Cell Biol. 2007;79:741–767. - PubMed
    1. Frank, J., 2008. Electron tomography: methods for three-dimensional visualization of structures in the cell.

Publication types

MeSH terms