. 2016 Jun 17;352(6292):1430-5.
doi: 10.1126/science.aaf1084. Epub 2016 May 5.

Translation dynamics of single mRNAs in live cells and neurons

Affiliations

Translation dynamics of single mRNAs in live cells and neurons

Bin Wu et al. Science. .

Abstract

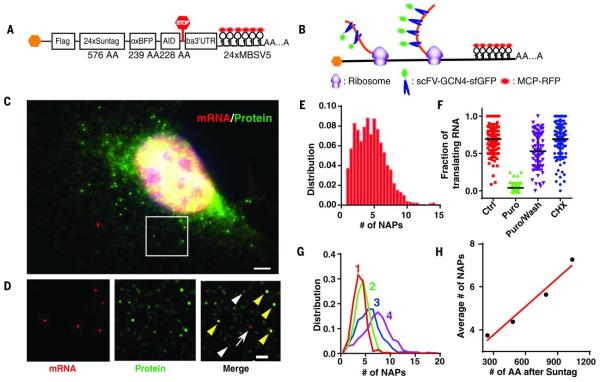
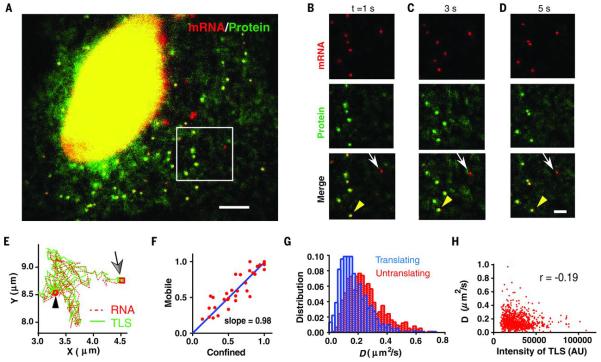
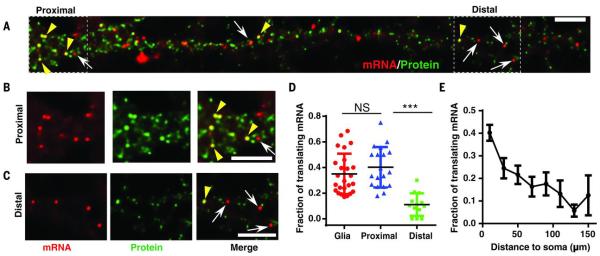
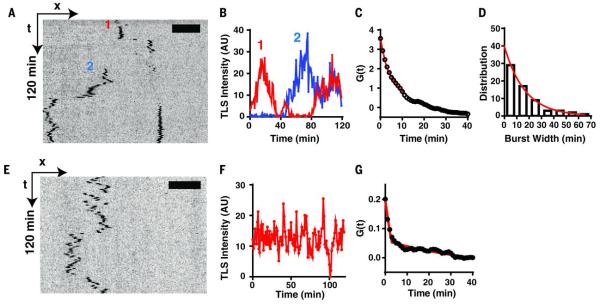
Translation is the fundamental biological process converting mRNA information into proteins. Single-molecule imaging in live cells has illuminated the dynamics of RNA transcription; however, it is not yet applicable to translation. Here, we report single-molecule imaging of nascent peptides (SINAPS) to assess translation in live cells. The approach provides direct readout of initiation, elongation, and location of translation. We show that mRNAs coding for endoplasmic reticulum (ER) proteins are translated when they encounter the ER membrane. Single-molecule fluorescence recovery after photobleaching provides direct measurement of elongation speed (5 amino acids per second). In primary neurons, mRNAs are translated in proximal dendrites but repressed in distal dendrites and display "bursting" translation. This technology provides a tool with which to address the spatiotemporal translation mechanism of single mRNAs in living cells.


Figures

Fig. 1
Fig. 1
System for single-molecule imaging of nascent peptides in live cells. (A) Schematic of the SINAPS construct. Flag, flag tag; AID, auxin induced degron; ba3’UTR, β-actin 3′ untranslated region; AA, amino acid. (B) Schematic of SINAPS. scFV-sfGFP binds to and labels NAPs containing SunTag epitope emerging from ribosome. Polysome assembling on mRNA results in multiple NAPs. (C) smFISH and IF experiments on flag-SINAPS constructs. Green, IF against GFP; red, smFISH against mRNA. The bright green spots colocalizing with red mRNAs are TLSs. Scale bar, 5 μm. (D) The deconvolved image of the box in (C). (Left) smFISH. (Middle) IF. (Right) Merged. Yellow arrowheads indicate TLS; white arrowheads indicate single flag-SINAPS protein; and the white arrow indicates untranslating mRNA. Scale bar, 2 μm. (E) The integrated intensity of TLS is normalized with that of single proteins, giving the number of NAPs (full-length equivalent). (F) The fraction of translating mRNA under treatments. Each symbol represents a single cell. Ctrl, control; Puro, 100 μg/mL puromycin for 10 min; Puro/Wash, 100 μg/mL puromycin treatment for 10 min, then incubation in normal medium for 20 min; CHX, 2 μg/mL CHX treatment for 30 min. (G) The number of NAPs for different constructs at steady state. The longer the mRNA, the more NAPs at the TLS. (H) The mean number of NAPs scales linearly with the length of the coding region. Red line describes a linear fit with slope 0.0044 per amino acid.
Fig. 2
Fig. 2
Dynamics of mRNAs in translation. (A) Snapshot of live cell imaging of cells stably expressing flag-SINAPS (movie S1). Green, scFV-sfGFP; red, stdMCP-Halotag-JF549. Scale bar, 5 μm. (B to D) Montage of movie S2 at time (t) = 1, 3 and 5 s. (Top) mRNA. (Middle) TLS and free proteins. (Bottom) Merged. Yellow arrowheads inidcate TLS, and white arrows indicate untranslating mRNAs. Scale bar, 2 μm. (E) The mRNA (red) and TLS (green) move together. Arrow (square) indicates the start of the track. The black arrowhead (circle) indicates the end of the track. (F) The motion of mRNA is classified either as confined or mobile. The fraction of translating mRNA in each category is almost identical in each cell. Each symbol represents a cell. (G) The histogram of diffusion coefficients (D) of freely diffusing mRNAs. Blue, translating mRNA; red, untranslating mRNA. (H) The diffusion coefficient of the translating mRNA is only weakly anticorrelated with the integrated intensity of TLS; correlation coefficient (r) = −0.19.
Fig. 3
Fig. 3
Local translation on the ER. (A) The schematic of the ER translation reporter. (B) The CytERM peptide is inserted into the ER, while the rest protein domain is kept in the cytosol. The mRNA is tethered to the ER by CytERM, and TLS is labeled with scFV-sfGFP. Although only one ribosome is shown, it is likely that mRNAs are translated by polysomes. The items are described similarly as in Fig. 2. (C) Snapshot of a live cell expressing CytERM-SINAPS (movie S6). Green, scFV-sfGFP; red: stdMCP-Halotag-JF549. Scale bar, 5 μm. (D toF) Montage of movie S7 at t = 2, 6 and 10 s. (Top) mRNAs. (Middle) TLS and free proteins. (Bottom) Merged. Yellow arrowheads indicate TLS; white arrows indicate untranslating mRNAs. Scale bar, 2 μm. (G) The fraction of mobile mRNAs for cytoplasmic mRNAs (cyt), Flag-SINAPS; the ER-targeted mRNAs (ER), CytERM-SINAPS; and CytERM-SINAPS mRNAs in the presence of 100 μg/mL puromycin (ER+Puro). Unpaired t test, ***P < 0.001. NS, not significant. See also movie S5. (H) (Top) A translating mRNA in (C) to (F) shows a confined motion. (Bottom) An untranslating mRNA is freely diffusing. (I) Most translating CytERM-SINAPS mRNAs were confined with very small diffusion coefficient (blue). The untranslating mRNA had higher diffusion coefficient (red). (J) The confined mRNAs had a significantly higher fraction in translation (average 69%) than that of freely diffusing ones (average 3%; all fast moving mRNAs are not translating). (K) The diffusion coefficient of CytERM-SINAPS mRNA when treated with 100 μg/mL puromycin. mRNAs were released from the ER and freely diffuse.
Fig. 4
Fig. 4
Translation kinetics in live cells measured with single-molecule FRAP of TLS. (A) Schematics of FRAP. The existing NAPs on the TLS were bleached with a focused 491-nm laser at t = 0 (black). The fluorescence recovers as existing ribosomes synthesize the SunTag motifs and new ribosomes arrive and make new NAPs (green). At t = ∞, the fluorescence should recover to the beginning value at steady state. (B toD) Montage of FRAP experiments at different time points for (B) control, (C) nonbleached TLS, and (D) CHX treatment. (E) There was little recovery for CHX treatment (D) (black squares) compared with control (B) (blue circles). Fitting the theory (red line) to the experimental data (n = 31 movies) yielded the translation elongation speed v = 4.7 ± 0.6 amino acids/s.
Fig. 5
Fig. 5
Spatial distribution of translation sites in neurons. (A) smFISH and IF experiment. Flag-SINAPS was coexpressed with OsTIR1-IRES-scFV-sfGFP in dissociated primary hippocampal neuron with lentiviral infection at 7 days in vitro. The neurons were fixed at 14 to 21 days in vitro, and smFISH and IF experiments were performed. The dendrites of the neuron were straightened with ImageJ. The whole neuron is shown in fig. S6. Red, mRNA; green, TLS and free protein. Scale bar, 5 μm. (B and C) Segments in the (B) proximal and (C) distal dendrite were enlarged. (Left) mRNA. (Middle) TLS and free protein. (Right) Merged. Yellow arrowheads indicate TLS; white arrows indicate untranslating mRNAs. Scale bar, 5 μm. (D) The fraction of translating mRNA was similar for proximal dendrites (<30 μm to soma) and glial cells in the same culture dish (fig. S6), but significantly less in distal dendrites (>100 μm from soma). Unpaired t test, ***P < 0.001. (E) The fraction of translating mRNA in dendrite as a function of distance to soma (53 dendrites, 19 neurons).
Fig. 6
Fig. 6
Translation dynamics in live neurons. Flag-SINAPS reporter was expressed in primary hippocampal neuron and imaged live. (A) The kymograph of two flag-SINAPS TLSs in dendrites from time-lapse imaging (movies S11 to S13). (B) The integrated intensities of the two TLSs (labeled as 1 and 2, respectively) showing bursting behaviors. (C) Fitting the autocorrelation function of the integrated intensity (average of 61 TLSs) yielded the residence time T = 170 ± 50 s, initiation rate = 2.1/min, and the average length of translation bursts τon = 13 min. (D) The translation burst size was directly measured for tracks showing complete off-on-off cycles. Exponential fit of the histogram yielded the average length of the burst τon = 17 min. (E) Kymograph, (F) integrated intensity trace, and (G) autocorrelation function of constitutive TLS (defined as translating more than 90% of the time during the 2-hour imaging window, average of 13 TLSs). Fitting of correlation function yielded T = 164 ± 24 s, initiation rate = 2.9/min. The length of translation burst was τon >120 min, which is consistent with a constitutive translation.

Comment in

References

    1. Schwanhäusser B, et al. Nature. 2011;473:337–342. - PubMed
    1. Sonenberg N, Hinnebusch AG. Cell. 2009;136:731–745. - PMC - PubMed
    1. Holt CE, Schuman EM. Neuron. 2013;80:648–657. - PMC - PubMed
    1. Buxbaum AR, Haimovich G, Singer RH. Nat. Rev. Mol. Cell Biol. 2015;16:95–109. - PMC - PubMed
    1. Larson DR, Zenklusen D, Wu B, Chao JA, Singer RH. Science. 2011;332:475–478. - PMC - PubMed

Publication types