. 2016 Jun 17;352(6292):aad1210.
doi: 10.1126/science.aad1210.

T helper 1 immunity requires complement-driven NLRP3 inflammasome activity in CD4⁺ T cells

Affiliations

T helper 1 immunity requires complement-driven NLRP3 inflammasome activity in CD4⁺ T cells

Giuseppina Arbore et al. Science. .

Abstract

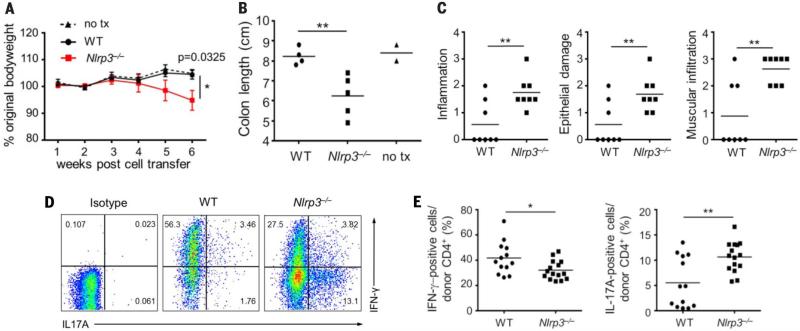
The NLRP3 inflammasome controls interleukin-1β maturation in antigen-presenting cells, but a direct role for NLRP3 in human adaptive immune cells has not been described. We found that the NLRP3 inflammasome assembles in human CD4(+) T cells and initiates caspase-1-dependent interleukin-1β secretion, thereby promoting interferon-γ production and T helper 1 (T(H)1) differentiation in an autocrine fashion. NLRP3 assembly requires intracellular C5 activation and stimulation of C5a receptor 1 (C5aR1), which is negatively regulated by surface-expressed C5aR2. Aberrant NLRP3 activity in T cells affects inflammatory responses in human autoinflammatory disease and in mouse models of inflammation and infection. Our results demonstrate that NLRP3 inflammasome activity is not confined to "innate immune cells" but is an integral component of normal adaptive T(H)1 responses.


Figures

Fig. 1
Fig. 1. Autocrine activation of C5a receptors regulates IFN-γ production by human CD4+ T cells
(A and B) Intracellular C5 and C5a generation in CD4+ T lymphocytes, left nonactivated or activated (36 hours) with anti-CD3 (α-CD3), α-CD3 + α-CD28, or α-CD3 + α-CD46 by flow cytometry (A) and confocal microscopy (B) (data representative of n = 3). (C) RT-PCR analysis for C5AR1 and C5AR2 mRNA in resting human CD4+ cells and monocytes (n = 4, donors D1 to D4, endogenous control ACTB). (D) Intracellular immunofluorescence on resting T cells and monocytes with antibodies to C5aR1 (green) and C5aR2 (red) (data are representative of n = 3). (E) C5aR1 and C5aR2 protein amounts in T cells with expression normalized to respective isotype control staining for each donor (change in mean fluorescence intensity ΔMFI ± SEM, n = 6). (F) Flow cytometry for C5aR1 and C5aR2 on resting T cells and monocytes, with representative histogram plots shown (n = 6). (G) Binding of radioactively labeled 125I-C5a in absence or presence of nonlabeled “cold” C5a as competitor to resting or α-CD3 + α-CD46 activated (4 hours) T cells (n = 6). (H) IFN-γ secretion in nonactivated (NA) and activated (36 hours) CD4+ T cells in the absence or presence of a C5aR1/C5aR2 double receptor antagonist (n = 9), a C5aR2 agonist (n = 8), or a C5aR1 antagonist (n = 7). (I) IFN-γ production by T cells transfected with C5aR1-specific siRNA or a scrambled control siRNA (Ctrl. siRNA) 36 hours after activation (n = 7). Data are means ± SEM. *P < 0.05, **P < 0.01, ****P < 0.0001. (G), paired t test; (H) and (I), two-way ANOVA with Bonferroni multiple comparison test.
Fig. 2
Fig. 2. NLRP3 inflammasome activation occurs in CD4+ T cells and enhances IFN-γ production
(A) Gene set enrichment analysis (GSEA) for inflammasome-related genes in CD4+ T cells after α-CD3 + α-CD46 activation (2 hours) compared to resting cells (donors D1 to D3). (B) Heat map depicting leading edge analysis (the core enriched genes) of the data in (A). (C) NLRP3 immunoblot (upper panel) and immunofluorescence (lower panel) on CD4+ lymphocytes and monocytes (data representative of n = 3). (D) NLRP3, activated caspase-1 and total IL-1β protein expression in activated CD4+ cells (data representative of n = 3). (E) Representative immunofluorescence costaining for NLRP3 (green) and ASC (red) on resting and α-CD3 + α-CD46 activated T cells (r = Pearson correlation coefficient between NLRP3 and ASC fluorescence, n = 3). (F and G) IFN-γ production by resting (NA) and activated CD4+ T cells with or without MCC950 addition (n = 7) (F) and with or without rhIL-1β supplementation (n = 3) (G). (H) IFN-γ production in presence of the specific caspase-1 inhibitor Z-YVAD-FMK with or without rhIL-1β addition. *P < 0.05, **P < 0.01, ***P < 0.001, ****P < 0.0001. (F) to (H), two-way ANOVA with Bonferroni multiple comparison test.
Fig. 3
Fig. 3. T cells from CAPS patients have increased NLRP3 inflammasome activity and hyperactive TH1 responses
(A) IL-1β production from CD4+ T cells activated with α-CD3 + α-CD46 for 36 hours from four healthy donors (HD1 to HD4) and seven patients with CAPS (cohort 1, P1 to P7). (B) IL-1β secretion from resting and α-CD3 + α-CD46 activated CD4+ cells from seven patients with CAPS (P8 to P14, individual values) and five healthy sex- and age-matched donors (HD5 to HD9, combined values). (C) IFN-γ secretion from resting and activated CD4+ cells from seven patients with CAPS (P8 to P14) and seven healthy sex- and age-matched donors (HD5 to HD11). (D) Correlation between IL-1β and IFN-γ production in T cells from patients P8 to P14 upon α-CD3 + α-CD46 activation (Spearman correlation analysis). (E) IL-17 production by resting and activated T cells from CAPS patients P8 to P14 and healthy donors H5 to H11. (F) IFN-γ and IL-1β secretion by CD4+ T cells from P8, P11, and P14 after α-CD3 + α-CD46 activation with or without MCC950 treatment (% normalized to nontreated). Analyses on (A) to (F) were performed at 36 hours after activation. Values correspond to two technical replicates for every patient and healthy control sample in each experiment. Data are means ± SEM. *P < 0.05, **P < 0.01. (A), unpaired t test; (C) and (E), two-way ANOVA with Bonferroni multiple comparison test; (D), Spearman correlation test; (F), paired t test.
Fig. 4
Fig. 4. C5a receptors modulate NLRP3 activation to regulate IFN-γ responses
(A) IFN-γ production in CD4+ T cells either left nonactivated (NA) or activated as depicted with or without addition of the C5aR1/C5aR2 antagonist and/or MCC950 (n = 3). (B and C) Measurement of active caspase-1–positive CD4+ T cells activated with α-CD3 + α-CD46 with or without MCC950, the C5aR1/C5aR2 antagonist or the C5aR2 agonist (n = 3) (B) and statistical analyses of data obtained (C). (D) Corresponding IL-1β secretion in activated CD4+ cells treated as in (B) (n = 5). (E and F) Active caspase-1 levels [(E), n = 4] and IL-1β secretion [(F), n = 7] in T cells after transfection with either C5aR1-specific siRNA or scrambled control (Ctrl.) siRNA. (G) IFN-γ production in activated CD4+ T cells after transfection with C5aR1-specific siRNA or a scrambled control siRNA (Ctrl. siRNA) with or without addition of rhIL-1β (n = 3). Analyses were performed at 36 hours after activation. Data are means ± SEM. *P < 0.05, **P < 0.01. (A), (D), and (G), two-way ANOVA with Bonferroni multiple comparison test; (C), (E), and (F), paired t test.
Fig. 5
Fig. 5. Intracellular C5aR1 activation induces ROS generation in CD4+ T cells
(A) ROS production in CD4+ T cells activated under the depicted conditions (data shown are representative of n = 3). (B) IFN-γ production from CD4+ T cells left nonactivated or activated as indicated with and without a specific ROS inhibitor and/or the C5aR1/C5aR2 antagonist (n = 3). Data are from a two-way ANOVA with Bonferroni multiple comparison test. (C) ROS production in α-CD3 + α-CD46 activated CD4+ cells after transfection with C5aR1-specific siRNA (left panel) or with or without the C5aR1/C5aR2 double antagonist (right panel) (data shown are representative of n = 3). Analyses were performed 36 hours after activation. Data are means ± SEM. *P < 0.05, **P < 0.01, ***P < 0.001.
Fig. 6
Fig. 6. NLRP3 function in CD4+ T cells drives optimal IFN-γ production during viral infection
(A) RT-PCR analysis on CD4+ T cells isolated from wild type (WT), Nlrp3, combined Il1a−/− and Il1b−/− (Il1a/b−/−) and Il1r1−/− mice for corresponding gene mRNA expression. (B) Cytokine secretion from CD4+ T cells isolated from wild-type and knockout mice at 96 hours after α-CD3 + α-CD28 activation (n = 3). (C) Cytokine production from CD4+ T cells from wild-type and Nlrp3−/− mice after α-CD3 + α-CD28 activation (96 hours) with or without addition of MCC950 (n = 4). (D) Schematic of the acute lymphocytic choriomeningitis virus (LCMV) infection model used in this study. (E and F) Percentage of LCMV tetramer-positive CD4+ T cells isolated from the spleens of the three bone marrow chimeric mice groups used 12 days after infection (E) and percentages of Ki67+GP66-77+/tetramer-positive cells (F). (G and H) Representative intracellular IFN-γ staining in splenic CD4+ T cells of one mouse from each group after LCMV peptide restimulation (5 hours) [(G), n = 6] with corresponding statistical analyses [(H), n = 6]. Data are means ± SEM. *P < 0.05, **P < 0.01. (B), one-way ANOVA with Tukey multiple comparison test; (C), two-way ANOVA with Bonferroni multiple comparison test; (E) to (H), paired t test. Data in (G) are representative of two independent experiments; data in (E), (F), and (H) are pooled from two independent experiments.
Fig. 7
Fig. 7. T cell intrinsic NLRP3 activity regulates the TH1-TH17 balance in intestinal inflammation
(A to E) Naïve splenic CD25CD45RBhi CD4+ T cells from wild-type or Nlpr3−/− mice were transferred into C57BL/10 Rag2−/− mice. (A) Weight change over the course of colitis induction. (B) Colon length at the study endpoint. (C) Inflammation score of the colons according to blinded histological analysis with assessment of inflammation (left panel), epithelial damage (middle panel) and muscular immune cell infiltration (right panel). (D and E) Intracellular IFN-γ and IL-17A staining of colonic CD4+ T cells at the study endpoint after overnight α-CD3 + α-CD28 stimulation and brefeldin A and monensin addition for 5 hours (gated on live CD4+ Thy1.2+ T cells). Representative flow cytometric plots (D) with corresponding statistical analysis shown from two combined independent experiments [(E), n = 13 wild-type, n = 15 KO]. Data are means ± SEM. *P < 0.05, **P < 0.01. (A) and (B), one-way ANOVA with Sidak multiple-comparisons test; (C) and (E), unpaired t test. Data are representative of two experiments [(A) to (C)] or are combined from two experiments (E).

Comment in

References

    1. Ricklin D, Hajishengallis G, Yang K, Lambris JD. Complement: A key system for immune surveillance and homeostasis. Nat. Immunol. 2010;11:785–797. doi: 10.1038/ni.1923; pmid: 20720586. - PMC - PubMed
    1. Murphy KM, Stockinger B. Effector T cell plasticity: Flexibility in the face of changing circumstances. Nat. Immunol. 2010;11:674–680. doi: 10.1038/ni.1899; pmid: 20644573. - PMC - PubMed
    1. Cardone J, et al. Complement regulator CD46 temporally regulates cytokine production by conventional and unconventional T cells. Nat. Immunol. 2010;11:862–871. doi: 10.1038/ni.1917; pmid: 20694009. - PMC - PubMed
    1. Liszewski MK, et al. Intracellular complement activation sustains T cell homeostasis and mediates effector differentiation. Immunity. 2013;39:1143–1157. doi: 10.1038/ni.1917; pmid: 20694009. - PMC - PubMed
    1. Le Friec G, et al. The CD46-Jagged1 interaction is critical for human TH1 immunity. Nat. Immunol. 2012;13:1213–1221. doi: 10.1038/ni.2454; pmid: 23086448. - PMC - PubMed

Publication types

MeSH terms