. 2016 Jul 5;113(27):7596-601.
doi: 10.1073/pnas.1600934113. Epub 2016 Jun 16.

Deletion of the gene Pip4k2c, a novel phosphatidylinositol kinase, results in hyperactivation of the immune system

Affiliations

Deletion of the gene Pip4k2c, a novel phosphatidylinositol kinase, results in hyperactivation of the immune system

Hyeseok Shim et al. Proc Natl Acad Sci U S A. .

Abstract

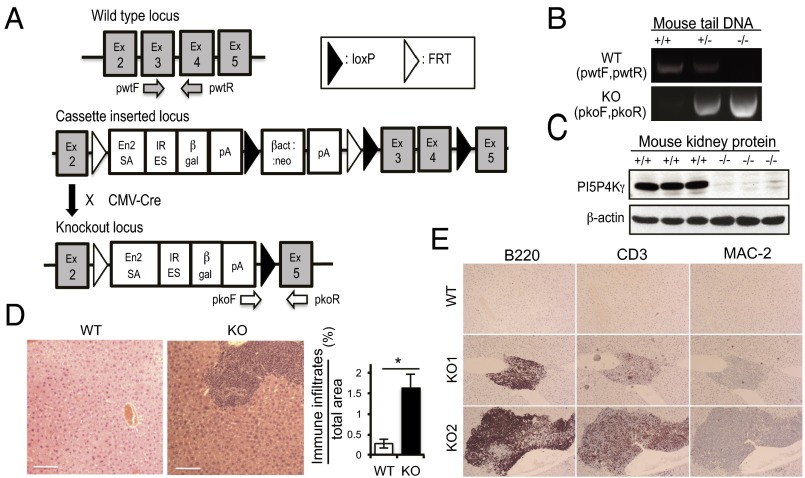
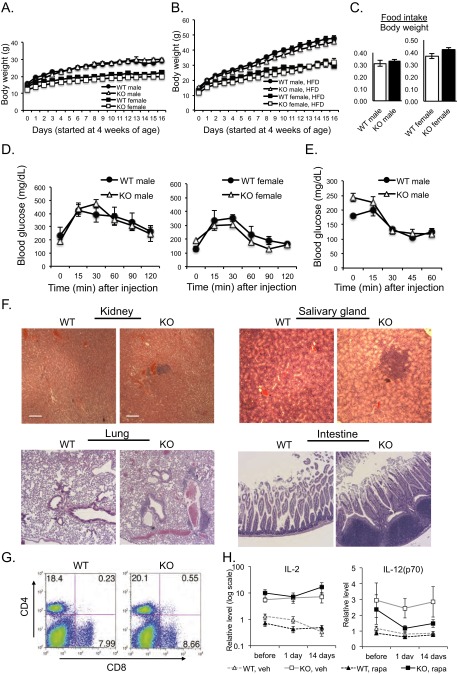
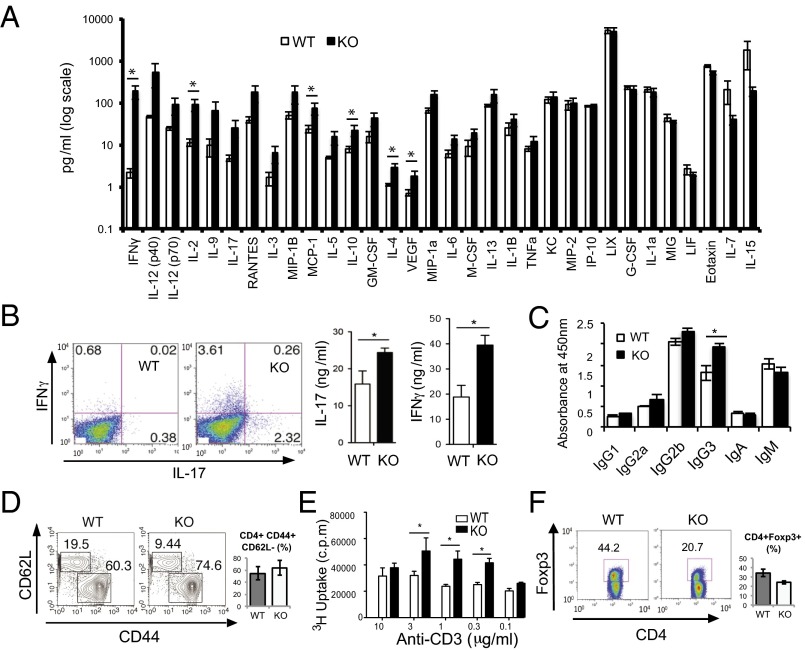
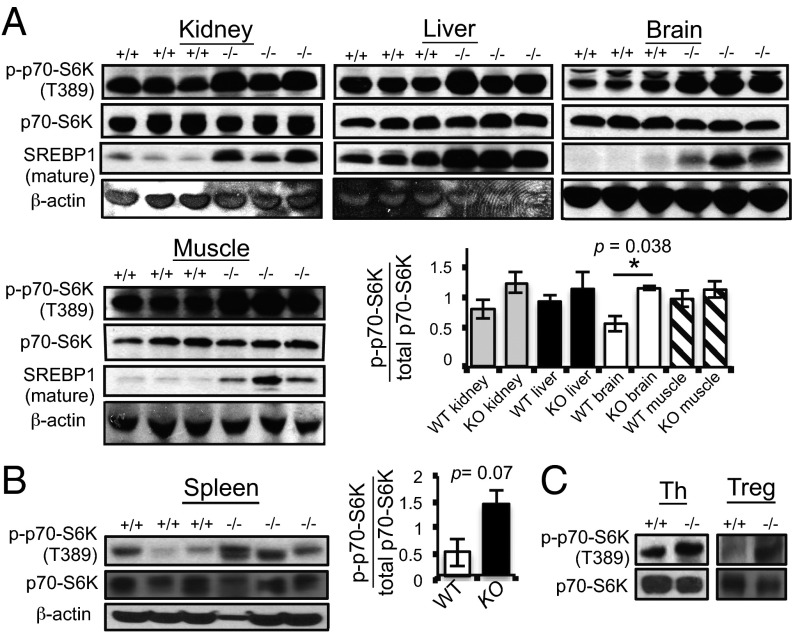
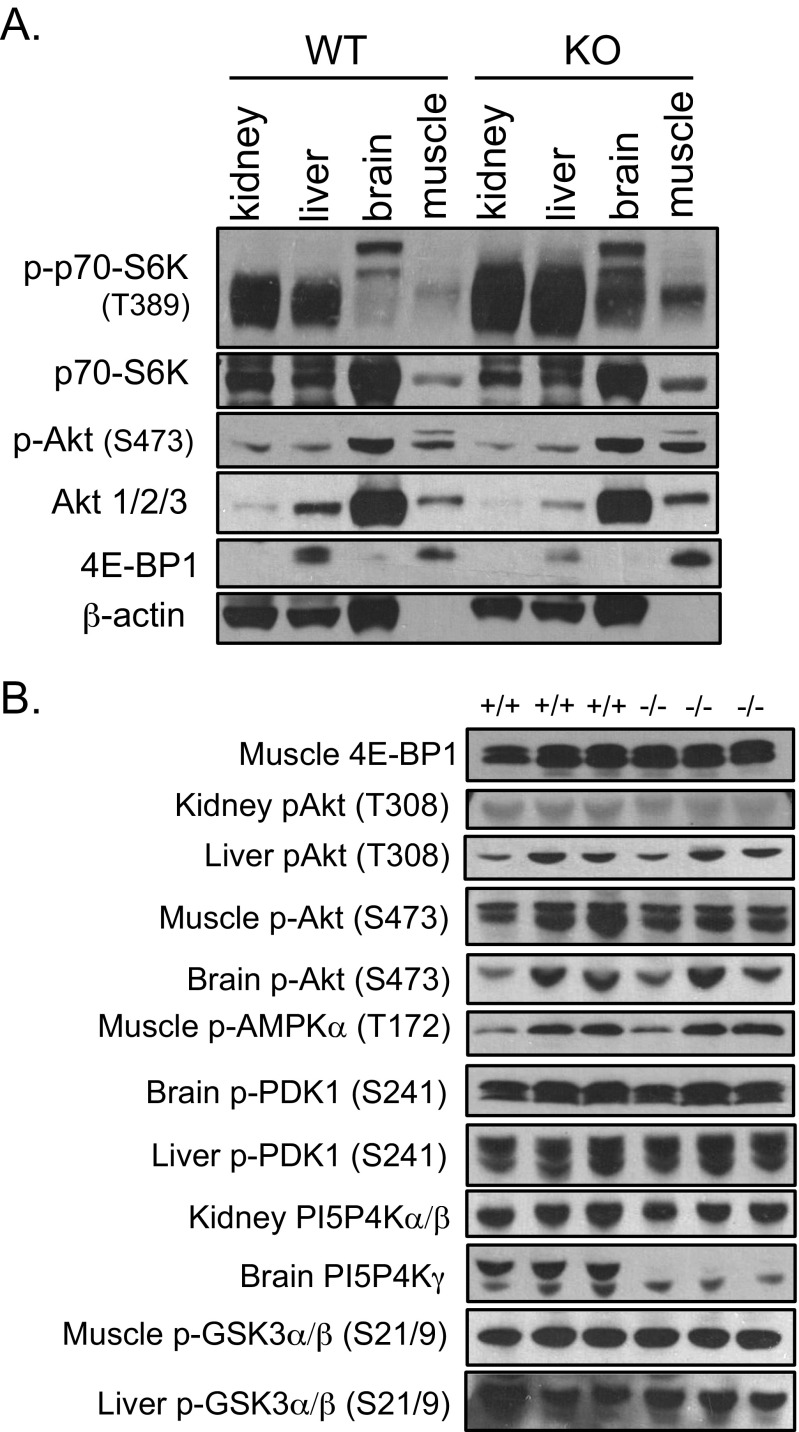
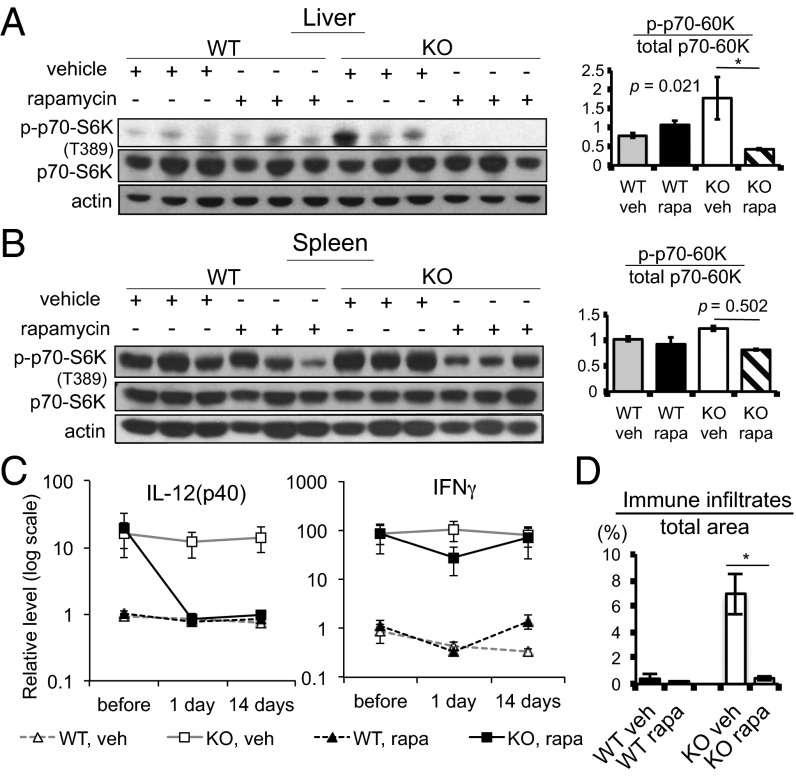
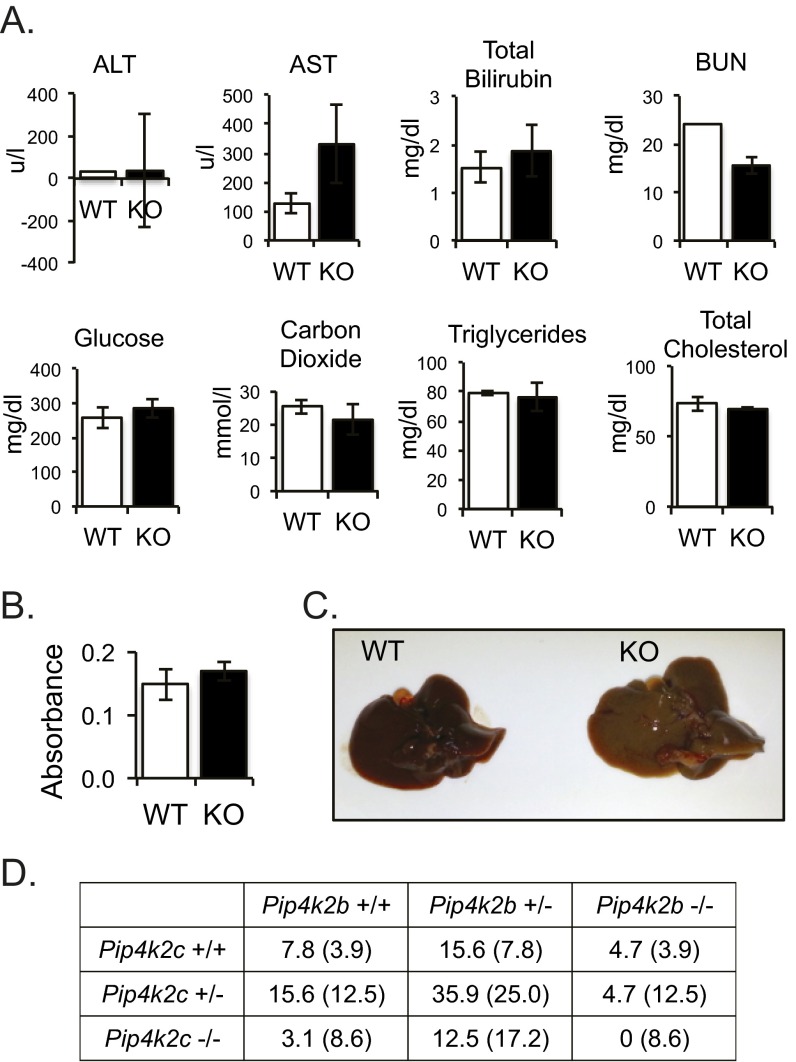
Type 2 phosphatidylinositol-5-phosphate 4-kinase (PI5P4K) converts phosphatidylinositol-5-phosphate to phosphatidylinositol-4,5-bisphosphate. Mammals have three enzymes PI5P4Kα, PI5P4Kβ, and PI5P4Kγ, and these enzymes have been implicated in metabolic control, growth control, and a variety of stress responses. Here, we show that mice with germline deletion of type 2 phosphatidylinositol-5-phosphate 4-kinase gamma (Pip4k2c), the gene encoding PI5P4Kγ, appear normal in regard to growth and viability but have increased inflammation and T-cell activation as they age. Immune cell infiltrates increased in Pip4k2c(-/-) mouse tissues. Also, there was an increase in proinflammatory cytokines, including IFNγ, interleukin 12, and interleukin 2 in plasma of Pip4k2c(-/-) mice. Pip4k2c(-/-) mice had an increase in T-helper-cell populations and a decrease in regulatory T-cell populations with increased proliferation of T cells. Interestingly, mammalian target of rapamycin complex 1 (mTORC1) signaling was hyperactivated in several tissues from Pip4k2c(-/-) mice and treating Pip4k2c(-/-) mice with rapamycin reduced the inflammatory phenotype, resulting in a decrease in mTORC1 signaling in tissues and a decrease in proinflammatory cytokines in plasma. These results indicate that PI5P4Kγ plays a role in the regulation of the immune system via mTORC1 signaling.

Keywords: PI5P4K; PIP4K2C; autoimmunity; inflammation; mTORC1.


Conflict of interest statement

Conflict of interest statement: L.C.C. owns equity in, receives compensation from, and serves on the board of directors and scientific advisory board of Agios Pharmaceuticals. Agios Pharmaceuticals is identifying metabolic pathways of cancer cells and developing drugs to inhibit such enzymes to disrupt tumor cell growth and survival. L.C.C. owns equity in, receives compensation from, and serves on the scientific advisory board of Petra Pharmaceuticals, a company that develops targeted therapies for cancer treatment. In addition, Petra Pharmaceuticals will be providing funds to support research in the L.C.C. laboratory, although the research described in this paper predated the existence of this collaborative agreement.

Figures

Fig. 1.
Fig. 1.
Generation of Pip4k2c−/− mice. (A) Schematic representation of the Pip4k2c locus before and after deletion of the critical exons (exons 3 and 4). The deletion of the critical exons was induced by Cre-lox recombination. β-gal, β-galactosidase; En2SA, engrailed 2 gene splice acceptor sequence; Ex, exon; neo, neomycin; pA, polyA signal. (B) PCR analysis of genomic DNA prepared from mouse tail. Primers used for genotyping by PCR are pwtF, pwtR, pkoF, and pkoR. (C) Western blotting of proteins prepared from mouse kidney. (D) Immune cell infiltration in the liver of Pip4k2c−/− mice. H&E staining readily identifies immune infiltrates in the liver tissue from Pip4k2c−/− mice. (Scale bars, 100 μm.) The area of immune infiltrates of H&E-stained liver tissues was quantified using ImageJ software. Twenty-five Pip4k2c−/− mice and 12 wild-type mice (four images per mouse) were examined. The results are presented as means ± SE of the means. (E) Immune infiltrates in liver tissue of Pip4k2c−/− mice are mostly T cells and B cells. The Pip4k2c−/− liver sections of two animals (KO1 and KO2) were incubated with anti-CD3, anti-B220, and anti-Mac2 antibodies, respectively.
Fig. S1.
Fig. S1.
Phenotypes of Pip4k2c−/− mice. (A and B) The growth curves of wild-type and Pip4k2c−/− mice. Mice (started at the age of 4 wk) were weighed weekly for 16 wk. (A) Mice placed on a normal diet. n > 9 per group. (B) Mice placed on a high-fat diet. n > 13 per group. The results are presented as means ± SE of the means. (C) Food intake of wild-type and Pip4k2c−/− mice. The food intake was measured by housing one or two mice of the same genotype per cage and weighing the food in the cages every morning at 11:00 AM every 3 d for 2 wk. The amount of food consumed was divided by the average body weight of the mice in each cage. n = 5 per group. The results are presented as means ± SE of the means. (D) Glucose tolerance test of wild-type and Pip4k2c−/− mice. After weaning, the 4-wk-old mice were placed on a high-fat diet for 5 mo. The mice were i.p. injected with 1 mg of glucose per gram of body weight from a 20 mg/mL solution of glucose in 0.9% NaCl. Blood glucose levels were measured with a One Touch Basic glucose meter before injection of glucose and at indicated time points. n > 5 per group. The results are presented as means ± SE of the means. (E) Insulin tolerance test of wild-type and Pip4k2c−/− mice. The mice were starved from 9:00 AM to 1:00 PM and at 1 PM, the mice were i.p. injected with Novolin-R at a dose of 0.5 units/kg of body weight. Blood glucose levels were measured with a One Touch Basic glucose meter before injection of glucose and at indicated time points, three WT mice and six KO mice (6 mo old). The results are presented as means ± SE of the means. (F) Immune cell infiltration in the kidney, salivary gland, lungs, and intestine of Pip4k2c−/− mice. H&E staining readily identifies immune infiltrates in the indicated tissue of 12- to 14-mo-old Pip4k2c−/− mice. (Scale bars, 100 μm.) (G) Flow cytometry of CD4+ and CD8+ T cells isolated from spleens of wild-type versus Pip4k2c−/− mice. The most representative data from three independent experiments are given, with n > 3 mice (12–14 mo old) from each group. (H) Effects of rapamycin treatment of wild-type mice or Pip4k2c−/− mice on plasma IL-2 and IL-12(p70) levels. Plasma cytokines were detected using multiplex cytokine ELISA. Plasma was collected before the treatment (“before”), 24 h after the first treatment (“1 day”), and a day after the final treatment (“14 day”) from the following four groups: wild type with vehicle, wild type with rapamycin (3 mg⋅kg−1⋅d−1), knockout with vehicle, and knockout with rapamycin (3 mg⋅kg−1⋅d−1), approximately four to eight mice (12–14 mo old) per group, daily i.p. injections for 2 wk. Data were normalized to the mean plasma level of IL-2 and IL-12(p70) in wild-type mice before therapy with 1 on the y axis indicating the mean of wild-type pretreatment (WT, vehicle, before): IL-2: 11.2115 RLU, IL-12(p70): 24.359 RLU. The results are presented as means ± SE of the means.
Fig. 2.
Fig. 2.
Proinflammatory cytokines are increased in Pip4k2c−/− mice. (A) Plasma cytokines were detected using multiplex cytokine ELISA. The experiments were performed on >10 mice (12–14 mo old) per group, with two measurements per mouse. The y axis is in logarithmic scale. The results are presented as means ± SE of the means. *P < 0.05. (B) T-cell–derived IFNγ and IL-17 levels are elevated in Pip4k2c−/− mice. Flow cytometry of IL-17 and IFNγ secretion by CD4+ T cells isolated from spleen-indicated groups. The data are representative of three independent experiments with n > 3 mice (12–14 mo old) per group. *P < 0.05 (Student’s t test, error bars represent SD). (C) Plasma IgG3 levels are elevated in Pip4k2c−/− mice. Plasma Ig levels were measured using ELISA. Three Pip4k2c−/− mice (12 mo old) and four age-matched wild-type mice were examined. The results are presented as means ± SE of the means. *P < 0.05. (D) Pip4k2c−/− mice exhibit an increase in CD44+ active T cells and a decrease in CD62L+ naïve T cells. Flow cytometry is shown of CD44+ and CD62L+ T cells isolated from spleen-indicated groups. The most representative data from three independent experiments are given, with n > 3 mice (12–14 mo old) from each group. (E) T cells from Pip4k2c−/− mouse have enhanced growth rates. CD4+ T cells were isolated from spleens of 12-mo-old mice and cultured in media containing 3H-thymidine. The level of radioactivity was measured by liquid scintillation. The data are presented as mean 3H-thymidine incorporation (cpm ± SEM, performed in triplicate). *P < 0.05. (F) Regulatory T cells are suppressed in Pip4k2c−/− mice. Flow cytometry of Foxp3+ and CD4+ T cells isolated from spleen-indicated groups. The most representative data from three independent experiments are given, with n > 3 mice (12–14 mo old) from each group.
Fig. 3.
Fig. 3.
Signaling downstream of mTORC1 is up-regulated in various tissues of Pip4k2c−/− mice. (A) p70-S6K Thr389 phosphorylation, total p70-S6K, and SREBP1 (cleaved mature form) were blotted for in kidney, liver, brain, and muscles from 12-mo-old wild-type and Pip4k2c−/− mice (three mice per group). The bar graph shows the ratio of p70-S6K Thr389 phosphorylation over total p70-S6K. The results are presented as means ± SE of the means. *P < 0.05. (B) p70-S6K Thr389 phosphorylation and total p70-S6K were blotted for spleen of 12-mo-old mice (three mice per group). The bar graph shows the ratio of p70-S6K Thr389 phosphorylation over total p70-S6K. The results are presented as means ± SE of the means. (C) Th cells and Treg cells isolated from the spleens of 12-mo-old mice (three mice per group). p70-S6K Thr389 phosphorylation and total p70-S6K were blotted.
Fig. S2.
Fig. S2.
Signaling pathway components of PI3K–Akt–mTORC1 in various tissues of Pip4k2c−/− mice. (A) p70-S6K Thr389 phosphorylation, total p70-S6K, Akt Ser473 phosphorylation, total Akt 1/2/3, 4E-BP1, and β-actin were blotted for kidney, liver, brain, and muscles from 12-mo-old wild-type (Left) and Pip4k2c−/− mice (Right). (B) Other components of PI3K–Akt–mTORC1 were blotted for indicated tissues of 12-mo-old mice (three mice per group).
Fig. 4.
Fig. 4.
(A and B) Rapamycin reduces the activation of mTORC1 signaling in Pip4k2c−/− mice. p70-S6K Thr389 phosphorylation, total p70-S6K, and actin were blotted for in liver (A) and spleen (B) from 12- to 14-mo-old wild-type and Pip4k2c−/− mice treated with vehicle or rapamycin. Daily i.p. injections were given for 2 wk (3 mg⋅kg−1⋅d−1, three mice per group). The bar graph shows the ratio of p70-S6K Thr389 phosphorylation over total p70-S6K. The results are presented as means ± SE of the means. *P < 0.05. (C) Changes in plasma cytokine levels after treatment with rapamycin. Plasma cytokines were detected using multiplex cytokine ELISA. Plasma was collected before the treatment (“before”), 24 h after the first treatment (“1 day”), and a day after the final treatment (“14 day”) from the following four groups: wild type with vehicle, wild type with rapamycin (3 mg⋅kg−1⋅d−1), knockout with vehicle, and knockout with rapamycin (3 mg⋅kg−1⋅d−1) [approximately four to eight mice (12–14 mo old) per group, daily i.p. injection for 2 wk]. Data were normalized to the mean plasma level of IL-12(p40) and IFNγ in wild-type mice before therapy, with 1 on the y axis indicating the mean of wild-type pretreatment (WT, vehicle, before): IL-12(p40): 46.1875 relative luminescence unit (RLU), IFNγ: 2.148 RLU. The results are presented as means ± SE of the means. Results for IL-2 and IL-12(p70) are shown in Fig. S1H. (D) Changes in immune cell infiltration after treatment with rapamycin. Mouse livers were collected after the final treatment (daily i.p. injections for 2 wk) from the following groups: wild type with vehicle, wild type with rapamycin (3 mg⋅kg−1⋅d−1), knockout with vehicle, and knockout with rapamycin (3 mg⋅kg−1⋅d−1), approximately four to eight mice (12–14 mo old) per group. The area of immune infiltrates of H&E-stained liver tissues was quantified using ImageJ software. Five images per mouse were examined. The y axis indicates the ratio of the area of immune infiltrates over total area of the tissue in each image. The results are presented as means ± SE of the means. *P < 0.05.
Fig. S3.
Fig. S3.
Additional phenotypes of Pip4k2c−/− mice. (A) Plasma levels of liver function parameter proteins and metabolites. Plasma of the mice were collected and analyzed for the level of the proteins and metabolites indicated (three 12-mo-old mice per genotype). The results are presented as means ± SE of the means. ALT, alanine transaminase; AST, aspartate transaminase; BUN, blood urea nitrogen. (B) Levels of rheumatoid factor in plasma. Rheumatoid factor was measured using mouse rheumatoid factor Ig ELISA kit (6200, Alpha Diagnostic International) according to the manufacturer’s protocol (three 12-mo-old mice per genotype). The results are presented as means ± SE of the means. (C) Gross observation of Pip4k2c−/− mouse livers. (Left) Wild type; (Right) Pip4k2c−/− (12 mo old). Pale color livers were often found in Pip4k2c−/− mice older than 12 mo. (D) Pip4k2b−/− Pip4k2c−/− mice are not viable at the developmental stage. Table showing the expected and observed genotype frequency (%) of 3-wk-old pups from breeding Pip4k2b+/− Pip4k2c+/− with Pip4k2b+/− Pip4k2c−/−, Pip4k2b+/− Pip4k2c+/−, or Pip4k2b−/− Pip4k2c+/− mice. Expected percent frequency is provided in parentheses. n = 64.

References

    1. Clarke JH, Emson PC, Irvine RF. Localization of phosphatidylinositol phosphate kinase IIgamma in kidney to a membrane trafficking compartment within specialized cells of the nephron. Am J Physiol Renal Physiol. 2008;295(5):F1422–F1430. - PMC - PubMed
    1. Ciruela A, Hinchliffe KA, Divecha N, Irvine RF. Nuclear targeting of the beta isoform of type II phosphatidylinositol phosphate kinase (phosphatidylinositol 5-phosphate 4-kinase) by its alpha-helix 7. Biochem J. 2000;346(Pt 3):587–591. - PMC - PubMed
    1. Clarke JH, Emson PC, Irvine RF. Distribution and neuronal expression of phosphatidylinositol phosphate kinase IIgamma in the mouse brain. J Comp Neurol. 2009;517(3):296–312. - PMC - PubMed
    1. Lamia KA, et al. Increased insulin sensitivity and reduced adiposity in phosphatidylinositol 5-phosphate 4-kinase beta-/- mice. Mol Cell Biol. 2004;24(11):5080–5087. - PMC - PubMed
    1. Emerling BM, et al. Depletion of a putatively druggable class of phosphatidylinositol kinases inhibits growth of p53-null tumors. Cell. 2013;155(4):844–857. - PMC - PubMed

Publication types

Substances