. 2016 Jun 2:10:146.
doi: 10.3389/fncel.2016.00146. eCollection 2016.

Reactive Oxygen Species Derived from NOX3 and NOX5 Drive Differentiation of Human Oligodendrocytes

Affiliations

Reactive Oxygen Species Derived from NOX3 and NOX5 Drive Differentiation of Human Oligodendrocytes

Roberta Accetta et al. Front Cell Neurosci. .

Abstract

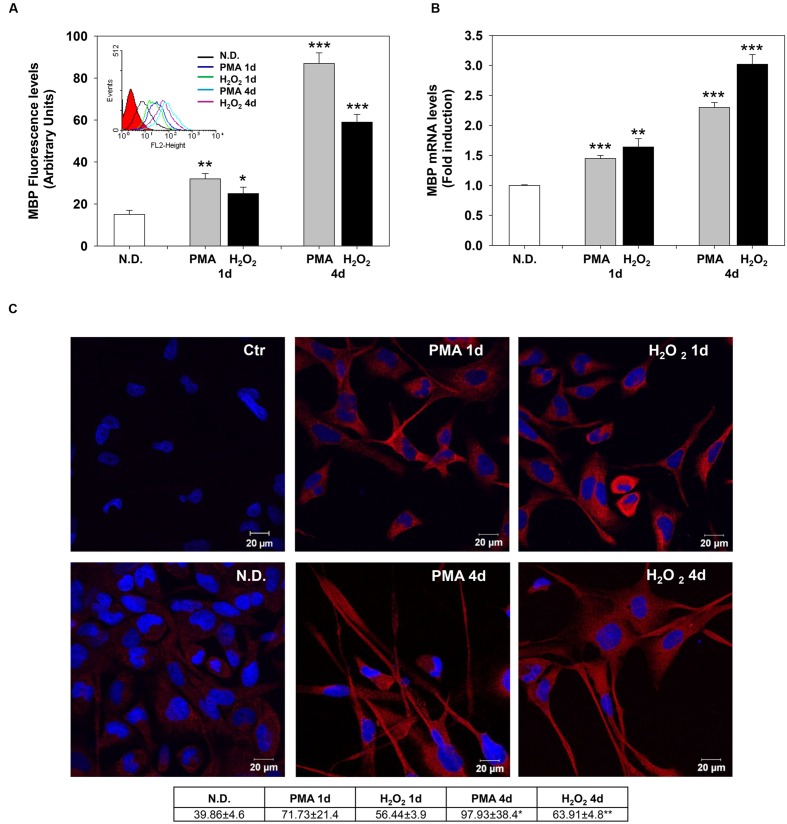
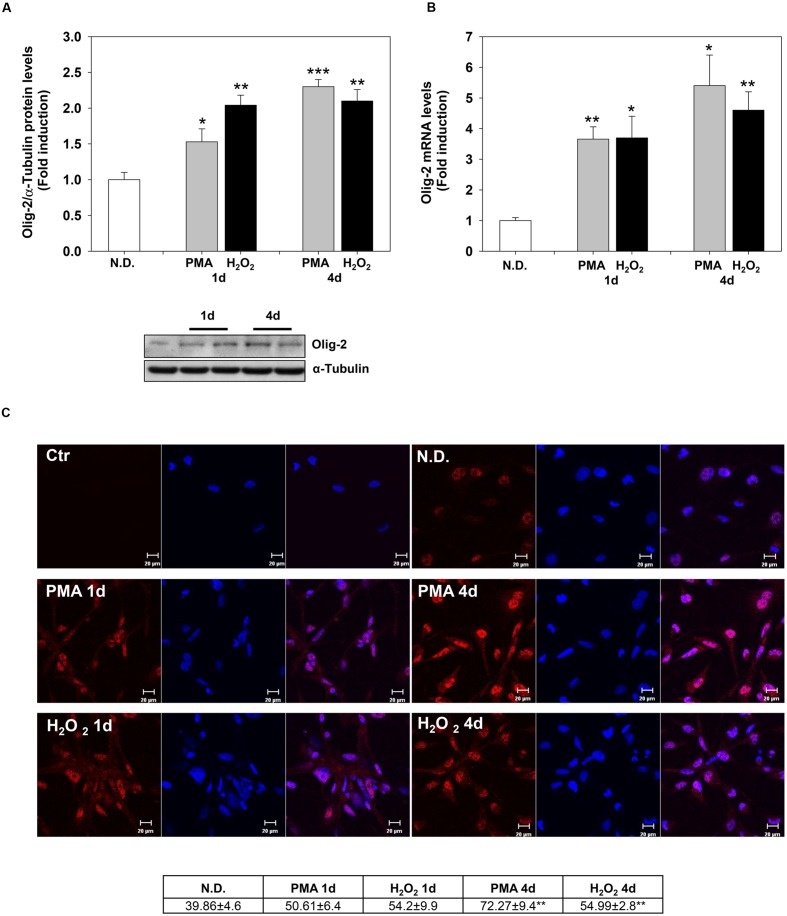
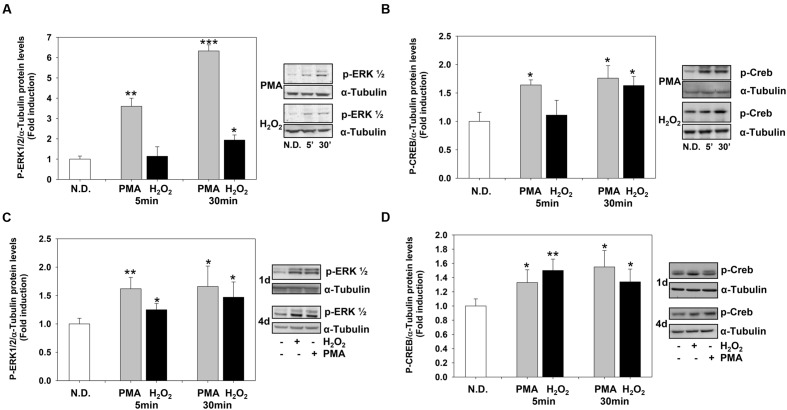
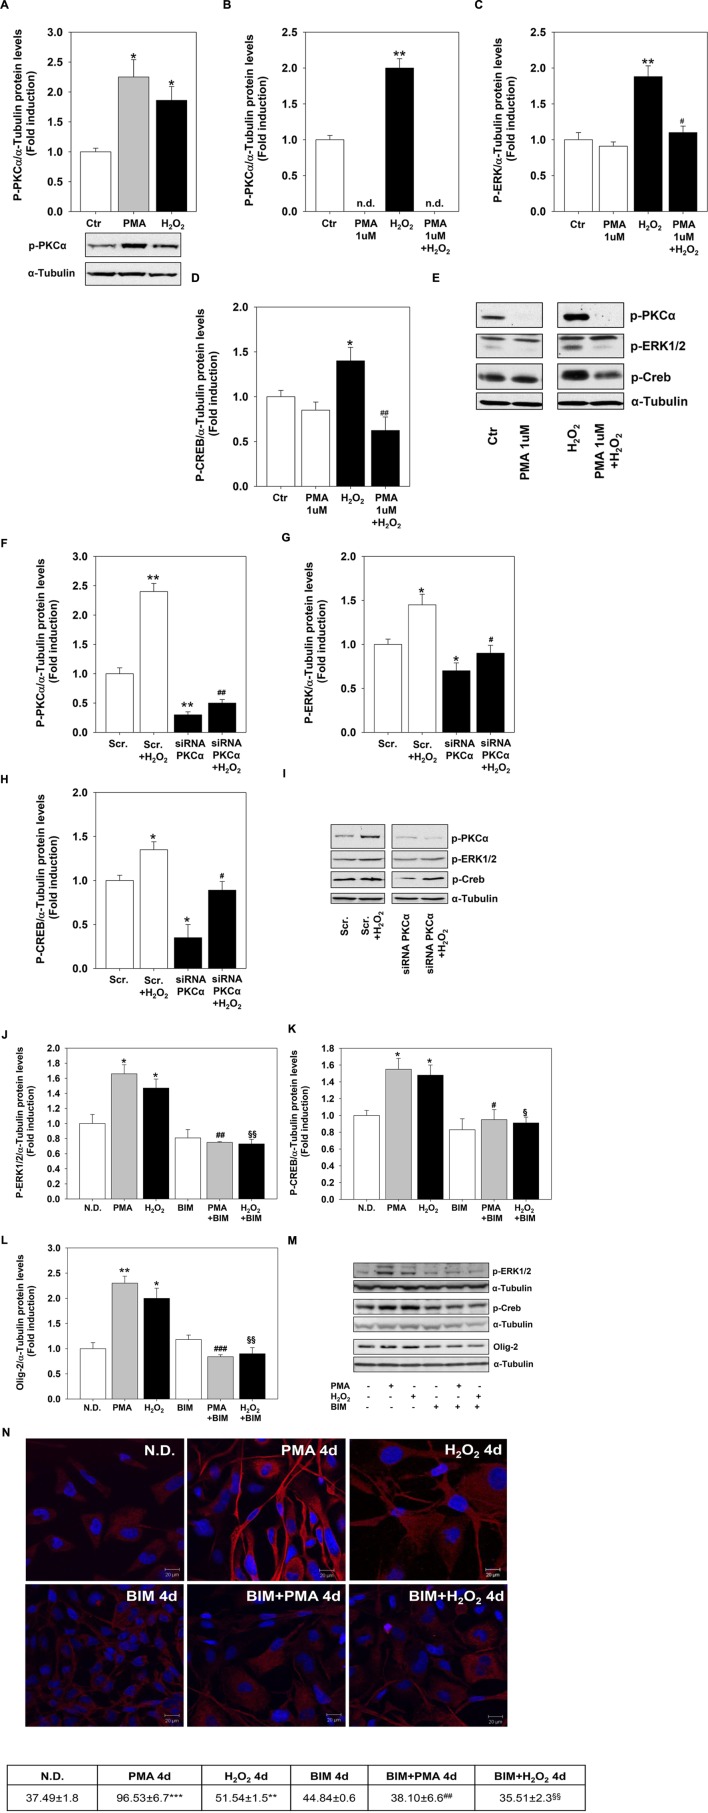
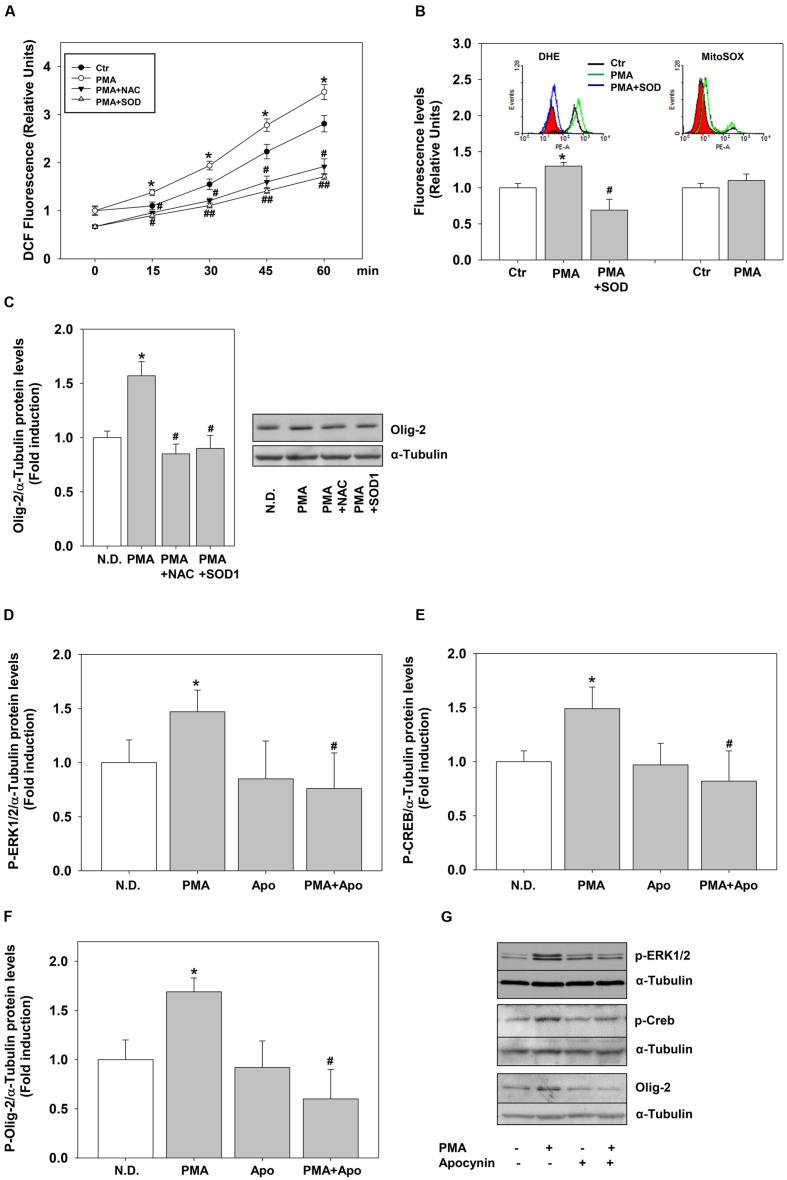
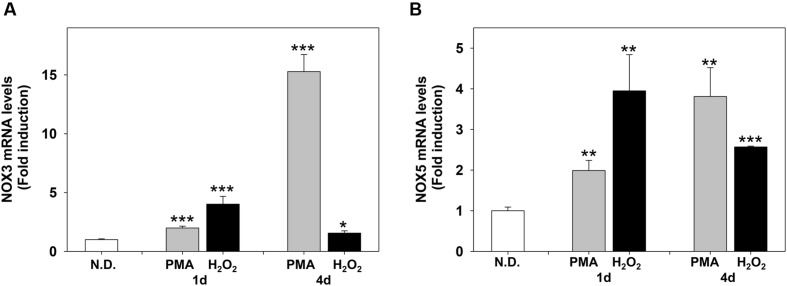
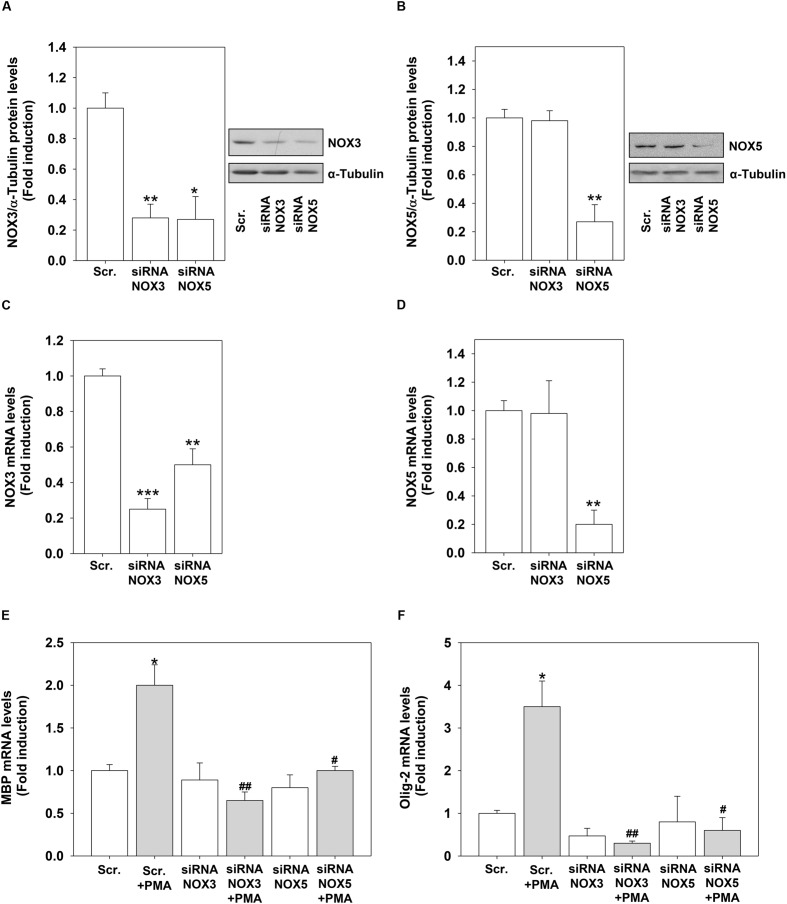
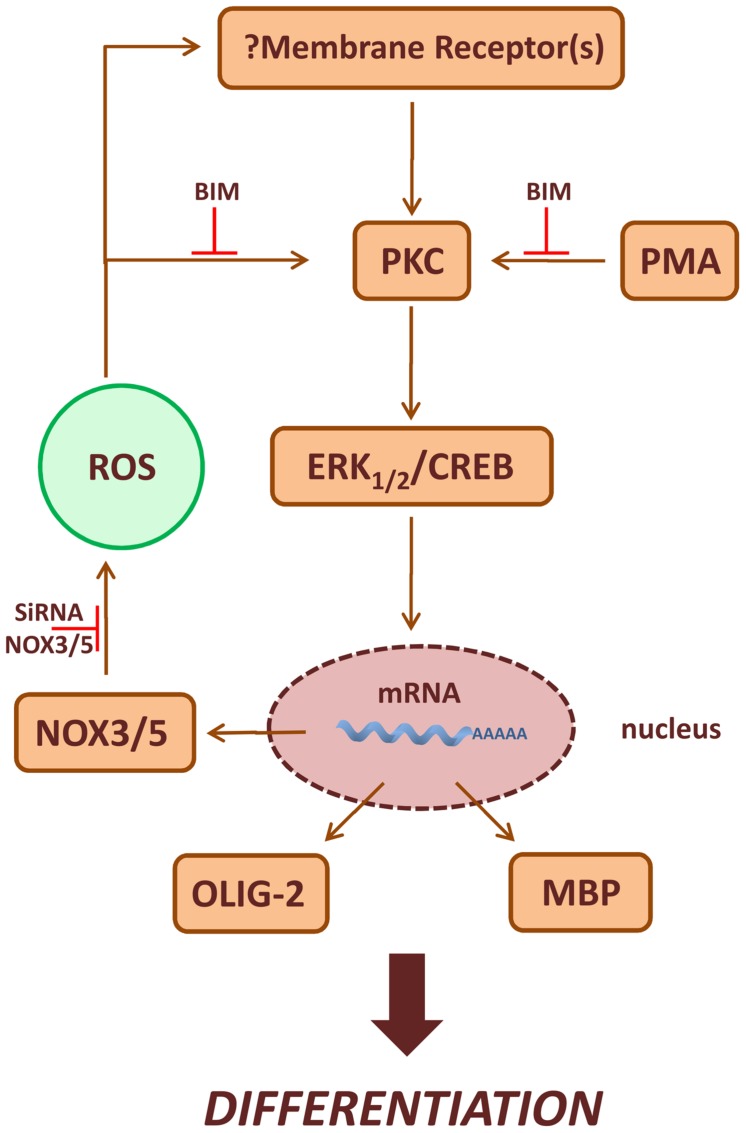
Reactive oxygen species (ROS) are signaling molecules that mediate stress response, apoptosis, DNA damage, gene expression and differentiation. We report here that differentiation of oligodendrocytes (OLs), the myelin forming cells in the CNS, is driven by ROS. To dissect the OL differentiation pathway, we used the cell line MO3-13, which display the molecular and cellular features of OL precursors. These cells exposed 1-4 days to low levels of H2O2 or to the protein kinase C (PKC) activator, phorbol-12-Myristate-13-Acetate (PMA) increased the expression of specific OL differentiation markers: the specific nuclear factor Olig-2, and Myelin Basic Protein (MBP), which was processed and accumulated selectively in membranes. The induction of differentiation genes was associated with the activation of ERK1-2 and phosphorylation of the nuclear cAMP responsive element binding protein 1 (CREB). PKC mediates ROS-induced differentiation because PKC depletion or bis-indolyl-maleimide (BIM), a PKC inhibitor, reversed the induction of differentiation markers by H2O2. H2O2 and PMA increased the expression of membrane-bound NADPH oxidases, NOX3 and NOX5. Selective depletion of these proteins inhibited differentiation induced by PMA. Furthermore, NOX5 silencing down regulated NOX3 mRNA levels, suggesting that ROS produced by NOX5 up-regulate NOX3 expression. These data unravel an elaborate network of ROS-generating enzymes (NOX5 to NOX3) activated by PKC and necessary for differentiation of OLs. Furthermore, NOX3 and NOX5, as inducers of OL differentiation, represent novel targets for therapies of demyelinating diseases, including multiple sclerosis, associated with impairment of OL differentiation.

Keywords: NOX3; NOX5; differentiation; multiple sclerosis; oligodendrocyte; reactive oxygen species.


Figures

FIGURE 1
FIGURE 1
Dose-dependent effect of H2O2 on cell viability. Not differentiated (N.D.), growing in complete medium, and differentiated (PMA) MO3-13 cells were stimulated with increasing doses of H2O2 and cell viability was evaluated by cytofluorimetry after Propidium Iodide (PI) staining. The MO3-13 cells were differentiated in FBS-free DMEM supplemented with 100 nM of PMA for 4 days. The graphs show the mean ± SEM values relative to control of three independent experiments. p < 0.05, ∗∗p < 0.01 vs. Control; #p < 0.05 vs. Corresponding dose.
FIGURE 2
FIGURE 2
Phorbol-12-Myristate-13-Acetate and H2O2 induce MBP expression levels. (A) MBP protein levels in MO3-13 cells treated for 1 and 4 days with 100 nM PMA in medium without serum or with 200 μM H2O2. Immunoreactivity for MBP was evidenced by indirect immunofluorescence and flow cytometric analysis, using primary antibodies against MBP and CY3-conjugated anti rabbit IgG as secondary antibodies. 10,000 cells were counted for each sample. N.D. indicates Not Differentiated cells, growing in complete medium. The graph shows the mean ± SEM values of three independent experiments. The insert shows the histograms of a representative experiment; the red histogram denotes the sample treated with secondary antibodies alone. (B) Real-time-PCR analysis of MBP mRNA levels in MO3-13 cells treated for 1 and 4 days with 100 nM PMA in medium without serum or with 200 μM H2O2. N.D. indicates Not Differentiated cells, growing in complete medium. Expression values were normalized using glucose-6-phosphate-dehydrogenase mRNA (G6PD). The histogram shows means ± SEM values relative to control of three independent experiments. (C) Confocal images of MBP immunoreactivity of MO3-13 cells after 1 and 4 days of differentiation with 100nM PMA in medium without serum or with 200 μM H2O2. Cells were stained with the nuclear dye DAPI (blue) and with primary anti human MBP antibodies and CY3-conjugated anti rabbit IgG as secondary antibodies (red). Control (Ctr) was treated with secondary antibodies and DAPI alone. N.D. indicates Not Differentiated cells, growing in complete medium. The table under the images shows means ± SEM values obtained by the quantitative analysis of 25 cells for each sample. p < 0.05, ∗∗p < 0.01, ∗∗∗p < 0.001 vs. N.D.
FIGURE 3
FIGURE 3
Phorbol-12-Myristate-13-Acetate and H2O2 induce Olig-2 expression levels. (A) Western blotting analysis of Olig-2 levels in MO3-13 cells treated for 1 and 4 days with 100 nM PMA in medium without serum or with 200 μM H2O2. N.D. indicates Not Differentiated cells, growing in complete medium. The histogram shows the values (means ± SEM) relative to control obtained by densitometric analysis of Olig-2 normalized to α-Tubulin of three independent experiments. (B) Real-time-PCR analysis of Olig-2 m-RNA levels in MO3-13 cells treated for 1 and 4 days with 100 nM PMA in medium without serum or with 200 μM H2O2. N.D. indicates Not Differentiated cells, growing in complete medium. Expression values were normalized using glucose-6-phosphate-dehydrogenase mRNA (G6PD). The histogram shows means ± SEM values relative to control of three independent experiments. (C) Confocal images of Olig-2 immunoreactivity of MO3-13 cells after 1 and 4 days of differentiation with 100 nM PMA in medium without serum or with 200 μM H2O2. Cells were stained with the nuclear dye DAPI (blue) and with primary anti human Olig-2 antibodies followed by CY3-conjugated anti rabbit IgG as secondary antibodies. Control (Ctr) was treated with secondary antibodies and DAPI alone. N.D. indicates Not Differentiated cells, growing in complete medium. For each image are shown three panels: on the left Olig-2 (red); on the center nuclei (blue); on the right the merged image. The table under the images shows means ± SEM values obtained by the quantitative analysis of 25 cells for each sample. p < 0.05, ∗∗p < 0.01, ∗∗∗p < 0.001 vs. N.D.
FIGURE 4
FIGURE 4
Phorbol-12-Myristate-13-Acetate and H2O2 induce ERK1-2 and CREB phosphorylation levels. (A,B) Western blotting analysis of p-ERK1-2 (A) and p-CREB (B) levels in MO3-13 cells treated for 5 or 30 min with 100 nM PMA in medium without serum or with 200 μM H2O2. (C,D) Western blotting analysis of p-ERK1-2 (C) and p-CREB (D) levels in MO3-13 cells treated for 1 or 4 days with 100 nM PMA in medium without serum or with 200 μM H2O2. N.D. indicates Not Differentiated cells, growing in complete medium. The histograms show the values (means ± SEM) relative to control (N.D.) obtained by densitometric analysis of protein bands normalized to α-Tubulin of three independent experiments. p < 0.05, ∗∗p < 0.01, ∗∗∗p < 0.001 vs. N.D.
FIGURE 5
FIGURE 5
Protein kinase C mediates H2O2 effects. (A) Western blotting analysis of P-PKCα expression levels in MO3-13 cells incubated for 18 h in medium containing 0.2% FBS and then stimulated with H2O2 (200 μM) or PMA (100 nM) for 30 min. The histogram shows the values (means ± SEM) relative to control obtained by densitometric analysis of protein bands normalized to α-Tubulin of three independent experiments. Under the histogram is shown a representative experiment.p < 0.05 vs. control (Ctr). (B–E) PKC depletion was obtained by treatment of MO3-13 cells for 24 h with 1 μM PMA in medium containing 0.2% FBS. Then cells were stimulated for 30 min with H2O2 (200 μM) before Western blotting analysis of p-PKCα (B), P-ERK1-2 (C) and P-CREB (D) expression levels. n.d., not detectable. The histograms show the values (means ± SEM) relative to control obtained by densitometric analysis of protein bands normalized to α-Tubulin of three independent experiments. (E) A representative experiment is shown. p < 0.05, ∗∗p < 0.01 vs. control (Ctr); #p < 0.05, ##p < 0.01 vs. H2O2. (F–I) MO3-13 cells were transfected by electroporation with siRNA to PKCα or control, scrambled siRNA (Scrambled) as described in Materials and Methods. 24 h after transfection, cells were stimulated with H2O2 (200 μM) for 30 min in medium containing 0.2% FBS and total proteins were extracted and subjected to immunoblot analysis of p-PKCα (F), P-ERK1-2 (G) and P-CREB (H) expression levels. The histograms show the values (means ± SEM) relative to control obtained by densitometric analysis of protein bands normalized to α-Tubulin of three independent experiments. (I) A representative experiment is shown. p < 0.05, ∗∗p < 0.01 vs. Scrambled (Scr.); #p < 0.05, ##p < 0.001 vs. Scrambled (Scr.) + H2O2. (J–M) Western blotting analysis of p-ERK1-2 (J) p-CREB (K), and Olig-2 (L) expression levels in MO3-13 cells stimulated with H2O2 (200 μM) or PMA (100 nM) for 4 days in the presence or absence of BIM (100 μM). N.D. indicates Not Differentiated cells, growing in complete medium. The histograms show the values (means ± SEM) relative to control obtained by densitometric analysis of protein bands normalized to α-Tubulin of three independent experiments. (M) A representative experiment is shown. (N) Confocal images of MBP immunoreactivity of MO3-13 cells after 4 days of treatment with 100 nM PMA in medium without serum or with 200 μM H2O2 in the presence or absence of BIM (100 μM). Cells were stained with nuclear dye DAPI and with primary anti human MBP antibodies and CY3-conjugated anti rabbit IgG as secondary antibodies. N.D. indicates Not Differentiated cells, growing in complete medium. The table under the images shows means ± SEM values obtained by the quantitative analysis of 25 cells for each sample. p < 0.05, ∗∗p < 0.01, ∗∗∗p < 0.001 vs. N.D.; #p < 0.05, ##p < 0.01, ###p < 0.001 vs. PMA; § p < 0.05, §§ p < 0.01 vs. H2O2.
FIGURE 6
FIGURE 6
Phorbol-12-Myristate-13-Acetate pro-differentiative effects rely on NOX dependent ROS. (A) MO3-13 cells were grown in complete medium, preincubated with antioxidants (200 μM NAC or 400 μg/ml SOD1), incubated with 10 μM of the ROS sensitive probe DCHF-DA and then stimulated with PMA 100 nM in absence of serum. ROS levels were measured by fluorometric analysis at various times.The graphs show the mean ±SEM values relative to control of three independent experiments. p < 0.05 vs. corresponding time points of not stimulated samples (Ctr) #p < 0.05, ##p < 001 vs. corresponding time points of PMA stimulated samples. (B) MO3-13 cells were incubated for 18 h in medium containing 0.2% FBS. For the DHE staining the cells were preincubated for 30 min with SOD1 (400 ng/ml) and stimulated for 30 min with PMA (100 nM). For MitoSOX staining cells were incubated for 30 min with PMA (100 nM). Superoxide levels were measured by flow cytometry. The graphs show the mean ±SEM values relative to control (Ctr) of three independent experiments. The inserts show the hystograms of representative experiments; the red histogram denotes the sample treated with secondary antibodies alone. p < 0.05 vs. control; #p < 0.05 vs. PMA. (C) MO3-13 cells were grown in complete medium, pre-incubated in the absence and presence of 200 μM NAC or 400 μg/ml SOD1 for 30 min and stimulated for 4 days with 100 nM PMA in the absence of serum before being collected and analyzed by Western Blotting. N.D. indicates Not Differentiated cells, growing in complete medium. The histogram shows the values (means ± SEM) relative to control obtained by densitometric analysis of Olig-2 normalized to α-tubulin compared to undifferentiated control of three independent experiments. p < 0.02 vs. N.D.; #p < 0.05 vs. PMA (D–G) Western blotting analysis of p-ERK1-2 (D), p-CREB (E) and Olig-2 (F) expression levels in MO3-13 cells stimulated with PMA (100 nM) for 4 days in serum-free medium in the presence or absence of Apocynin (50 μM). N.D. indicates Not Differentiated cells, growing in complete medium. The histograms shows the values (means ± SEM) relative to control obtained by densitometric analysis of protein bands normalized to α-Tubulin compared to undifferentiated control of three independent experiments. p < 0.05 vs. N.D.; #p < 0.05 vs. PMA. (G) A representative experiment is shown.
FIGURE 7
FIGURE 7
Phorbol-12-Myristate-13-Acetate and H2O2 induce NOX3 and NOX5 m-RNA levels in MO3-13 cells. Real-time-PCR analysis of NOX3 (A) and NOX5 (B) mRNA levels in MO3-13 cells treated for 1 and 4 days with 100 nM PMA in medium without serum or with 200 μM H2O2. N.D. indicates Not Differentiated cells, growing in complete medium. Expression values were normalized using glucose-6-phosphate-dehydrogenase mRNA (G6PD). The histograms show means ± SEM values relative to control in eight independent experiments. p < 0.05, ∗∗p < 0.01, ∗∗∗p < 0.001 vs. N.D.
FIGURE 8
FIGURE 8
NOX3 or NOX5 silencing inhibits PMA-induced differentiation. MO3-13 cells were transfected by electroporation with siRNA to NOX3 (siRNA NOX3) or NOX5 (siRNA NOX5) or control, scrambled siRNA (Scrambled) as described in Section “Materials and Methods.” Twenty four hours after transfection, total proteins were extracted and subjected to immunoblot analysis of NOX3 (A) and NOX5 (B). The histograms show the mean ±SEM values relative to control scrambled obtained by densitometric analysis of proteins bands normalized for α-Tubulin of three independent experiments. A representative experiments is shown on the left of each histogram. p < 0.05 vs. Scrambled. (C,D) mRNA from cells treated as in (A) was extracted and NOX3 (C) or NOX5 (D) mRNA levels were analyzed by Real-time-PCR as described in Section “Materials and Methods.” The graphs show the mean ± SEM values relative to scrambled control of three independent experiments. (E,F) mRNA from cells treated as in (A) was extracted and MBP (E) or Olig-2 (F) mRNA levels were analyzed by Real-time-PCR as described in Section “Materials and Methods.” The graphs show the mean ±/ SEM values relative to scrambled control of three independent experiments. p < 0.05, ∗∗p < 0.01, ∗∗∗p < 0.001 vs. Scrambled; #p < 0.05, ##p < 0.01, vs. Scrambled + PMA.
FIGURE 9
FIGURE 9
Scheme of PKC/ROS signaling pathways involved in OLs differentiation. ROS produced by NOX3/5 amplify PMA activated PKC, ERK1-2 and CREB signaling increasing the expression of the differentiation markers MBP and Olig-2. In the figure is also depicted the possible role of NOX3/5 derived ROS in the stabilization of membrane receptor(s) leading to OLs differentiation.

References

    1. Afshari F. S., Chu A. K., Sato-Bigbee C. (2001). Effect of cyclic AMP on the expression of myelin basic protein species and myelin proteolipid protein in committed oligodendrocytes: differential involvement of the transcription factor CREB. J. Neurosci. Res. 66 37–45. 10.1002/jnr.1195 - DOI - PubMed
    1. Bánfi B., Malgrange B., Knisz J., Steger K., Dubois-Dauphin M., Krause K. H. (2004). NOX3, a superoxide-generating NADPH oxidase of the inner ear. J. Biol. Chem. 279 46065–46072. 10.1074/jbc.M403046200 - DOI - PubMed
    1. Bánfi B., Molnár G., Maturana A., Steger K., Hegedûs B., Demaurex N., et al. (2001). A Ca(2+)-activated NADPH oxidase in testis, spleen, and lymph nodes. J. Biol. Chem. 276 37594–37601. 10.1074/jbc.M103034200 - DOI - PubMed
    1. Barbarese E., Barry C., Chou C. H., Goldstein D. J., Nakos G. A., Hyde-DeRuyscher R., et al. (1988). Expression and localization of myelin basic protein in oligodendrocytes and transfected fibroblasts. J. Neurochem. 51 1737–1745. 10.1002/jnr.22570 - DOI - PubMed
    1. Baroni S. S., Santillo M., Bevilacqua F., Luchetti M., Spadoni T., Mancini M., et al. (2006). Stimulatory autoantibodies to the PDGF receptor in systemic sclerosis. New Eng. J. Med. 354 2667–2676. 10.1056/NEJMoa052955 - DOI - PubMed