. 2016:2016:3089584.
doi: 10.1155/2016/3089584. Epub 2016 May 26.

Identification and Validation of Reference Genes for qRT-PCR Studies of Gene Expression in Dioscorea opposita

Affiliations

Identification and Validation of Reference Genes for qRT-PCR Studies of Gene Expression in Dioscorea opposita

Xiting Zhao et al. Biomed Res Int. 2016.

Abstract

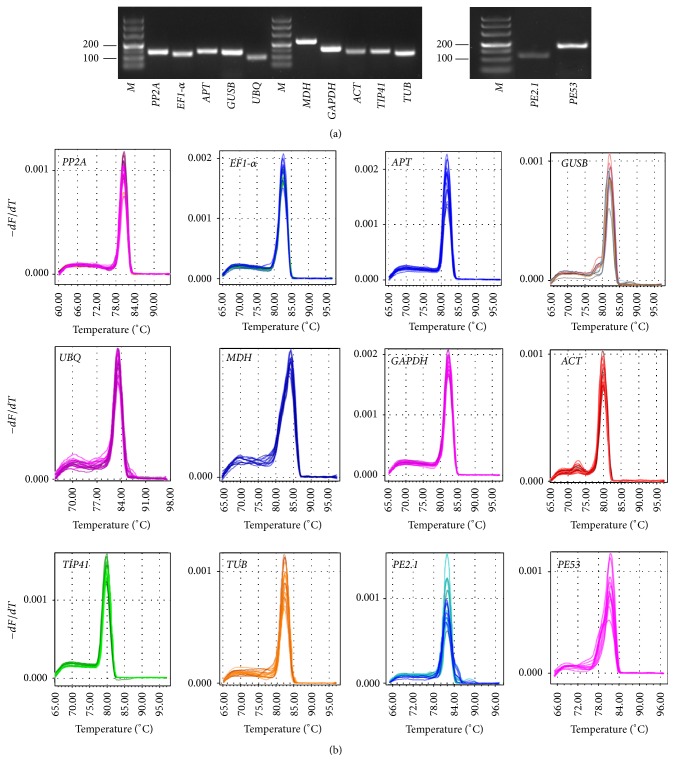
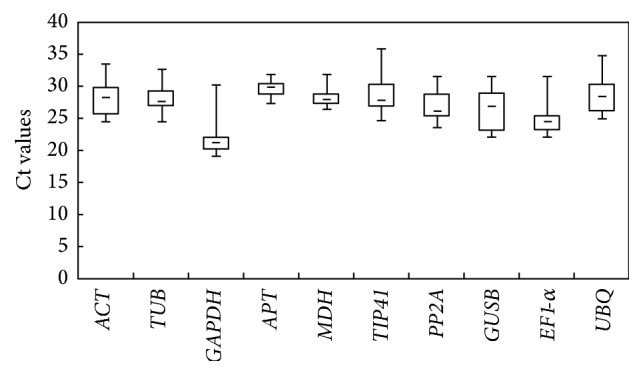
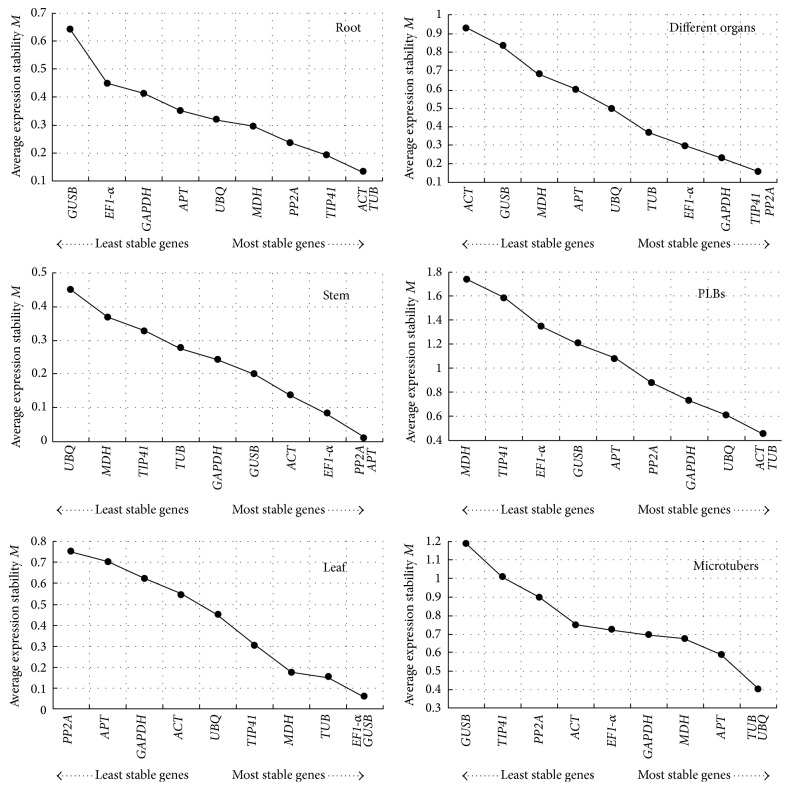
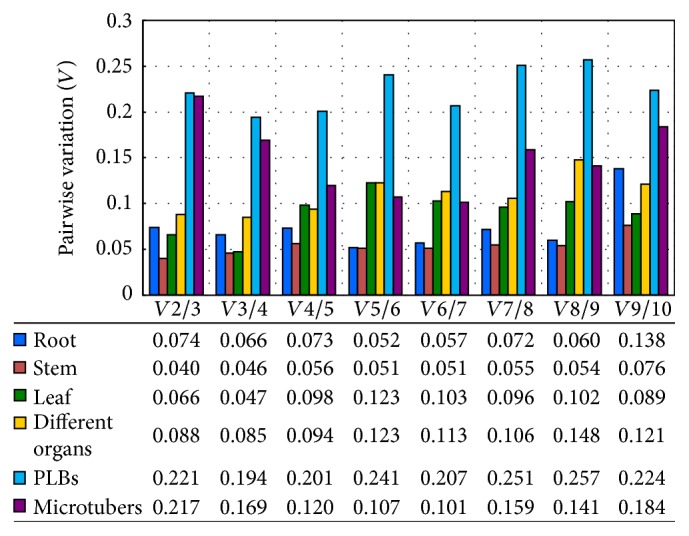
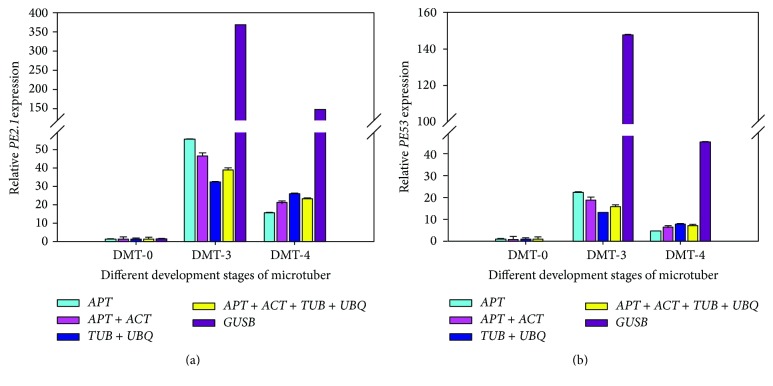
Quantitative real-time polymerase chain reaction (qRT-PCR) is one of the most common methods for gene expression studies. Data normalization based on reference genes is essential for obtaining reliable results for qRT-PCR assays. This study evaluated potential reference genes of Chinese yam (Dioscorea opposita Thunb.), which is an important tuber crop and medicinal plant in East Asia. The expression of ten candidate reference genes across 20 samples from different organs and development stages was assessed. We identified the most stable genes for qRT-PCR studies using combined samples from different organs. Our results also suggest that different suitable reference genes or combinations of reference genes for normalization should be applied according to different organs and developmental stages. To validate the suitability of the reference genes, we evaluated the relative expression of PE2.1 and PE53, which are two genes that may be associated with microtuber formation. Our results provide the foundation for reference gene(s) selection in D. opposita and will contribute toward more accurate gene analysis studies of the genus Dioscorea.


Figures

Figure 1
Figure 1
Specificity of qRT-PCR amplicons. (a) Agarose gel electrophoresis showing amplification of a single product of the expected size for each candidate gene and two target genes for reference gene validation. M represents DL2,000 DNA marker. (b) Dissociation curves with single peaks generated for all amplicons.
Figure 2
Figure 2
RNA transcription levels of reference genes tested, presented as Ct mean value in the different samples. Boxes indicate the 25th/75th percentiles, lines across the boxes depict the medians, squares represent the means, and whiskers indicate the ranges for all samples.
Figure 3
Figure 3
Gene expression stability and rankings of ten candidate reference genes, as calculated by geNorm software. The average expression stability (M) was calculated following stepwise exclusion of the least stable gene across all the samples within an experimental set. The lowest M value indicates the most stable gene, while the highest value represents the most highly variable gene.
Figure 4
Figure 4
Pairwise variation (V) analysis of the candidate reference genes. The pairwise variation (Vn/n + 1) was analyzed between two sequential normalization factors NFn and NFn + 1 that contained an increasing number of reference genes using geNorm software. Vn/n + 1 < 0.15 indicates that the inclusion of an additional reference gene is not required.
Figure 5
Figure 5
Relative expression levels of PE2.1 (a) and PE53 (b) during three different development stages of microtuber formation, normalized by different combinations of reference genes, as indicated. APT was found to be one of the most stable genes by both geNorm and NormFinder. The combination of TUB and UBQ was the optimal combination as selected by geNorm. The combination of APT and ACT was found to be optimal in the NormFinder analysis. The four most stable reference genes were suggested by both analyses. Standard error bars are indicated.

References

    1. Bustin S. A., Benes V., Garson J. A., et al. The MIQE guidelines: minimum information for publication of quantitative real-time PCR experiments. Clinical Chemistry. 2009;55(4):611–622. doi: 10.1373/clinchem.2008.112797. - DOI - PubMed
    1. Artico S., Nardeli S. M., Brilhante O., Grossi-de-Sa M. F., Alves-Ferreira M. Identification and evaluation of new reference genes in Gossypium hirsutum for accurate normalization of real-time quantitative RT-PCR data. BMC Plant Biology. 2010;10, article 49 doi: 10.1186/1471-2229-10-49. - DOI - PMC - PubMed
    1. Bustin S. A. Quantification of mRNA using real-time reverse transcription PCR (RT-PCR): trends and problems. Journal of Molecular Endocrinology. 2002;29(1):23–39. doi: 10.1677/jme.0.0290023. - DOI - PubMed
    1. Wong M. L., Medrano J. F. Real-time PCR for mRNA quantitation. BioTechniques. 2005;39(1):75–85. doi: 10.2144/05391RV01. - DOI - PubMed
    1. Bustin S. A., Dorudi S. Molecular assessment of tumour stage and disease recurrence using PCR- based assays. Molecular Medicine Today. 1998;4(9):389–396. doi: 10.1016/s1357-4310(98)01324-0. - DOI - PubMed

MeSH terms

LinkOut - more resources