Review
. 2016 Jul 13;116(13):7642-72.
doi: 10.1021/acs.chemrev.5b00736. Epub 2016 Jun 17.

Protons and Hydroxide Ions in Aqueous Systems

Affiliations
Review

Protons and Hydroxide Ions in Aqueous Systems

Noam Agmon et al. Chem Rev. .

Abstract

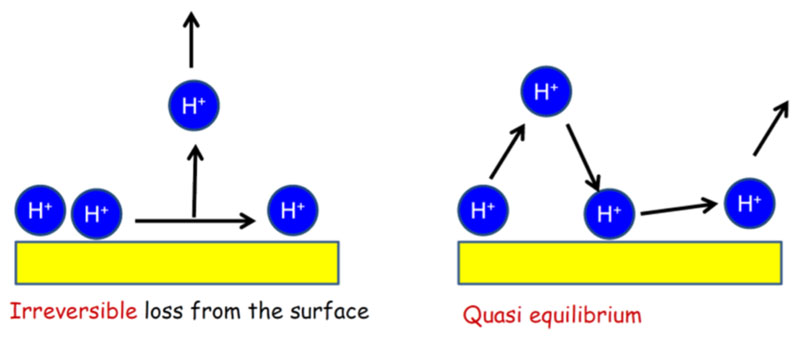
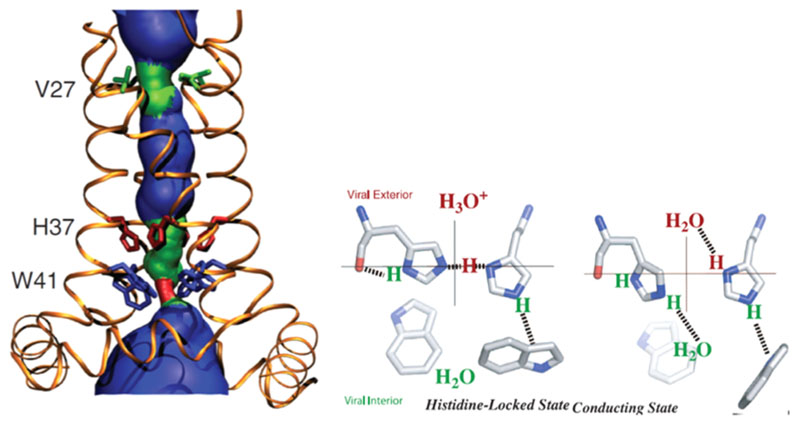
Understanding the structure and dynamics of water's constituent ions, proton and hydroxide, has been a subject of numerous experimental and theoretical studies over the last century. Besides their obvious importance in acid-base chemistry, these ions play an important role in numerous applications ranging from enzyme catalysis to environmental chemistry. Despite a long history of research, many fundamental issues regarding their properties continue to be an active area of research. Here, we provide a review of the experimental and theoretical advances made in the last several decades in understanding the structure, dynamics, and transport of the proton and hydroxide ions in different aqueous environments, ranging from water clusters to the bulk liquid and its interfaces with hydrophobic surfaces. The propensity of these ions to accumulate at hydrophobic surfaces has been a subject of intense debate, and we highlight the open issues and challenges in this area. Biological applications reviewed include proton transport along the hydration layer of various membranes and through channel proteins, problems that are at the core of cellular bioenergetics.


Conflict of interest statement

Notes

The authors declare no competing financial interest.

Figures

Figure 1
Figure 1
Minimum-energy structures of small protonated water clusters, calculated at the MP2/aug-cc-pVDZ level of theory and possibly detected in the low-temperature IR spectra of ref . Structure A is the Zundel cation, C is the Eigen cation, D is an Eigen cation with one water molecule in its second solvation shell, and E is a Zundel cation with a complete first solvation shell. F and G are ring structures harboring a Zundel ion. Reprinted from ref with permission. Copyright 2005 American Association for the Advancement of Science.
Figure 2
Figure 2
Ar-predissociation IR spectrum of the H+(H2O)4 cluster at 50 K (black line), compared with simulated spectra (AIMD dipole autocorrelation) for the branched E isomer (blue) and a linear isomer with a Z core (red). The labels a, s, and b (in black) on the experimental spectrum mark the antisymmetric and symmetric stretching and the bending band (respectively) of water molecules that do not donate any HB. The computed stretching bands of hydrogen-bonded OH moieties are denoted (in color) by E or Z (the isomer) with a numerical subscript (0, 1, or 2) for the solvation shell around the excess proton; see Figure 3 below for the detailed notation. Z2,a and Z2,s are the antisymmetric and symmetric stretching modes of the dangling hydrogens in the second shell, while Z1a and Z1b refer to the bonded and dangling OH in the first shell of the Z cation. Adapted from ref . Copyright 2014 American Chemical Society.
Figure 3
Figure 3
Schematic depiction of the different proton classes of the E and linear Z cations of the protonated water tetramer whose IR spectra are shown in Figure 2
Figure 4
Figure 4
Six motifs illustrating the amphiphilic character of the OH ion: (a) 3A0DS, (b) 4A0DS, (c) 4A0DB, (d) 4A1DB, (e) 5A0DS, and (f) 5A1DB. The number in front of A refers to the number of HBs that the hydroxide accepts, while the number in front of D refers to whether it donates a HB or not. Finally, the B and the S describe whether it is a buried or a surface state. Reproduced from ref with permission. Copyright 2015 American Chemical Society
Figure 5
Figure 5
Computed linear response theory IR spectra of hydroxide clusters shown earlier (a, left) between 1500 and 3200 cm−1 and (b, right) between 3400 and 3800 cm −1. Color codes adopted here are the following: 3A0DS (black, labeled 3AS), 4A0DB (red, labeled 4AC), 4A0DS (dashed violet, labeled 4AS), 4A1DB (dotted blue), and finally 5A1DB (green). The spectra for the neutral water cluster are shown with black dashed lines. For clarity, the clusters contributing to the band between 1600 and 2500 cm−1 are explicitly labeled as 3AS (3A0DS), 4AC (4A0DB), and 4AS (4A0DS). Reproduced from ref with permission. Copyright 2015 American Chemical Society
Figure 6
Figure 6
Schematic depiction of the E–Z–E mechanism. Left: Oxygen 0 is the hydronium, and oxygen 1 is in its first solvation shell, accepting a HB (A1) from the second solvation shell. Center: The Zundel intermediate. Right: A new hydronium centered on oxygen 1. Reproduced from ref by permission. Copyright 2008 American Chemical Society
Figure 7
Figure 7
O*−H radial distribution functions of the H9O4 + (dotted line) and H5O2 + (solid line) structures of H+ in liquid water. The O* atoms correspond to the oxygen atoms hosting the proton. The dashed line gives the O–H radial distribution functions for pure water. Reproduced from ref with permission. Copyright 1995 American Institute of Physics
Figure 8
Figure 8
Snapshots of an example proton-transfer event from the CPMD simulations. O* is blue, other oxygen atoms are red, hydrogen atoms are white, and HBs are purple. Panels a-d show how the PT step involves an almost simultaneous decrease and increase of the coordination number of the proton accepting and proton donating water molecules, respectively. Reproduced from ref with permission. Copyright 2009 American Physical Society
Figure 9
Figure 9
Schematics of the special pair dance around a central hydronium ion (magenta-colored oxygen atom). The special partner, depicted as a triply coordinated water ligand, is interchanged following HB cleavage and formation events. Reproduced from ref with permission. Copyright 2008 American Chemical Society
Figure 10
Figure 10
Comparison of the effective ionic extinctions of HCl in H2O and DCl in D2O showing a slight red shift of the high-frequency resonance (from 340 to 320 cm −1, arrows) that is ascribed to the SPD. Reproduced from ref with permission. Copyright 2015 Royal Society of Chemistry
Figure 11
Figure 11
Panels A and B show two directed six-membered rings obtained in liquid water. The ring in A is composed exclusively of water molecules that accept and donate a HB (DA waters), while that in B contains one water that donates two HBs (DD) and another that accepts two HBs (AA). The directional correlations within rings change, depending on the size and number of DD-AA pairs within the ring and create the architecture for water wires. The number of DD-AA pairs in the rings is quantified with the order parameter S1. Panel C shows the distribution of the S1 showing that most rings have one DD-AA pair. Reproduced from ref with permission. Copyright 2013 National Academy of Sciences
Figure 12
Figure 12
Burst and rest behavior of the proton is shown for one trajectory. The y axis depicts the distance that the proton jumps with respect to a reference starting point at the beginning of the trajectory. The motion of the proton goes through periods of bursts (B), where it can jump rather long distances due to correlated proton hopping, followed by resting periods (R). Reproduced from ref with permission. Copyright 2013 National Academy of Sciences
Figure 13
Figure 13
Coupling between the average of two consecutive PT coordinates on the x-axis and the sum of the two HBs (the O–O distances) along which the PT events occur. The double PT is coupled to the compression of the proton wire. Reproduced from ref with permission. Copyright 2013 National Academy of Sciences
Figure 14
Figure 14
Fourth water molecule (4WM) influence on PT burst dynamics. Panel a defines the distance, d, and angle, θ, between the 4WM hydrogen atom, the hydronium oxygen atom, and the normal to the plane of the H3O+ hydrogen atoms. Panel b shows the probability distribution in the (d,θ) plane during burst periods, while panel c shows it during rest periods. Reproduced from ref with permission. Copyright 2015 Institute of Physics
Figure 15
Figure 15
Potential of mean force along the PT coordinate for three conformations of the inversion position of two water molecules between which the protons move. The snapshots on top of the free energy profiles are representative of the typical configurations used to generate these profiles. In all cases, we see that there is a tendency for the proton to be most localized on the left water, although the barriers associated with PT are on the order of k B T. In panel a the lone-pairs of both oxygen atoms face upward, while in panel b left is up-inverted and right is down-inverted. This leads to quite a drastic change in the activation barrier for PT. On the other hand, in panel c the left water is down-inverted while the right is up-inverted. This introduces some additional roughness in the profile that is absent in both panels a and b. Reprinted from ref with permission. Copyright 2014 Elsevier
Figure 16
Figure 16
Representative resting and active states of OH in bulk water, OH(aq), within the dynamical hypercoordination mechanism (ref 4). The resting state (top) is the majority complex, with four HBs accepted by O* in an essentially square-planar arrangement. The active state (bottom) is a short-lived transient complex with three HBs accepted by O* and an additional HB donated by H’ in a locally tetrahedral arrangement. O*, in yellow, is the oxygen atom identified as the OH ion and H’ is the hydrogen atom attached to it. Electron density is depicted by the purple blobs. Note the ring of negative charge around O*, resembling the crescent of negative charge connecting the two lone pairs of a water molecule. Reproduced from ref with permission. Copyright 2002 Nature Publishing Group
Figure 17
Figure 17
Canonical (Helmholtz) free energy profile at 300 K along the proton transfer coordinate δ of the OH and H+ systems (left and right panels, respectively) in bulk water (top) and the gas phase (bottom). Dashed lines depict the classical canonical ensemble, while solid lines are from the quantum simulations. Note that the thermal energy is kBT ≈ 0.59 kcal/mol at 300 K Reproduced from ref with permission. Copyright 2010 American Chemical Society
Figure 18
Figure 18
Histogram of the number of constituents for the cluster containing the excess proton for three quantum simulations (red, blue, and purple dashed lines) and one classical simulation (black line). Here, a cluster corresponds to a motif built using a criterion based on the PT coordinate that connects species with high coordination numbers (see ref for details) and that identifies the excess proton as localized on a cluster of n water molecules. Quantum fluctuations of the proton lead to situations where it is delocalized over more than two water molecules, most notably n = 3 and 4. Reproduced from ref with permission. Copyright 2014 American Chemical Society
Figure 19
Figure 19
FFT-IR spectra of water (blue line) and 4 M HCl (red line) with assignments of the different spectral regions to different structures of the solvated proton (cartoons). The vibrational modes shaded in green involve the excess proton (purple color), whereas the vibrations in bulk/flanking water molecules are shaded in red. Details of the assignments are discussed in the text. Reproduced from ref with permission. Copyright 2015 American Association for the Advancement of Science
Figure 20
Figure 20
Left panel: Infrared spectrum of a 5 M solution of HCl:DCl in HDO:D2O, with a H:D ratio of 1:20. The bars indicate the frequency regions of the O–H-stretching modes of the E (I) and Z/E (II) structures. Right panel: Absorption change as a function of delay after resonant excitation (at 2935 cm−1) of the proton O–H stretch vibrations of the E structure. The absorption change is shown for two probing frequencies, one resonant with the E (I) structure and one resonant with the Z and E (II) structures. The time constants are 120 fs and 0.7 ps for the dotted curve and 130 fs and 0.8 ps for the solid curve. From ref with permission. Copyright 2006 American Physical Society
Figure 21
Figure 21
Shape and time evolution of the stretch–bend cross-peaks following decomposition (Reproduced from ref . Copyright 2015 American Association for the Advancement of Science). (A) Presentation of the three dominant components for 2DIR spectra of 4 M HCl for waiting times (time elapsed after excitation) of τ2 = 50 and 600 fs. Grid lines illustrate the Zundel (red) and water (blue) peak frequencies. (B) Projections of the stretch–bend cross peaks onto one frequency axis: ω1 for stretch (υ) and ω3 for bend (δ). These bleach signals are inverted to present a positive spectrum. (C) Evolution of the peak frequency of the Zundel stretch–bend cross peak in ω1 with waiting time. The blue dotted line indicates the asymptotic value
Figure 22
Figure 22
Forster cycle of 2-naphthol. The photoacid in its ground state (bottom left) is photoexcited (usually to S2 and then relaxing very fast to S1), ejects a proton to water (reversibly) to produce the conjugated photobase (upper right), and then decays radiatively (wiggly arrow), and also nonradiatively (not indicated), to form the ground-state RO base. The latter picks up a proton from solution and reprotonates (irreversibly) to regenerate the ground-state photoacid. Reproduced from ref with permission. Copyright 2005 American Chemical Society
Figure 23
Figure 23
First reported power-law kinetics in ESPT to water, from 8-hydroxypyrene-1,3,6-trisulfonate (HPTS) that was irradiated with a picosecond laser. The time-resolved fluorescence signal from the undissociated photoacid, detected by a streak-camera apparatus and corrected for its radiative lifetime, is depicted by dots. Irreversible proton dissociation would give rise to a single exponential decay, which is not the observed behavior. The reversibility of the reaction leads, in conventional chemical kinetics, to biexponential decay (upper dashed line) that does not fit the data at long times. The solution of the time-dependent Smoluchowski equation with reversible boundary conditions (convoluted with the instrument response function, lower dashed line) is depicted by the full line that goes through the data points. Its (analytically derived) asymptotic power-law behavior is the straight dotted line. Reproduced from ref with permission. Copyright 1988 American Institute of Physics
Figure 24
Figure 24
Simulated (MS-EVB3) time evolution of the probability of the excess proton to reside on the oxygen atom (O*) to which it was initially bound (full lines), depicted on a log-log scale. A biexponential (dashed magenta line) clearly does not fit the data. A model with a fixed (small, D0, or large, D) diffusion constant also misses the data (dashed red lines). A model in which the diffusion constant increases (from D0 to D) as a function of r is in quantitative agreement with these simulations. Reproduced from ref with permission. Copyright 2010 American Chemical Society
Figure 25
Figure 25
Response of the proton/deuteron vibrations as a function of the pump-probe delay for solutions of 10 mM HPTS and 1, 2, and 4 M acetate in (a) H2O and (b) D2O. In the insets, the response measured in the first 20 ps is shown, illustrating the highly nonexponential character of the PT reaction. The solid lines are calculated using a conduction model in which the rate of transfer decreases by a constant factor for every additional water molecule in the short-living hydrogen-bonded water wire connecting the acid and the base. Reproduced from ref with permission. Copyright 2008 American Chemical Society
Figure 26
Figure 26
Time-resolved infrared signal from excited HPTS in D2O at 5 °C, at different acetate concentrations (symbols). Full lines are fits to the extended Smoluchowski model in which k(r) has a Gaussian-like distance dependence. Reproduced from ref with permission. Copyright 2009 American Chemical Society
Figure 27
Figure 27
ζ-potential of oil droplets and air and N2 bubbles as a function of pH. pH control is achieved by adding either HCl or NaOH. The pH of the potential of zero charge is between 2.5 and 4.5
Figure 28
Figure 28
pH-dependent SHG and SFG data for various interfaces: (A) pH-dependent nonresonant SHG intensity measured from the planar hexadecane/water interface (Reproduced from ref with permission. Copyright 2015 Royal Society of Chemistry.); (B) SFG spectra obtained from the CCl4/water interface (Reproduced from ref with permission. Copyright 2001 American Association for the Advancement of Science.); (C) SFG spectra as a function of pH from the OTS/water interface [for pH values of 11 (squares), 7.8 (triangles), 6 (stars) and 2.3 (crosses)] (Reproduced from ref with permission. Copyright 2009 Elsevier.); and (D) SFG scattering intensities from hexadecane nanodroplets in water as a function of pH (Reproduced from ref with permission. Copyright 2014 the National Academy of Sciences)
Figure 29
Figure 29
XPS spectra of 0.5 M LiI aqueous solutions in the indicated energy range. Clearly, as illustrated in the inset, I surface propensity is enhanced in non-neutral solutions. Reproduced from ref with permission. Copyright 2011 American Chemical Society
Figure 30
Figure 30
Potentials of mean force calculated using an MS-EVB model of the proton with and without polarizability. Clearly accounting for polarizability creates a proton whose adsorption at the air/water interface is dramatically less favored. Reproduced from ref with permission. Copyright 2012 American Chemical Society
Figure 31
Figure 31
Proton transfer to a lipid-anchored pH-sensitive dye. In equilibrium, the residence time of a proton on titratable residues can be calculated. If it was a determinant of proton mobility, the surface diffusion constants of protons on different lipids should differ by orders of magnitude
Figure 32
Figure 32
Measurements of D p. (Left) A horizontal planar lipid bilayer is placed on top of an inverse fluorescent microscope. A UV-flash releases the protons within the red area from a membrane-bound caged compound. (Upper right) Proton arrival at a distant site (blue) is indicated by the drop in fluorescence intensity (blue line) of a lipid-anchored pH-dependent dye (excited in the green area). Photorelease of fluorescein from a caged compound in the red area and its fluorimetric detection in the blue area yielded a much slower diffusion constant (green line), indicating that fluorescein diffusion occurred via the aqueous bulk (Right upper panel taken from ref with permission. Copyright 2003 Cell Press). Proton shuttling by buffer molecules would have yielded equally slow kinetics
Figure 33
Figure 33
Gibbs activation energy ΔG for proton surface-to-bulk release depends on whether the detached proton is irreversibly lost from the surface (left panel) or allowed to return to the surface (right panel). The term R1 accounts for the two models in the equation for proton surface diffusion: σ(x,t) = σo + A/(4πDt) exp(-x 2/(4Dt)R1 where σ(x,t), σ 0, A, and D are the are the proton surface density as a function of both time t and the distance x from the proton source, the initial proton surface density, a constant, and the proton surface diffusion coefficient, respectively. R1 = exp(-tk off) for irreversible proton loss and R1 = (1 + [(πDt)−1/2/L0]a)−1 in quasi-equilibrium, where L0 and a are the distance over which surface and bulk protons are coupled and the dimensionality of the space orthogonal to the membrane surface where the detached protons diffuse (should be equal to 1), respectively.
Figure 34
Figure 34
Observation of interfacial proton migration along the decane/water interface. (A) Protons were microinjected via a glass pipet and their arrival at a distant spot was indicated by the pH response of sparsely located amphiphilic dye molecules. (B) If the proton was traveling 100 μm by diffusion via bulk, proton microinjection to the surface should have decreased the pH from 6.3 to 5.3 in the buffer volume (V =2 nL) occupying the half-sphere beneath the water/decane interface. Taking into account the buffer capacity of 0.06 mM, this would have required 0.06 mM × 2 nL = 1.2 × 10⁻¹³ mole of protons. (C) Since only 2 × 10⁻¹⁶ mole of protons was injected, the protons must have moved within a thin layer (V =5 pL) adjacent to the interface to elicit the recorded pH drop 100 μm away from the source
Figure 35
Figure 35
One of the proton pathways in cytochrome c oxidase is wired via an acidic residue (Glu101) to the membrane surface. The proton influx H+ M via the membrane surface exceeds several times the proton transfer H+ D of the detergent-solubilized cytochrome c oxidase; serCuA, heme a, heme a3, and CuB are redox-active cofactors, and residue Lys362 (hydrogen bonded via a water molecule to SerI299) is a key element of the proton pathway. Reproduced from ref with permission. Copyright 2010 National Academy of Sciences
Figure 36
Figure 36
Homotetrameric proton channel formed by the M2 protein from influenza A. His37 mediates the shuttling of protons across a central barrier between the N- and C-terminal aqueous pore regions. Two of the four histidines and tryptophans are shown. Upon PT to the inter-residue HB, the transition from the locked to the open conformation takes place.

References

    1. Kreuer KD. Proton Conductivity: Materials and Applications. Chem Mater. 1996;8:610–641.
    1. Cukierman S. Et Tu, Grotthuss! And Other Unfinished Stories. Biochim Biophys Acta Bioenerg. 2006;1757:876–885. - PubMed
    1. Wraight CA. Chance and Design - Proton Transfer in Water, Channels and Bioenergetic Proteins. Biochim Biophys Acta Bioenerg. 2006;1757:886–912. - PubMed
    1. Marx D, Chandra A, Tuckerman ME. Aqueous Basic Solutions: Hydroxide Solvation, Structural Diffusion, and Comparison to the Hydrated Proton. Chem Rev. 2010;110:2174–2216. - PubMed
    1. Knight C, Voth GA. The Curious Case of the Hydrated Proton. Acc Chem Res. 2012;45:101–109. - PubMed

Publication types

LinkOut - more resources