

Comparing Characteristics of Sporadic and Outbreak-Associated Foodborne Illnesses, United States, 2004-2011
- PMID: 27314510
- PMCID: PMC4918141
- DOI: 10.3201/eid2207.150833
Comparing Characteristics of Sporadic and Outbreak-Associated Foodborne Illnesses, United States, 2004-2011
Abstract
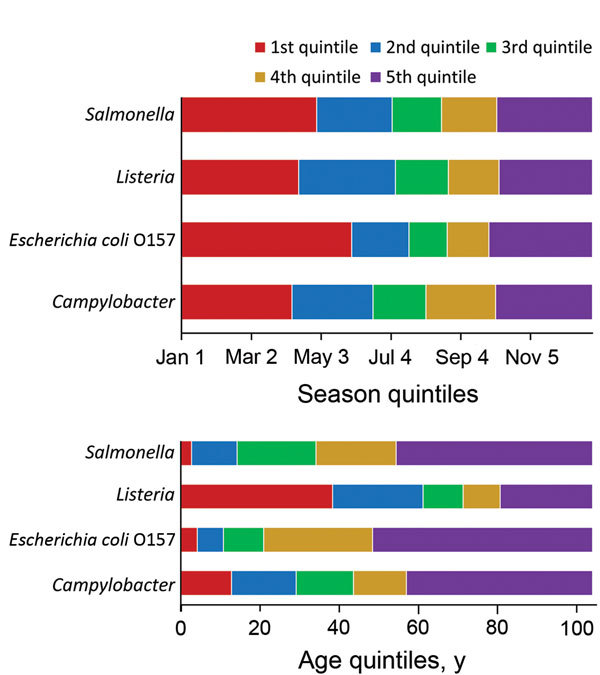
Outbreak data have been used to estimate the proportion of illnesses attributable to different foods. Applying outbreak-based attribution estimates to nonoutbreak foodborne illnesses requires an assumption of similar exposure pathways for outbreak and sporadic illnesses. This assumption cannot be tested, but other comparisons can assess its veracity. Our study compares demographic, clinical, temporal, and geographic characteristics of outbreak and sporadic illnesses from Campylobacter, Escherichia coli O157, Listeria, and Salmonella bacteria ascertained by the Foodborne Diseases Active Surveillance Network (FoodNet). Differences among FoodNet sites in outbreak and sporadic illnesses might reflect differences in surveillance practices. For Campylobacter, Listeria, and Escherichia coli O157, outbreak and sporadic illnesses are similar for severity, sex, and age. For Salmonella, outbreak and sporadic illnesses are similar for severity and sex. Nevertheless, the percentage of outbreak illnesses in the youngest age category was lower. Therefore, we do not reject the assumption that outbreak and sporadic illnesses are similar.
Keywords: Campylobacter; Escherichia coli O157; FoodNet; Foodborne Diseases Active Surveillance Network; Listeria; Salmonella; bacteria; disease outbreaks; enteric infections; foodborne diseases; sporadic.
Figures
Similar articles
-
Investigations of Possible Multistate Outbreaks of Salmonella, Shiga Toxin-Producing Escherichia coli, and Listeria monocytogenes Infections - United States, 2016.MMWR Surveill Summ. 2020 Nov 13;69(6):1-14. doi: 10.15585/mmwr.ss6906a1. MMWR Surveill Summ. 2020. PMID: 33180756 Free PMC article.
-
Incidence of foodborne illnesses--FoodNet, 1997.Can Commun Dis Rep. 1999 Feb 1;25(3):21-3. Can Commun Dis Rep. 1999. PMID: 10024751 English, French. No abstract available.
-
Vital signs: incidence and trends of infection with pathogens transmitted commonly through food--foodborne diseases active surveillance network, 10 U.S. sites, 1996-2010.MMWR Morb Mortal Wkly Rep. 2011 Jun 10;60(22):749-55. MMWR Morb Mortal Wkly Rep. 2011. PMID: 21659984
-
Estimating the burden of foodborne diseases in Japan.Bull World Health Organ. 2015 Aug 1;93(8):540-549C. doi: 10.2471/BLT.14.148056. Epub 2015 Jun 1. Bull World Health Organ. 2015. PMID: 26478611 Free PMC article. Review.
-
Bacterial food-borne zoonoses.Rev Sci Tech. 2000 Apr;19(1):226-39. doi: 10.20506/rst.19.1.1219. Rev Sci Tech. 2000. PMID: 11189717 Review.
Cited by
-
Temporal changes in the proportion of Salmonella outbreaks associated with 12 food commodity groups in the United States.Epidemiol Infect. 2022 Jun 15;150:e126. doi: 10.1017/S0950268822001042. Epidemiol Infect. 2022. PMID: 35703081 Free PMC article.
-
Foodborne Illness Outbreaks Reported to National Surveillance, United States, 2009-2018.Emerg Infect Dis. 2022 Jun;28(6):1117-1127. doi: 10.3201/eid2806.211555. Emerg Infect Dis. 2022. PMID: 35608555 Free PMC article. Review.
-
Foodborne illness outbreaks linked to unpasteurised milk and relationship to changes in state laws - United States, 1998-2018.Epidemiol Infect. 2022 Oct 25;150:e183. doi: 10.1017/S0950268822001649. Epidemiol Infect. 2022. PMID: 36280604 Free PMC article.
-
Phylogeny and Genomic Characterization of Clinical Salmonella enterica Serovar Newport Collected in Tennessee.Microbiol Spectr. 2023 Feb 14;11(1):e0387622. doi: 10.1128/spectrum.03876-22. Epub 2023 Jan 5. Microbiol Spectr. 2023. PMID: 36602313 Free PMC article.
-
Genomic perspectives on foodborne illness.medRxiv [Preprint]. 2024 May 16:2024.05.16.24307425. doi: 10.1101/2024.05.16.24307425. medRxiv. 2024. Update in: Proc Natl Acad Sci U S A. 2024 Nov 12;121(46):e2411894121. doi: 10.1073/pnas.2411894121. PMID: 38903069 Free PMC article. Updated. Preprint.
References
-
- Gould LH, Walsh KA, Vieira AR, Herman K, Williams IT, Hall AJ, et al. Surveillance for foodborne disease outbreaks—United States, 1998–2008. MMWR Surveill Summ. 2013;62:1–34. - PubMed
-
- Friedman J, Hastie T, Tibshirani R. Additive logistic regression: a statistical view of boosting (with discussion and a rejoinder by the authors). Ann Stat. 2000;28:337–407 . 10.1214/aos/1016218223 - DOI
MeSH terms
LinkOut - more resources
Full Text Sources
Other Literature Sources
Medical
