. 2016 Aug;80(2):233-46.
doi: 10.1002/ana.24708. Epub 2016 Jul 7.

Direct current stimulation induces mGluR5-dependent neocortical plasticity

Affiliations

Direct current stimulation induces mGluR5-dependent neocortical plasticity

Yan Sun et al. Ann Neurol. 2016 Aug.

Abstract

Objective: To obtain insights into mechanisms mediating changes in cortical excitability induced by cathodal transcranial direct current stimulation (tDCS).

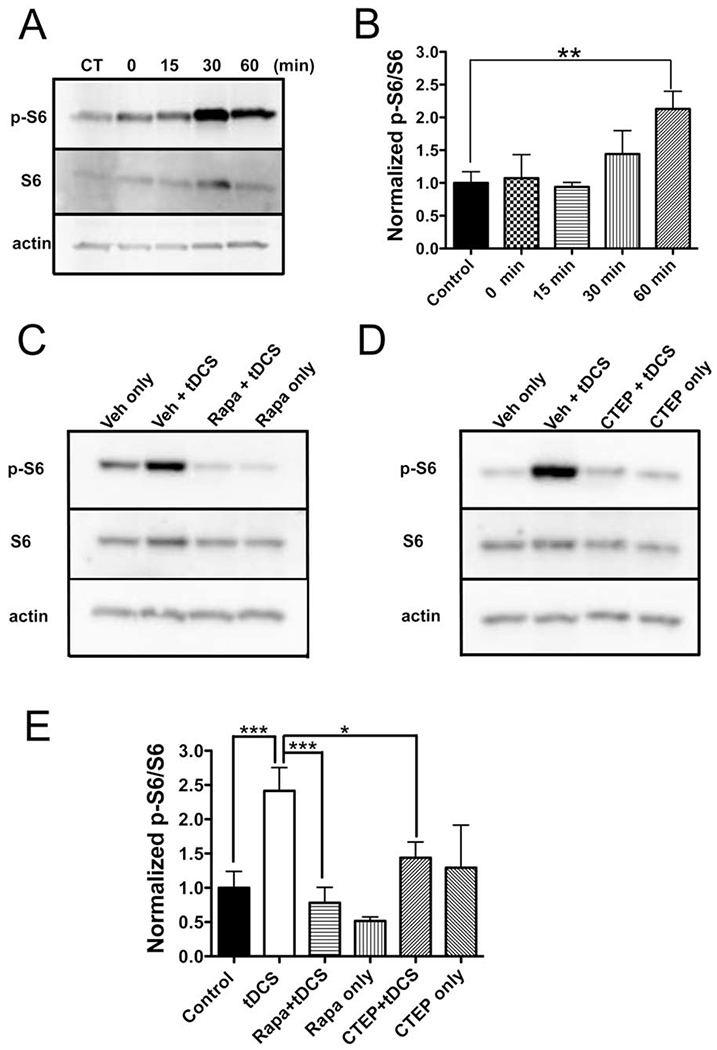
Methods: Neocortical slices were exposed to direct current stimulation (DCS) delivered through Ag/AgCl electrodes over a range of current orientations, magnitudes, and durations. DCS-induced cortical plasticity and its receptor dependency were measured as the change in layer II/III field excitatory postsynaptic potentials by a multielectrode array, both with and without neurotransmitter receptor blockers or allosteric modulators. In vivo, tDCS was delivered to intact mice scalp via surface electrodes. Molecular consequences of DCS in vitro or tDCS in vivo were tested by immunoblot of protein extracted from stimulated slices or the neocortex harvested from stimulated intact mice.

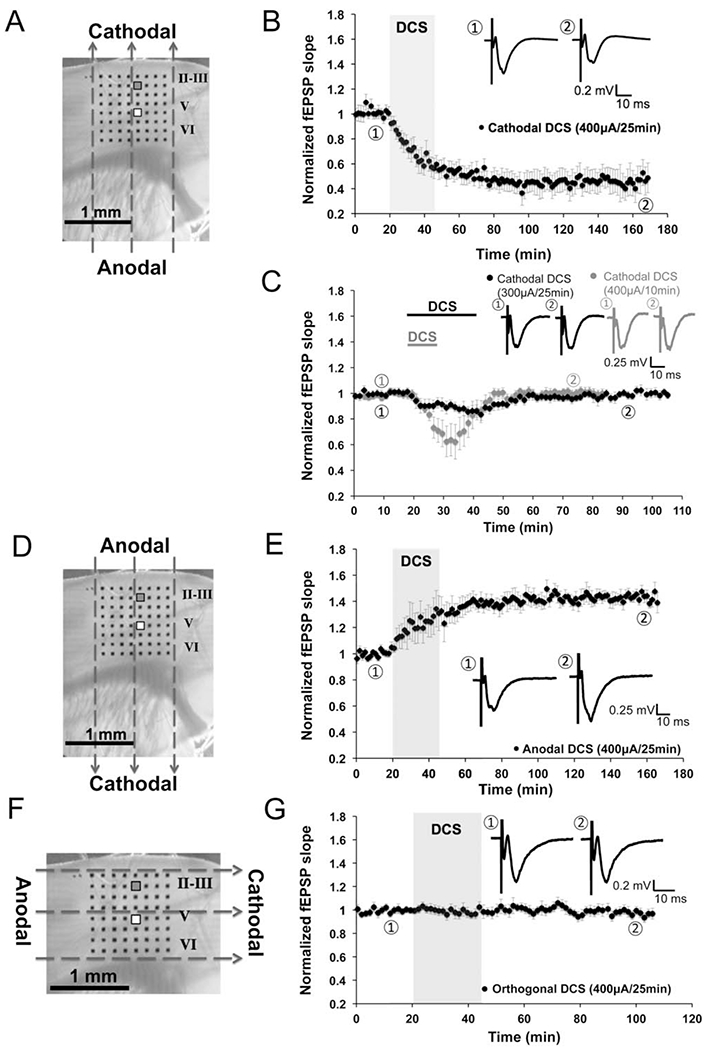
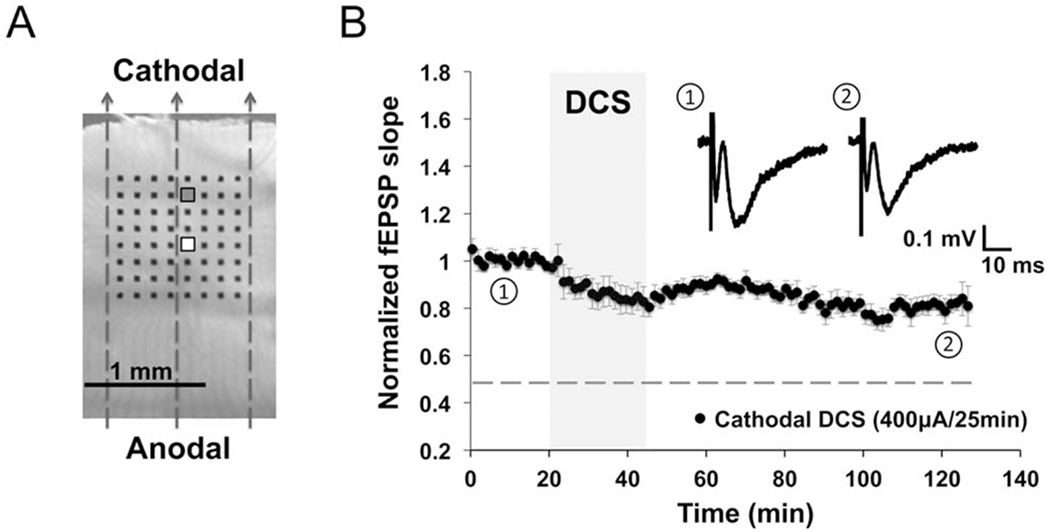
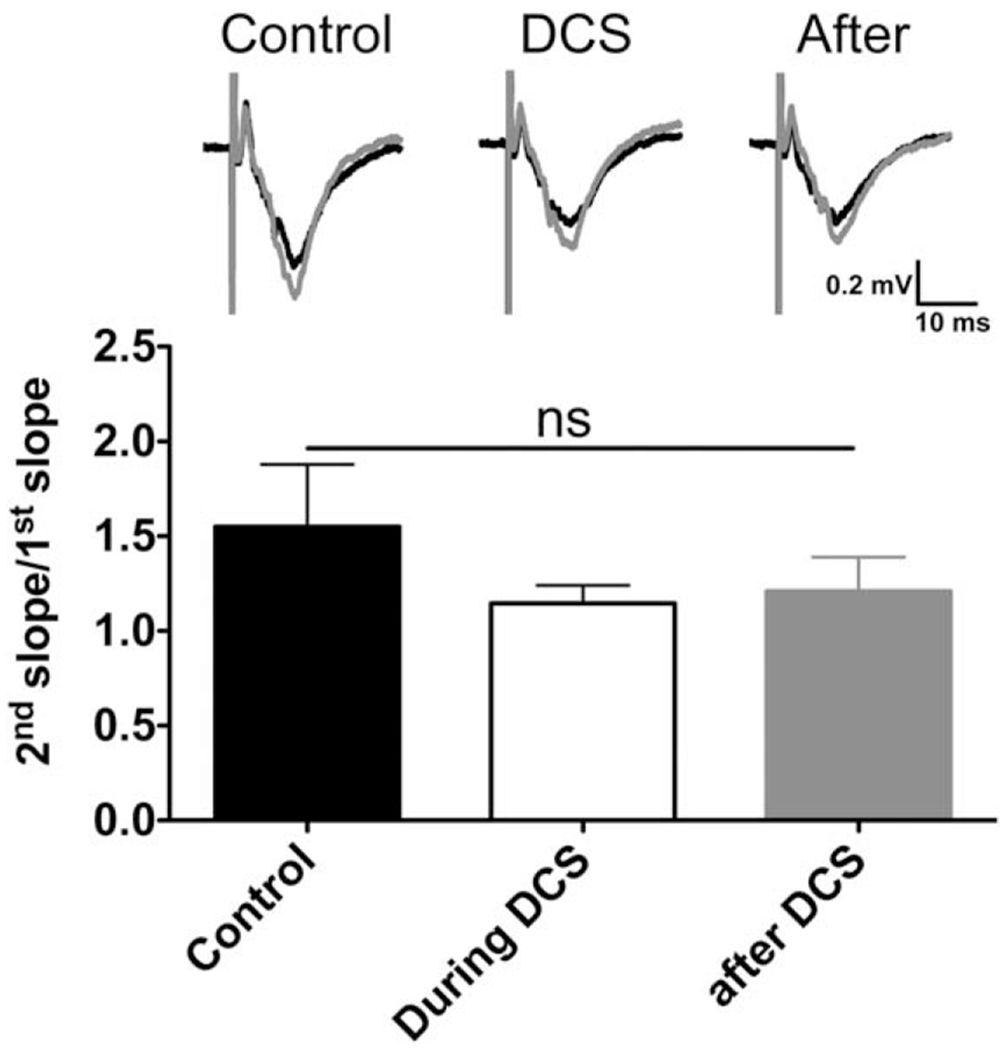
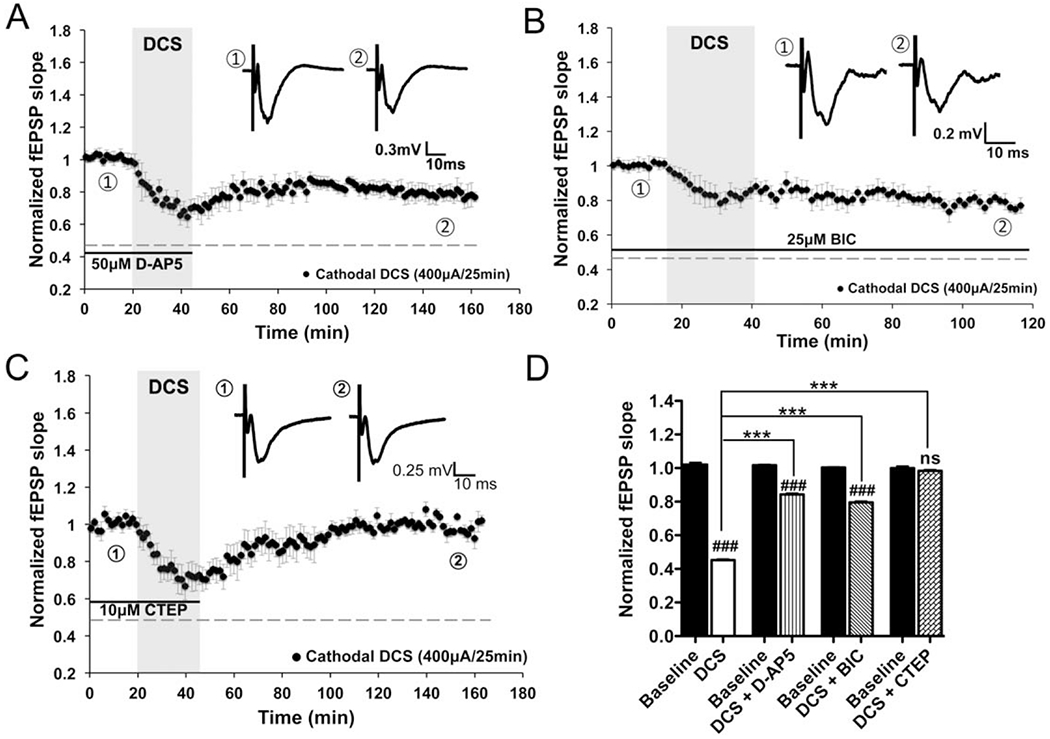
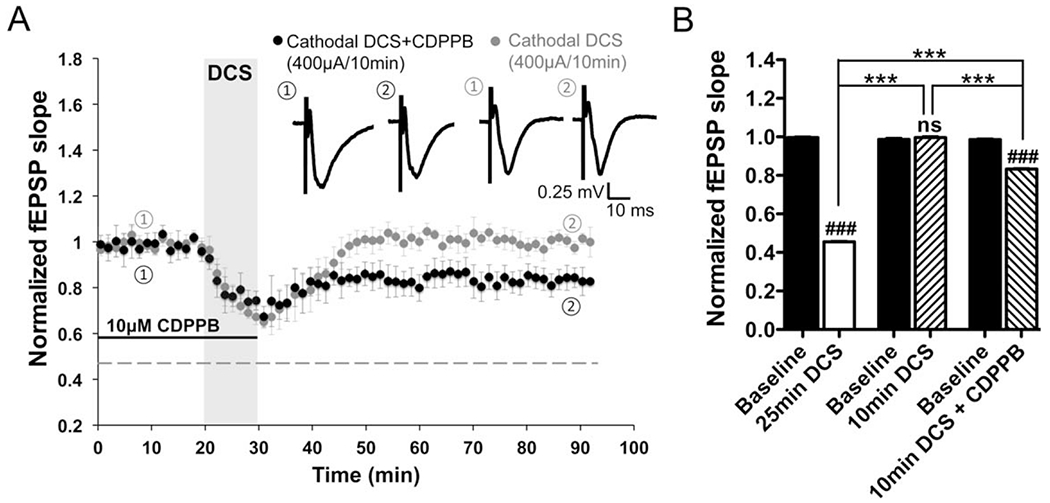
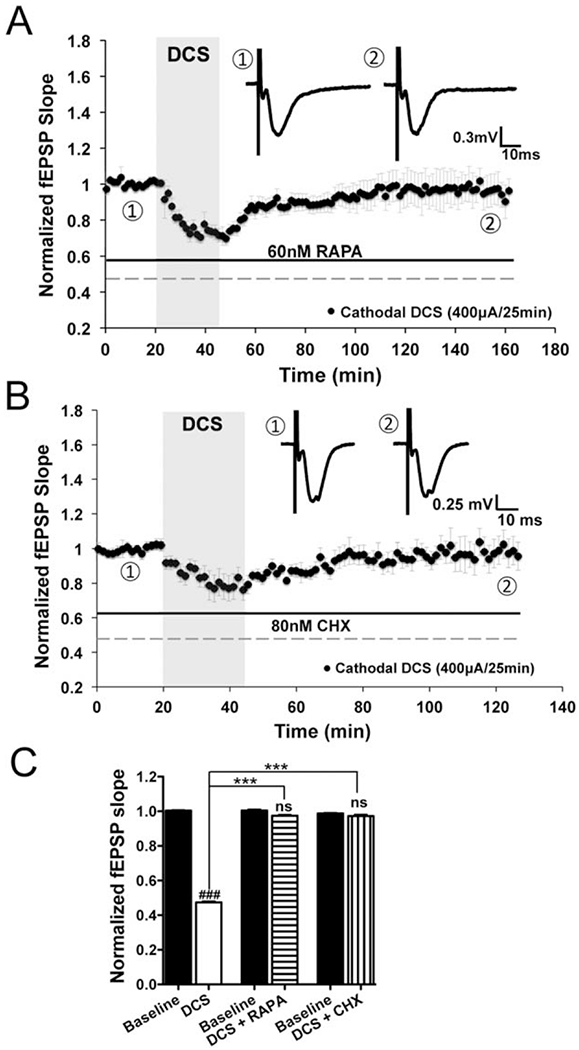
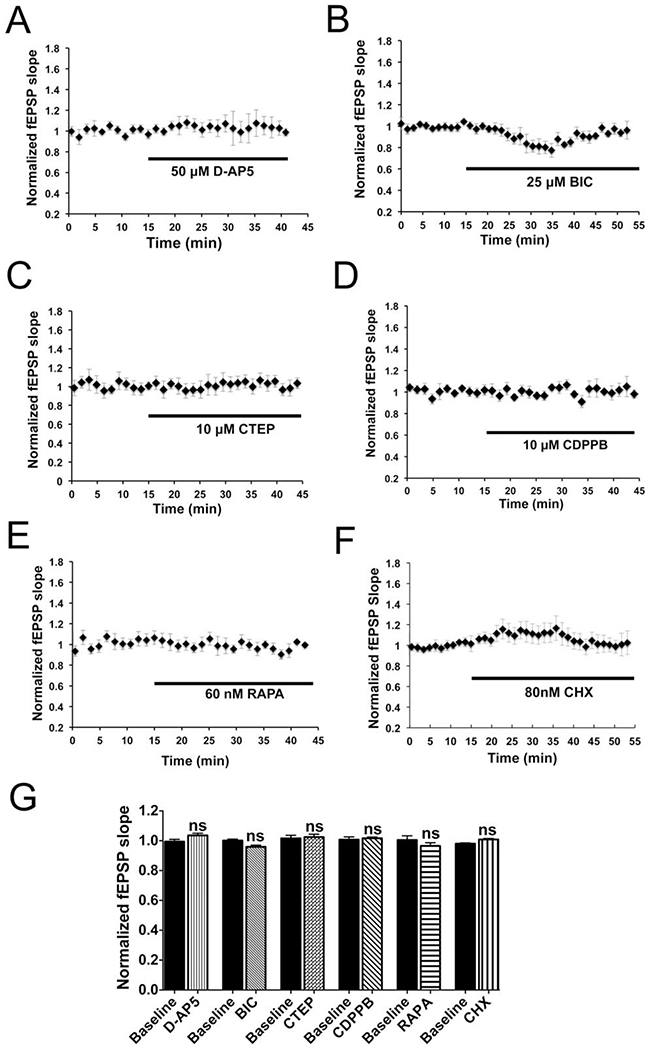
Results: Cathodal DCS in vitro induces a long-term depression (DCS-LTD) of excitatory synaptic strength in both human and mouse neocortical slices. DCS-LTD is abolished with an mGluR5 negative allosteric modulator, mechanistic target of rapamycin (mTOR) inhibitor, and inhibitor of protein synthesis. However, DCS-LTD persists despite either γ-aminobutyric acid type A receptor or N-methyl-D-aspartate receptor inhibition. An mGluR5-positive allosteric modulator, in contrast, transformed transient synaptic depression resultant from brief DCS application into durable DCS-LTD.

Interpretation: We identify a novel molecular pathway by which tDCS modulates cortical excitability, and indicate a capacity for synergistic interaction between tDCS and pharmacologic mGluR5 facilitation. The findings support exploration of cathodal tDCS as a treatment of neurologic conditions characterized by aberrant regional cortical excitability referable to mGluR5-mTOR signaling. Ann Neurol 2016;80:233-246.


Conflict of interest statement

Potential Conflicts of Interest

Nothing to report.

Figures

FIGURE 1:
FIGURE 1:
Vector- and polarity-dependent long-term depression (LTD) induced by cathodal direct current stimulation (DCS) in mouse M1 slices. (A, D, and F) Orientation of the direct current fields parallel (A, D) or orthogonal (F) to the M1 fibers (layer V to II/III projections): cathodal (A), anodal (D), and orthogonal DCS (F). The 8 × 8 electrode array (black dots in A, D, and F) fully covered the M1 area. We stimulated at layer V and recorded from layer II/III. Stimulating electrode is marked white (white square), and recording electrode is marked gray (gray square). Dashed arrows in A, D, and F indicate the electrical field orientation. Scale bars are 1mm in A, D, and F. (B) An LTD effect was induced by cathodal DCS at 400μA for 25 minutes (45.2 ± 0.7% of baseline; n = 8 mice, 9 slices; p < 0.001). Transparent gray rectangle indicates DCS duration in this and subsequent electrophysiology figures. Representative field excitatory postsynaptic potential (fEPSP) traces were taken at times indicated by numerals in this and subsequent electrophysiology figures. Scale bars are equal to 0.1 to 0.3mV and 10 milliseconds in this and subsequent electrophysiology figures. (C) Short-term fEPSP depression was induced by cathodal DCS at a low intensity (300μA, 25 minutes; n = 5 mice, 8 slices; black trace) or short duration (400μA for 10 minutes; n = 5 mice, 8 slices; gray trace). Black and gray bars on top of the traces indicate cathodal DCS duration. (E) Long-term potentiation was induced by anodal DCS at 400μA for 25 minutes (143.7 ± 1.4% of baseline; n = 7 mice, 9 slices; p < 0.001). (G) No fEPSP change followed orthogonal DCS at 400μA for 25 minutes (96.9 ± 1.0% of baseline; n = 7 mice, 8 slices; p > 0.05).
FIGURE 2:
FIGURE 2:
Direct current stimulation-induced long-term depression (DCS-LTD) in human cortical slices. (A) Human cortical slice photograph shows electrode array placement and the orientation of direct current field (indicated by dashed arrows). Stimulating electrode is marked white (white square), and recording electrode is marked gray (gray square). (B) DCS-LTD was induced by applying cathodal DCS (400μA, 25 minutes) to human cortical slices (76.0 ± 1.1% of baseline; n = 8 slices, 4 individuals; p < 0.001). The dotted line in this and subsequent electrophysiology figures indicates the magnitude of normal DCS-LTD in mouse M1. fEPSP = field excitatory postsynaptic potential.
FIGURE 3:
FIGURE 3:
Paired-pulse facilitation (PPF) induced in mouse M1 slices is not affected by cathodal direct current stimulation (DCS). There was no change of the PPF ratio (2nd slope/1st slope) before (1.5 ± 0.3), during (1.1 ± 0.1), and after (1.2 ± 0.2) cathodal DCS (400μA, 25 minutes; n = 6 mice, 12 slices; F2,15 = 0.95, ns = p > 0.05 by 1-way analysis of variance). Representative field excitatory postsynaptic potential (fEPSP) traces induced by paired pulses (30-millisecond interpulse interval) during each phase are shown; black traces indicate the first fEPSP, and gray traces indicate the second fEPSP.
FIGURE 4:
FIGURE 4:
Direct current stimulation-induced long-term depression (DCS-LTD) depends on metabotropic glutamate receptor 5 (mGluR5) activation in mouse M1 slices. (A, B) DCS-LTD effect can be elicited by cathodal DCS with treatment by either 50μM D-(–)-2-amino-5-phosphonopentanoic acid (D-AP5; slopes were decreased to 84.3 ± 0.7% of baseline; n = 5 mice, 7 slices; p < 0.001) or 25μM bicuculline (BIC; 79.6 ± 0.7% of baseline; n = 5 mice, 6 slices; p < 0.001), antagonists of N-methyl-D-aspartate receptor and γ-aminobutyric acid type A receptor, respectively. (C) Bath application of mGluR5 negative allosteric modulator (2-chloro-4-[(2,5-dimethyl-1-[4-(trifluoromethoxy)phenyl]-1H-imidazol-4-yl)ethynyl]pyridine [CTEP], 10μM) completely abolished DCS-LTD in M1 slices (98.3 ± 0.7% of baseline; n = 7 mice, 10 slices; p > 0.05). Black bars under the traces in A–C indicate timing of drug exposure. (D) Statistical analysis of DCS-LTD changes on specific drug conditions (F7,56 = 423.2, p < 0.001); 1-way analysis of variance (ANOVA) post-test between each treatment and its baseline, ### = p < 0.001 and ns = p > 0.05; 1-way ANOVA post-test between 2 means as indicated in the graph, ***p < 0.001. fEPSP = field excitatory postsynaptic potential.
FIGURE 5:
FIGURE 5:
Metabotropic glutamate receptor 5 (mGluR5) positive allosteric modulator (PAM) promotes direct current stimulation-induced long-term depression (DCS-LTD) in mouse M1 slices. (A) Short-term depression induced by 10-minute 400μA cathodal DCS (99.6 ± 0.7% of baseline 1 hour after DCS; n = 5 mice, 5 slices; p > 0.05) was enhanced to DCS-LTD (83.3 ± 0.4% of baseline 1 hour after DCS; n = 4 mice, 9 slices; p < 0.001) by exposure of M1 slices to an mGluR5 PAM (3-cyano-N-[1,3-diphenyl-1H-pyrazol-5-yl]benzamide [CDPPB], 10μM). (B) Statistic analysis of the aftereffects induced by cathodal DCS (400μA, 10 minutes) with and without CDPPB compared to normal DCS-LTD (F5,42 = 1317, p < 0.001); 1-way analysis of variance (ANOVA) post-test between each treatment and its respective baseline, ### = p < 0.001 and ns = p > 0.05; 1-way ANOVA post-test between 2 means as indicated in the graph, ***p < 0.001. fEPSP = field excitatory postsynaptic potential.
FIGURE 6:
FIGURE 6:
Direct current stimulation-induced long-term depression (DCS-LTD) depends on mechanistic target of rapamycin (mTOR) pathway activation and protein synthesis in mouse M1 slices. (A) Rapamycin (RAPA; 60nM), an inhibitor of mTOR, blocks DCS-LTD (97.5 ± 0.6% of baseline; n = 7 mice, 12 slices; p > 0.05). (B) Similar to rapamycin, a global protein synthesis inhibitor, cycloheximide (CHX; 80nM), also blocks DCS-LTD (97.2 ± 1.0% of baseline; n = 4 mice, 5 slices; p > 0.05). (C) Statistical analysis of field excitatory postsynaptic potential (fEPSP) changes that follow cathodal DCS with and without rapamycin or cycloheximide (F5,42 = 928.8, p < 0.001); 1-way analysis of variance (ANOVA) post-test between each treatment and its respective baseline, ### = p < 0.001 and ns = p > 0.05; 1-way ANOVA post-test between 2 means as indicated in the graph, ***p < 0.001.
FIGURE 7:
FIGURE 7:
Baseline field excitatory postsynaptic potentials (fEPSPs) in drug settings. (A, C–E) No change of baseline slopes was observed in mouse M1 slices by bath application of D-(–)-2-amino-5-phosphonopentanoic acid (D-AP5; 50μM; 103.6 ± 1.4% of baseline; n = 3 mice, 6 slices; p > 0.05), 2-chloro-4-([2,5-dimethyl-1-(4-[trifluoromethoxy]phenyl)-1H-imidazol-4-yl]ethynyl)pyridine (CTEP; 10μM; 102.5 ± 1.8% of baseline; n = 4 mice, 7 slices; p > 0.05), 3-cyano-N-(1,3-diphenyl-1H-pyrazol-5-yl)benzamide (CDPPB; 10μM; 101.7 ± 0.8% of baseline; n = 3 mice, 3 slices; p > 0.05), or rapamycin (RAPA, 60nM; 96.5 ± 2.1% of baseline; n = 5 mice, 5 slices; p > 0.05) up to 20 to 25 minutes. (B, F) Application of 25μM bicuculline (BIC) or 80nM cycloheximide (CHX) transiently changed the baseline fEPSP slopes, which returned to their baselines within ~35 minutes of drug application (BIC: 95.9 ± 1.1% of baseline; n = 3 mice, 5 slices; p > 0.05; CHX: 100.9 ± 0.6% of baseline; n = 4 mice, 5 slices; p > 0.05). (G) Statistical analysis of drug effects on the baseline fEPSP 20 to 25 minutes (D-AP5, CTEP, RAPA, CDPPB) or 35 to 40 minutes (BIC, CHX) after drug introduction into the recording chamber (F11,48 = 1.99, p > 0.05); 1-way analysis of variance post-test between each treatment and its baseline, ns = p > 0.05.
FIGURE 8:
FIGURE 8:
Cathodal direct current stimulation (DCS) increases phosphorylated (p) ribosomal protein S6 via metabotropic glutamate receptor 5 and mechanistic target of rapamycin activation in mouse neocortex. (A) p-S6 in mouse M1 slices was measured 0, 15, 30, and 60 minutes after cathodal DCS (400μA, 25 minutes) by immunoblot, and a time-dependent increase of p-S6 was found. Actin was used as loading reference. Control slices (CT) were collected without DCS treatment. Total S6, normalized to actin, was unchanged (F4,15 = 0.85, p = 0.52 by 1-way analysis of variance [ANOVA]). (B) Statistical analysis of normalized p-S6:S6 ratio from M1 slices collected at different time points (F4,15 = 3.35, p < 0.05 by 1-way ANOVA). The normalized p-S6:S6 ratio is significantly increased 60 minutes after DCS (213.0 ± 26.9% of control; n = 4 mice, 4 slices; **p < 0.01 by 1-way ANOVA post-test). (C, D) p-S6 and S6 levels in M1 collected 1 hour after in vivo cathodal transcranial DCS (tDCS; 1mA, 25 minutes) with or without pretreatment with rapamycin (Rapa; C) or 2-chloro-4-([2,5-dimethyl-1-(4-[trifluoromethoxy]phenyl)-1H-imidazol-4-yl]ethynyl)pyridine (CTEP; D). p-S6 increases in the vehicle (Veh) + tDCS condition, and is otherwise stable. Total S6, normalized to actin, was unchanged (F5,24 = 1.29, p = 0.30 by 1-way ANOVA). (E) Statistical analysis of normalized p-S6:S6 ratio from M1 tissues of in vivo tDCS work (F5,40 = 4.76, p < 0.01). Normalized p-S6:S6 is increased (227.8 ± 32.0% of control) after cathodal tDCS (control [±vehicle]: n = 9 mice, tDCS [±vehicle]: n = 9 mice; ***p < 0.001). This increase is abolished by either rapamycin (73.7 ± 21.2% of control; n = 6 mice; p > 0.05 as compared to the control; ***p < 0.001 as compared to tDCS group) or CTEP pretreatment (135.8 ± 21.7% of control; n = 6 mice; p > 0.05 as compared to the control; *p < 0.05 as compared to tDCS group). Rapamycin (48.7 ± 5.4% of control; n = 3 mice; p > 0.05) or CTEP (122.0 ± 58.6% of control; n = 3 mice; p > 0.05) exposure without tDCS did not significantly affect the p-S6:S6 relative to the control group. ***p < 0.001 and *p < 0.05 by 1-way ANOVA post-test.

Similar articles

Cited by

References

    1. Elsner B, Kugler J, Pohl M, et al. Transcranial direct current stimulation (tDCS) for improving function and activities of daily living in patients after stroke. Cochrane Database Syst Rev 2013;11: CD009645. - PubMed
    1. Agarwal SM, Shivakumar V, Bose A, et al. Transcranial direct current stimulation in schizophrenia. Clin Psychopharmacol Neurosci 2013;11:118–125. - PMC - PubMed
    1. Nitsche MA, Boggio PS, Fregni F, et al. Treatment of depression with transcranial direct current stimulation (tDCS): a review. Exp Neurol 2009;219:14–19. - PubMed
    1. Ngernyam N, Jensen MP, Auvichayapat N, et al. Transcranial direct current stimulation in neuropathic pain. J Pain Relief 2013; Suppl 3. - PMC - PubMed
    1. Plow EB, Pascual-Leone A, Machado A. Brain stimulation in the treatment of chronic neuropathic and non-cancerous pain. J Pain 2012;13:411–424. - PMC - PubMed

MeSH terms