. 2016 Jun 16;165(7):1749-1761.
doi: 10.1016/j.cell.2016.05.019.

Near-Perfect Synaptic Integration by Nav1.7 in Hypothalamic Neurons Regulates Body Weight

Affiliations

Near-Perfect Synaptic Integration by Nav1.7 in Hypothalamic Neurons Regulates Body Weight

Tiago Branco et al. Cell. .

Abstract

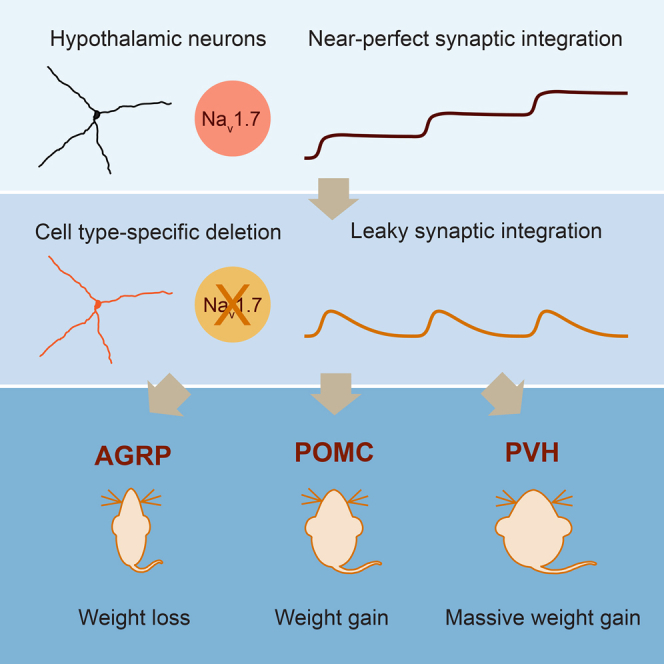
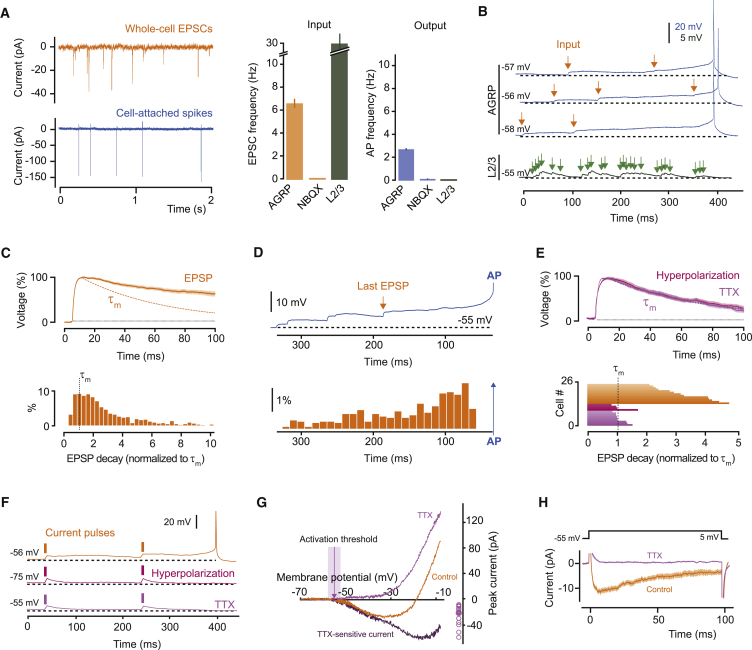
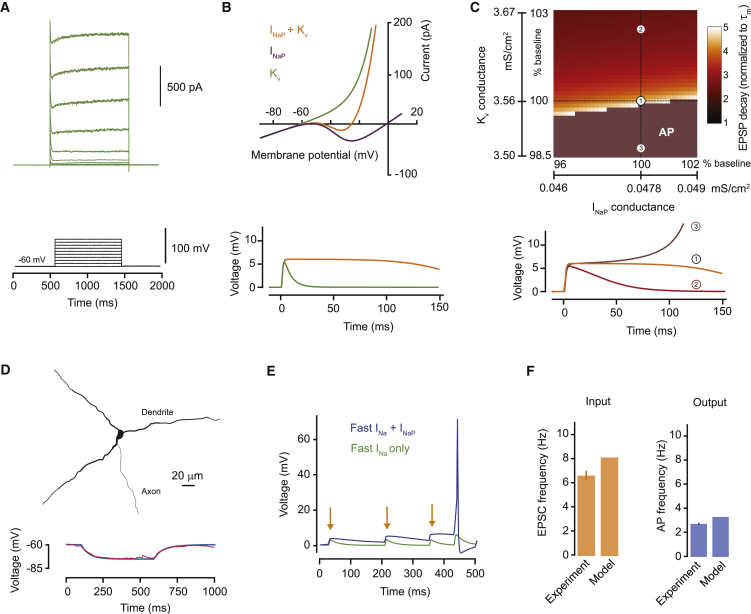
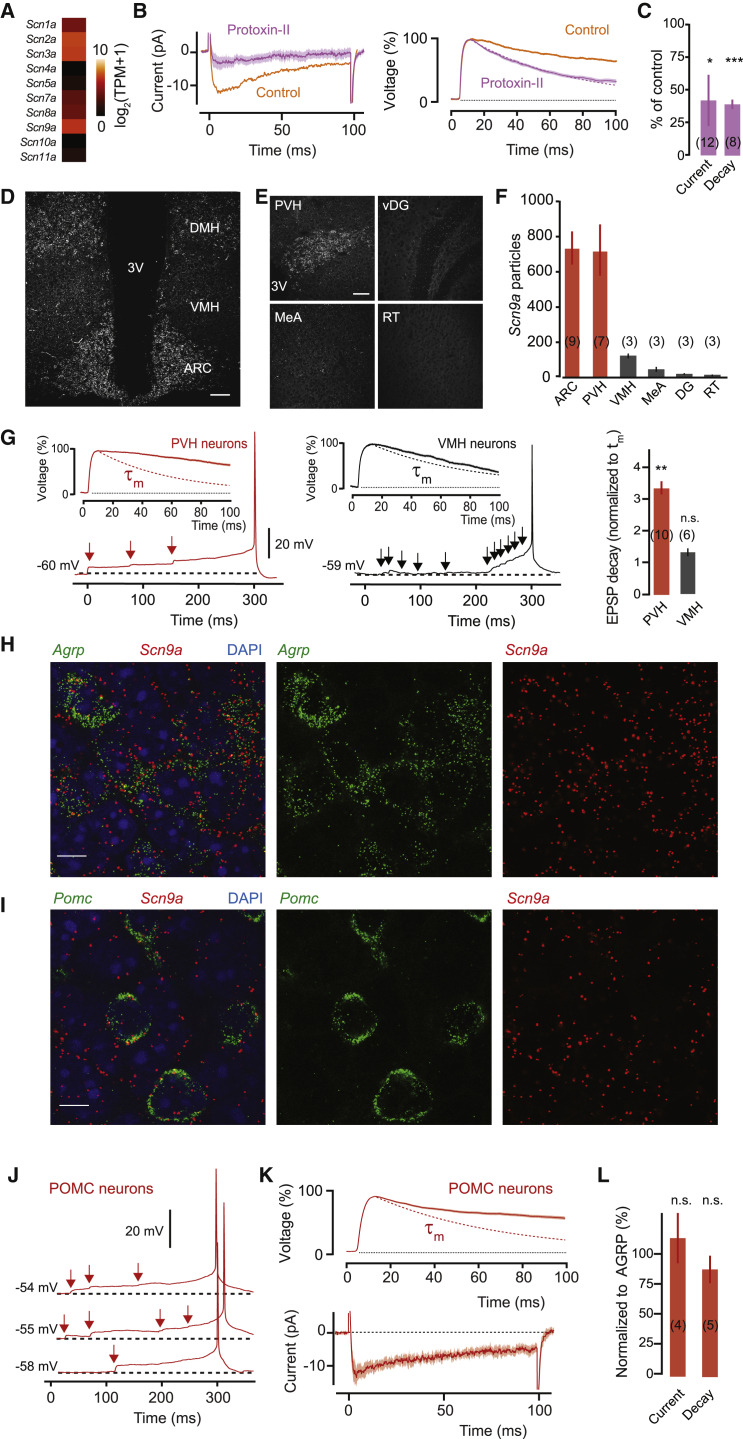
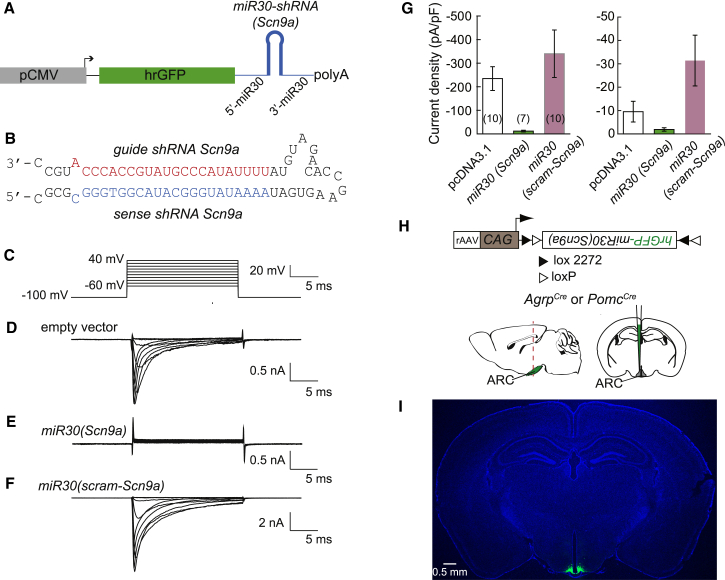
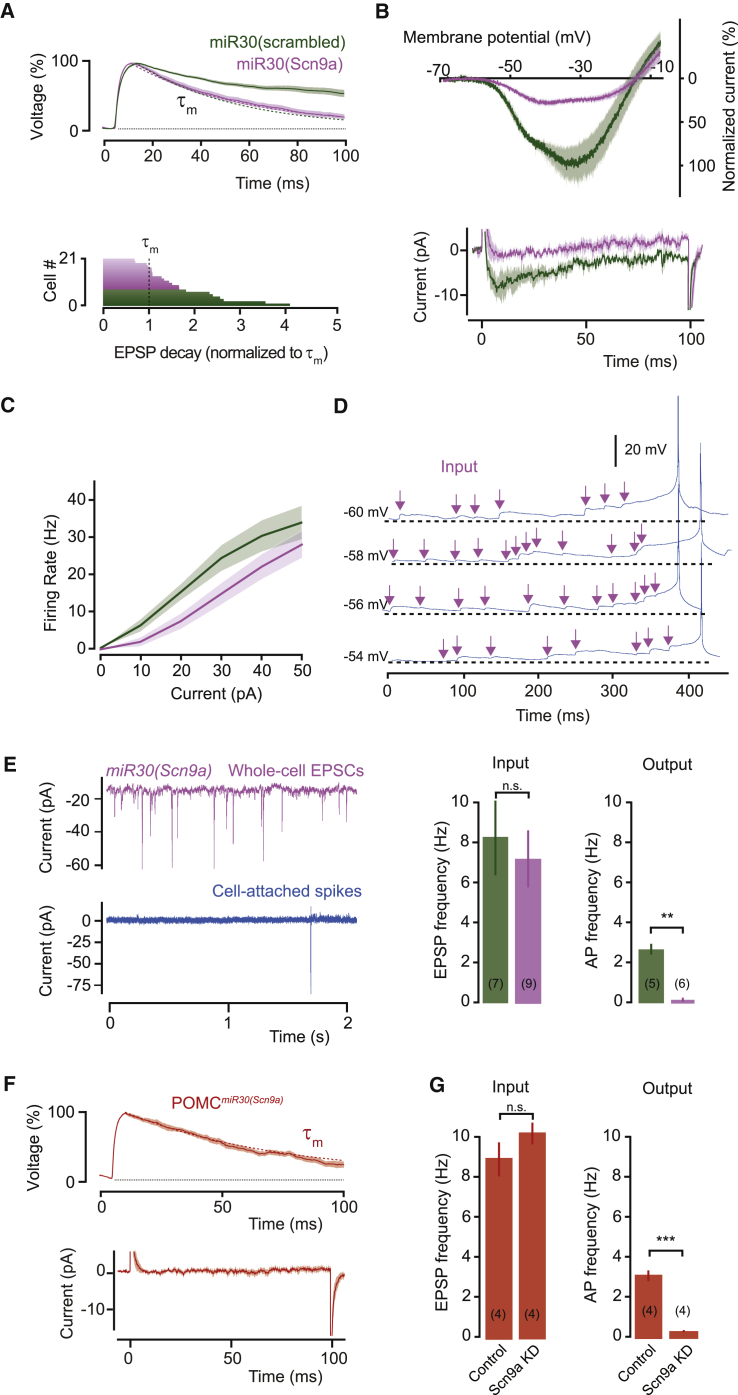
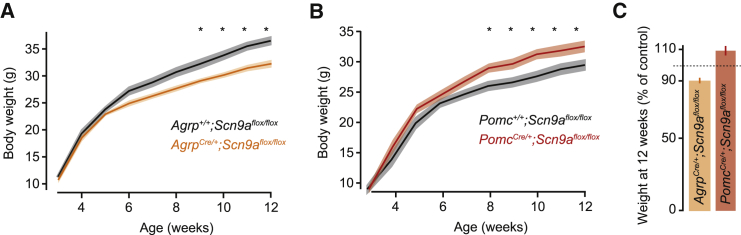
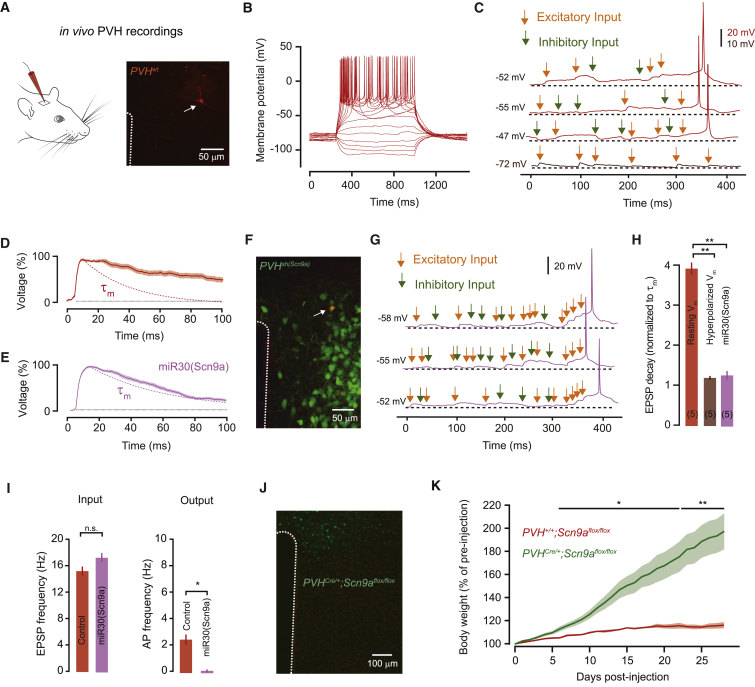
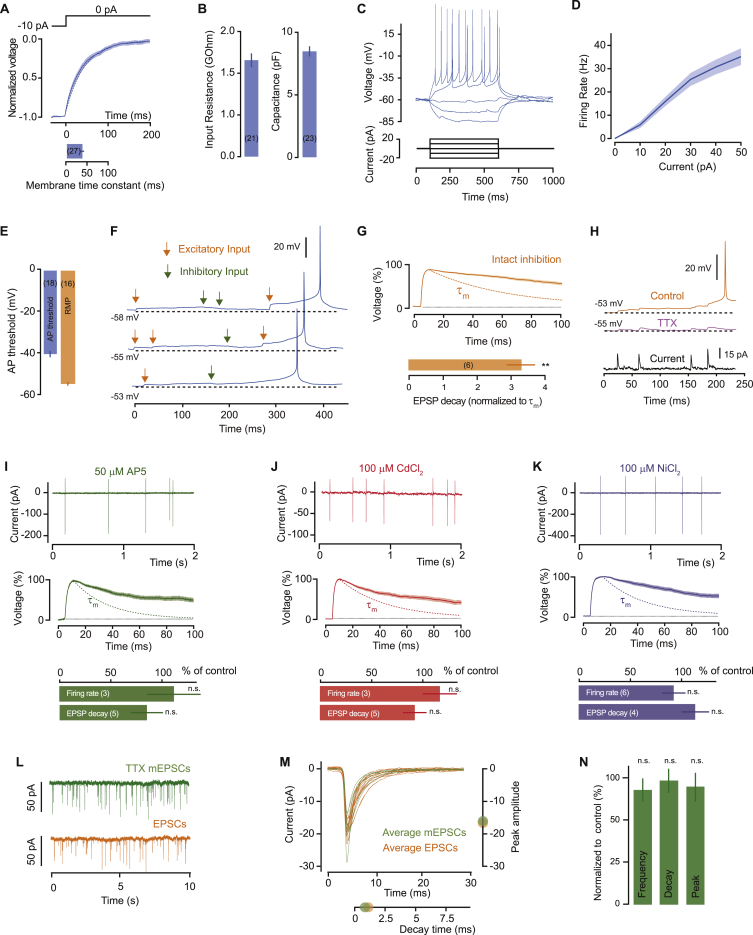
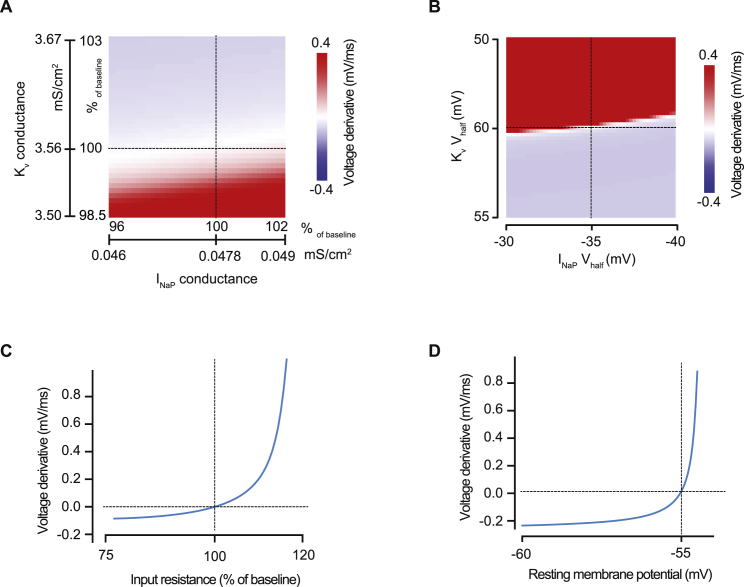
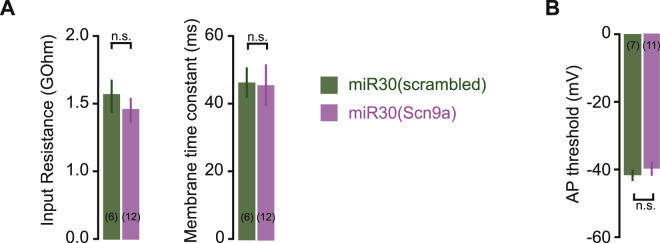
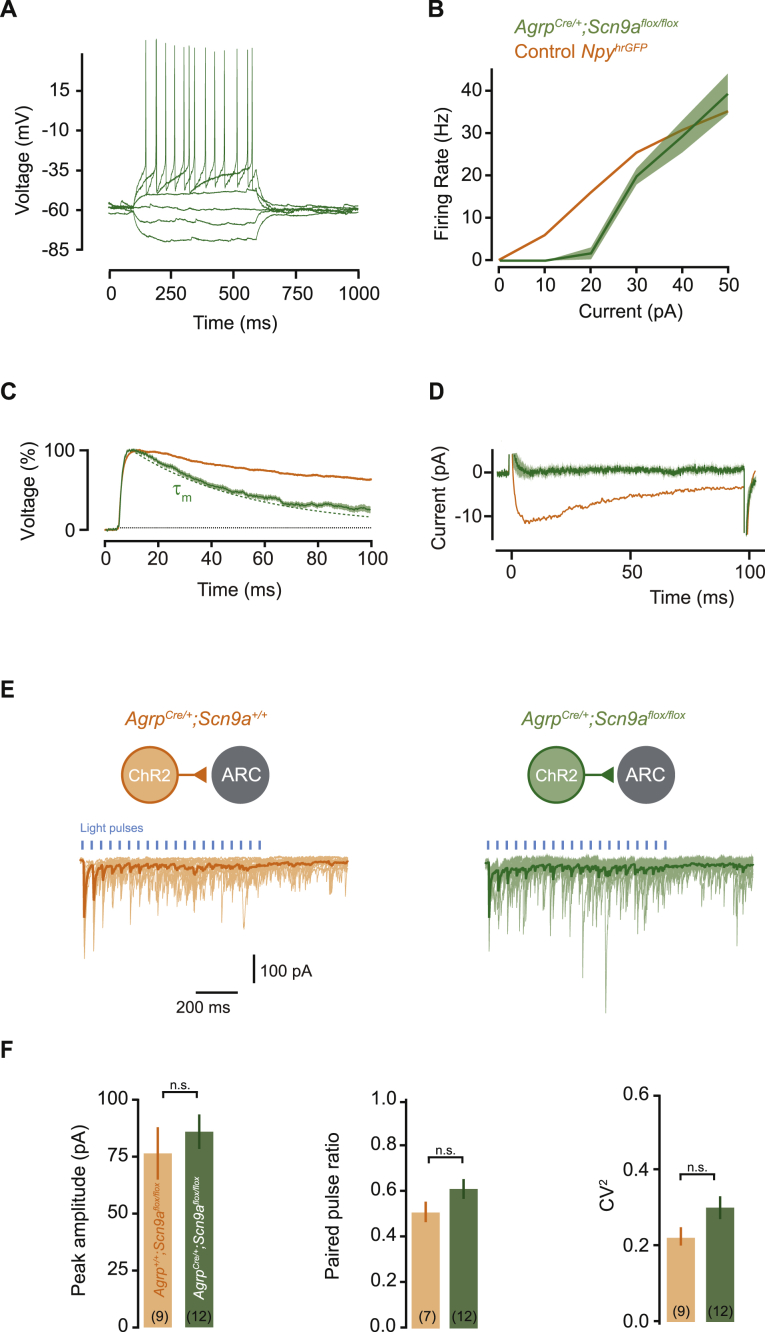
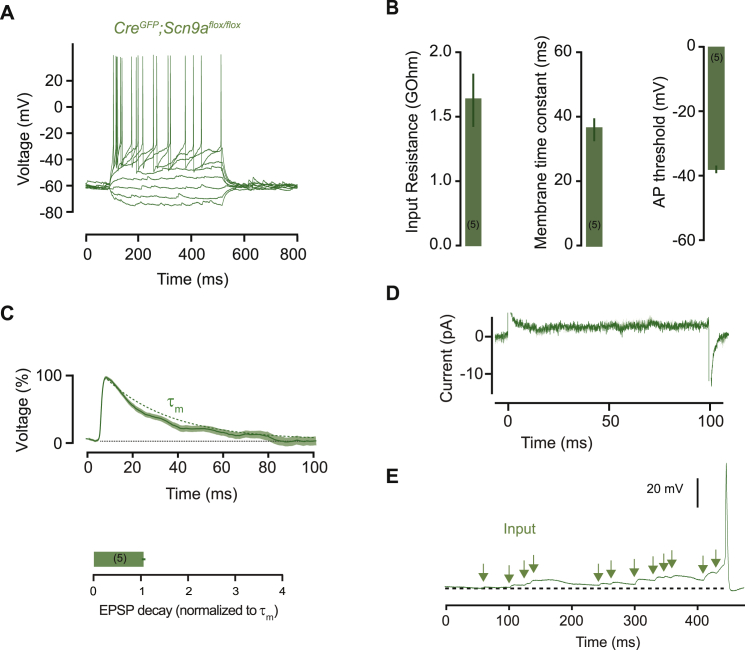
Neurons are well suited for computations on millisecond timescales, but some neuronal circuits set behavioral states over long time periods, such as those involved in energy homeostasis. We found that multiple types of hypothalamic neurons, including those that oppositely regulate body weight, are specialized as near-perfect synaptic integrators that summate inputs over extended timescales. Excitatory postsynaptic potentials (EPSPs) are greatly prolonged, outlasting the neuronal membrane time-constant up to 10-fold. This is due to the voltage-gated sodium channel Nav1.7 (Scn9a), previously associated with pain-sensation but not synaptic integration. Scn9a deletion in AGRP, POMC, or paraventricular hypothalamic neurons reduced EPSP duration, synaptic integration, and altered body weight in mice. In vivo whole-cell recordings in the hypothalamus confirmed near-perfect synaptic integration. These experiments show that integration of synaptic inputs over time by Nav1.7 is critical for body weight regulation and reveal a mechanism for synaptic control of circuits regulating long term homeostatic functions.


Figures

None
Graphical abstract
Figure 1
Figure 1
Persistent Sodium Current Prolongs EPSPs in AGRP Neurons (A) Input-output relationship for AGRP neurons. Left: example traces. Right: summary data with mean frequency of spontaneous excitatory postsynaptic currents (EPSCs, input) and action potential currents (AP, output) for AGRP neurons in the absence and presence of the AMPA receptor antagonist, NBQX. Input-output relationship for cortical layer 2/3 (L2/3) pyramidal neurons is shown for comparison (green, n = 4). (B) Voltage recording of spontaneous activity showing step-wise integration of excitatory synaptic input efficiently leading to action potential firing in AGRP neurons and failure to summate to threshold in cortical L2/3 neurons despite higher input frequency (bottom trace). (C) Top: peak-scaled mean spontaneous EPSP for one cell shows decay much slower than the membrane time constant (τm, dashed orange line). Bottom: histogram for normalized EPSP decay times across all cells. (D) Top: example trace illustrating the timing of the last EPSP before an action potential. Bottom: histogram of time of last EPSP preceding all action potentials (n = 9 cells). (E) Top: somatic hyperpolarization and TTX shorten EPSP decay to the membrane time constant (purple dotted line). Bottom: mean EPSP decay time for each cell, including for untreated AGRP neurons (orange bars). (F) Somatic injection of short current pulses (20 pA, 5 ms) reproduces step-wise integration (top trace), which was abolished by hyperpolarization or TTX. (G) Isolation of a TTX-sensitive persistent current with slow voltage ramp (20 mV/s). Left: example traces from one cell. Right: average peak currents for each cell. (H) Single depolarizing voltage step elicits a TTX-sensitive inward current (traces are averages for all cells). Data are represented as mean ± SEM. Lines with shaded areas are mean ± SEM. See also Figure S1.
Figure 2
Figure 2
Compartmental Model of Input Integration in AGRP Neurons (A) Experimentally measured potassium currents from AGRP neurons in response to voltage steps (example traces from one cell) used to constrain the model. (B) Top: current responses to slow voltage ramps in a single compartment model with a leak conductance and either INaP, voltage-gated potassium channels (Kv) or both, show currents densities matching those recorded in AGRP neurons. Bottom: calculated membrane potential response to a single synaptic input shows that INaP is sufficient to reproduce long-lasting EPSPs. (C) Top: varying INaP and Kv conductance densities in the single compartment model by ∼5% disrupts EPSP prolongation, with high Kv/INaP ratios producing fast decaying EPSPs and low Kv/INaP ratios leading to action potentials (AP), showing a critical synergy between INaP and voltage-gated potassium channels. Bottom: example EPSP traces for baseline (1) and two different conductance ratios. (D) Morphology of a reconstructed AGRP neuron used to produce a multi-compartmental model (top, axon partially shown) and the calculated membrane potential response to a 10 pA current step (bottom, red trace is experimental data, blue is simulated data). (E) The multi-compartmental model replicates the membrane potential response to step-wise integration of excitatory synaptic input in the presence of INaP. (F) Excitatory synaptic input with Poisson statistics and a mean rate of 8 Hz is efficiently integrated into action potentials and matches the experimentally measured input-output relationship of AGRP neurons. Data are represented as mean ± SEM. See also Figure S2.
Figure 3
Figure 3
Nav1.7 Is Expressed in AGRP and POMC Neurons (A) Mean RNA expression levels of sodium channel alpha subunits from RNA sequencing of AGRP neurons (n = 5 samples, each from 1 mouse). Scn9a: Nav1.7. TPM, transcripts per million. (B) The Nav1.7 selective blocker Protoxin-II reduces the net inward current (left) and shortens EPSP decay (right, τm, purple dashed line) across all cells (n = 8) relative to untreated AGRP neurons. (C) Summary data for INaP and EPSP decay with Protoxin-II normalized to values from untreated AGRP neurons. Sample sizes in parentheses. (D) RNA-fluorescent in situ hybridization (FISH) from Scn9a (white) shows strong labeling in the ARC and DMH, but not in the VMH. 3V, third ventricle. Scale, 100 μm. (E) RNA-FISH for Scn9a in the PVH, ventral hippocampus dentate gyrus (vDG), medial amygdala (MeA), and reticular thalamus (RT). Scale, 30 μm. (F) Mean Scn9a labeling in several brain regions. Sample sizes in parentheses from two mice. (G) PVH neurons (left, n = 10) also show efficient synaptic integration and prolonged EPSPs, but VMH neurons (middle, n = 6) require coincident input to fire. τm, dashed line. Right: summary data for EPSP decay times (paired t tests versus τm). (H and I) Double RNA-FISH for Agrp (green) and Scn9a (red) (H) or Pomc (green) and Scn9a (I) shows extensive colocalization. Blue, DAPI. Scale, 10 μm. (J) POMC neurons show stepwise integration of excitatory input. (K) Top: prolonged EPSPs (τm: red dashed line, n = 5). Bottom: net inward currents in response to 5 mV step depolarization (n = 4). (L) Net inward current and EPSP decay time are similar to AGRP neurons (unpaired t test versus NpyhrGFP cells, p = 0.66 for current and p = 0.39 for decay). Sample sizes in parentheses. Bar graphs or lines with shaded areas show mean ± SEM. ∗∗∗p < 0.001, p < 0.05, n.s. p > 0.05.
Figure 4
Figure 4
Cell-Type-Specific Tandem Fluorescent Protein/miR30-Based Scn9a Knockdown (A) Construct design for validation of tandem fluorescent protein/miR30-based Scn9a knockdown in cultured cells. pCMV, cytomegalovirus promoter and enhancer; polyA, polyadenylation sequence. (B) Sequence for shRNA for Scn9a knockdown. (C–F) Voltage-gated currents in response to voltage steps from HEK cells stably expressing Nav1.7 (C) after transfection with empty pcDNA3.1 vector (D), miR30(Scn9a)-containing vector (E), or miR30(scrambled-Scn9a)-containing vector (F). (G) Effect of knockdown constructs in HEK cells stably expressing Nav1.7. Left: peak current density in response to voltage steps (Kruskal-Wallis test, p < 0.001). Right: persistent current density in response to voltage step to −10 mV (Kruskal-Wallis test, p = 0.005). Sample sizes in parentheses. Data are represented as mean ± SEM. (H) Construct design of Cre-dependent rAAV vector (top) for cell-type-selective targeting to AGRP or POMC neurons in AgrpCre or PomcCre mice, respectively, with brain diagrams shown in sagittal and coronal cross sections. (I) Image of coronal brain section from AgrpCre mouse bilaterally expressing hrGFP-miR30(Scn9a) in the ARC after Cre-dependent virus transduction.
Figure 5
Figure 5
Efficient Synaptic Integration in AGRP and POMC Neurons Requires Scn9a (A) Knockdown of Scn9a with hrGFP-miR30(Scn9a) abolishes EPSP prolongation in AGRP neurons, while hrGFP-miR30(scrambled-Scn9a) did not (top, example cells, purple and green dashed lines: τm). Bottom: mean EPSP decays normalized to τm for each cell. (B) Persistent sodium current in slow ramp voltage-clamp protocols for miR30(Scn9a) and miR30(scrambled-Scn9a) in AGRP neurons (top, mean ± SEM across cells), and net current to a depolarizing step (bottom, mean ± SEM across cells). (C) Scn9a knockdown increases the rheobase in AGRP neurons. (D) Synaptic integration in AGRP neurons is severely disrupted after Scn9a knockdown, corresponding to an increase in the number of spontaneous EPSPs before an action potential. (E) Input-output function of miR30(Scn9a)-expressing AGRP neurons shows almost no spontaneous action potentials despite normal input rates (left, example traces; right, summary data). (F) Scn9a knockdown in POMC neurons abolishes EPSP prolongation (top, τm, dashed line) and persistent current (bottom). (G) Scn9a knockdown in POMC neurons also disrupts the input-output function. Samples sizes in parentheses. Bar graphs or lines with shaded areas show mean ± SEM. ∗∗∗p < 0.001, ∗∗p < 0.01, n.s. p > 0.05. See also Figure S3.
Figure 6
Figure 6
Scn9a in AGRP and POMC Neurons Is Required to Maintain Body Weight (A and B) Weekly body weight for (A) AgrpCre/+;Scn9aflox/flox (n = 8) or (B) PomcCre/+;Scn9aflox/flox mice (n = 12) and Cre-negative litter-mates (n = 11 and n = 16, respectively). Holm-Sidak correction for multiple comparisons. (C) Body weights normalized to Cre-negative littermate controls. Bar graphs or lines with shaded areas show mean ± SEM. p < 0.05. See also Figure S4.
Figure 7
Figure 7
Near-Perfect Synaptic Integration in PVH Neurons In Vivo (A) Schematic of in vivo recordings in the PVH in anesthetized mice (left), and image (right) of biocytin filled PVH cell recovered after whole-cell recording (arrow). (B) Example voltage response to current step injections. (C) Voltage recording of spontaneous activity showing that the interaction between excitatory and inhibitory inputs in vivo generates prolonged EPSPs and step-wise integration preceding action potential firing. Somatic hyperpolarization removes the EPSP prolongation (bottom trace). (D) Example of peak-scaled average spontaneous EPSP for one cell showing marked prolongation beyond the membrane time constant (τm, dashed line). (E) Knockdown of Scn9a in Sim1Cre mice with hrGFP-miR30(Scn9a) abolishes EPSP prolongation in vivo (τm, dashed line). (F) Image of a PVH cell recovered after in vivo whole-cell recording in a Sim1Cre mouse expressing hrGFP-miR30(Scn9a) in the PVH (green cells). The recorded cell (arrow) is stained for biocytin in red as in (A) and is EGFP-positive, and thus appears yellow. (G) Scn9a knockdown abolishes near-perfect integration in vivo. (H) Summary data for the effect of hyperpolarization and Scn9a knockdown on the EPSP decay time. (I) Scn9a knockdown disrupt the in vivo input-output conversion. (J) Image of Cre-EGFP expressing cells in the PVH of a Scn9aflox/flox mouse. (K) Daily body weight after Cre-EGFP (n = 8) or EGFP (n = 4) targeting to the PVH of Scn9aflox/flox mice showing rapid development of obesity in PVHCre/+;Scn9aflox/flox mice. Bar graphs or lines with shaded areas show mean ± SEM. See also Figure S5.
Figure S1
Figure S1
Core Biophysical Properties of AGRP Neurons and Pharmacology of Synaptic Integration, Related to Figure 1 (A) Estimation of the membrane time constant of AGRP neurons, by fitting a single exponential (dashed line) to the membrane potential decay after a hyperpolarizing current step (trace shows average across cells). (B) Mean input resistance (1.5 ± 0.1 GΩ) and capacitance (8.5 ± 0.4 pF) of AGRP neurons. (C) Example voltage response to current step injections. (D) Mean current-firing rate relationship for all cells. (E) AP threshold (−41.2 ± 1.2 mV) and resting membrane potential (RMP, −55.6 ± 1.3 mV). Mean ± SEM. (F) Voltage recording of spontaneous activity in AGRP neurons showing that step-wise integration of excitatory input can overcome synaptic inhibition to reach AP threshold. (G) Top, average peak scaled EPSP for one cell with synaptic inhibition intact (τm: dashed orange line) and summary data (bottom) showing that EPSP decays remain significantly slower than the membrane time constant, despite the presence of synaptic inhibition (3.3 ± 0.4 of τm; paired t test, p = 0.004). (H) Injection of recorded mESPC waveforms reproduces step-wise integration, which is abolished by TTX (227 ± 22% of τm, n = 4 for control versus 99.0 ± 6%, n = 7 for TTX; unpaired t test, p = 0.0001). (I–K) Blocking NMDA receptors (I), L-type (J) and T-type (K) voltage-gated calcium channels has no significant effect on the firing rate (unpaired t tests versus NpyhrGFP cells, AP5: p = 0.71, CdCl2: p = 0.48, NiCl2: p = 0.46) or EPSP kinetics of AGRP neurons (unpaired t tests versus NpyhrGFP cells, AP5: p = 0.37, CdCl2: p = 0.80, NiCl2: p = 0.20). τm: colored dashed lines. Traces in the top and middle rows are examples for individual cells, and bottom row shows summary data for all cells. Samples sizes in parentheses. (L) Example traces for spontaneous EPSCs and mEPSCs recorded at −70 mV. (M) Average EPSC and mEPSC waveforms for individual cells with the population mean peak amplitude (right) and mean decay time (below). (N) Summary data for mEPSC comparisons against EPSCs (frequency: U-test, p = 0.47 n = 7; decay time: unpaired t test, p = 0.73, n = 7; peak amplitude: unpaired t test, p = 0.48, n = 8 TTX). Bar graphs or lines with shaded areas show mean ± SEM n.s. p > 0.05, ∗∗p < 0.01.
Figure S2
Figure S2
EPSP Prolongation in a Single Compartment Model Depends on the Properties of INaP and Kv, Input Resistance, and Membrane Potential, Related to Figure 2 (A) Plot of the mean EPSP derivative (first 50 ms) as a function of INaP and Kv conductance densities (similar to Figure 2C), shows that stable voltage levels are only achieved for a narrow ratio of INaP and Kv conductance values (white band, where the mean derivative is close to 0 mV/ms). (B) Stable EPSP prolongation shows a sharp dependency on the INaP and Kv half-activation voltages (Vhalf). Hyperpolarized INaP and depolarized Kv activation voltages produce EPSPs that quickly lead to action potentials (red area), whereas the inverse lead to fast decaying EPSPs (blue area). (C) Changing the model input resistance by ± 20% severely disrupts EPSP prolongation. (D) In the model, optimal resting membrane potential for EPSP prolongation is −55 mV. Hyperpolarized potentials fail to activate enough INaP and more depolarized values engage a strong positive feedback loop that leads to action potentials. Dashed lines indicate optimal values.
Figure S3
Figure S3
miR30-Scn9a Does Not Change Basic AGRP Neurons Biophysical Properties, Related to Figure 5 (A) Input resistance and membrane time constant are not significantly different between miR30(Scn9a) and miR30(scrambled-Scn9a). Input resistance, AGRPsh(Scn9a-scram):1.4 ± 0.2 GΩ; AGRPsh(Scn9a): 1.3 ± 0.1 GΩ; Membrane time constant, AGRPsh(Scn9a-scram): 46.5 ± 4.5 ms; AGRPsh(Scn9a): 45.5 ± 6.1 ms. (B) The voltage threshold for action potential initiation is also not significantly affected by miR30(Scn9a). AGRPsh(Scn9a-scram): −43.5 ± 0.9 mV; AGRPsh(Scn9a): −40.0 ± 1.2 mV; Mean ± SEM. Samples sizes in parentheses. Data are represented as mean ± SEM n.s. p > 0.05.
Figure S4
Figure S4
Electrophysiological Properties of AGRP Neurons with Scn9a Knockout, Related to Figure 6 (A) Example voltage response to current step injections in AgrpCre/+;Scn9aflox/flox cells, identified for recording by expression of rAAV2/9-CAG-FLEX-EGFP. (B) Mean current-firing relationship showing an increase in the rheobase in comparison to control NpyhrGFP cells (89.2 ± 9% lower firing rate for 20 pA steps compared to NpyhrGFP; n = 6, U-test, p < 0.01), but the peak firing rate is similar. (C) Example average EPSP for one cell (green), showing no prolongation beyond the membrane time constant (decay = 104.2 ± 10% of τm, n = 4, paired t test, p = 0.76). Dashed line: τm. Orange, data from control NpyhrGFP cells. (D) Scn9a knockout abolishes the persistent current in response to a +5 mV depolarizing voltage step (current at 50 ms = 5.7 ± 5% of control NpyhrGFP cells, n = 5, U-test, p < 0.001). (E) Scn9a knockout does not affect postsynaptic inhibitory currents generated in arcuate neurons by Channelrhodopsin stimulation of AGRP neurons (left, control; right, Scn9a knockout). Traces are from examples cells, light colors are individual trials and dark trace is the average response. (F) Summary data showing that peak IPSC amplitude and two measures of presynaptic function, paired-pulse ratio and the squared coefficient of variation are not affected by Scn9a knockout in AGRP neurons. Bar graphs or lines with shaded areas show mean ± SEM n.s. p > 0.05.
Figure S5
Figure S5
Electrophysiological Properties of PVH Neurons with Scn9a Deletion, Related to Figure 7 (A) Example voltage response to current step injections in Scn9aflox/flox cells expressing rAAV2/9-CAG-Cre-EGFP. (B) Mean input resistance (1.4 ± 0.3 GΩ), membrane time constant (37.5 ± 3.7 ms) and AP threshold (−37.6 ± 1.1 mV) of PVH neurons with Scn9a knockout. (C) Example average EPSP for one Scn9a knockout cell decaying as predicted by membrane time constant (decay = 104 ± 4% of τm, n = 5, paired t test, p = 0.44). Dashed line: τm. (D) Average response of all cells to a +5 mV depolarizing voltage step, showing no persistent inward current (current at 50 ms = +3.0 ± 0.6 pA). (E) Synaptic integration is disrupted by Scn9a knockout (c.f. Figure 3J). Bar graphs or lines with shaded areas show mean ± SEM.

Comment in

  • Slowly Building Excitement.
    Müller C, Remy S. Müller C, et al. Cell. 2016 Jun 16;165(7):1568-1569. doi: 10.1016/j.cell.2016.06.005. Cell. 2016. PMID: 27315473

References

    1. Aponte Y., Atasoy D., Sternson S.M. AGRP neurons are sufficient to orchestrate feeding behavior rapidly and without training. Nat. Neurosci. 2011;14:351–355. - PMC - PubMed
    1. Atasoy D., Betley J.N., Su H.H., Sternson S.M. Deconstruction of a neural circuit for hunger. Nature. 2012;488:172–177. - PMC - PubMed
    1. Balthasar N., Coppari R., McMinn J., Liu S.M., Lee C.E., Tang V., Kenny C.D., McGovern R.A., Chua S.C., Jr., Elmquist J.K., Lowell B.B. Leptin receptor signaling in POMC neurons is required for normal body weight homeostasis. Neuron. 2004;42:983–991. - PubMed
    1. Branco T., Häusser M. Synaptic integration gradients in single cortical pyramidal cell dendrites. Neuron. 2011;69:885–892. - PMC - PubMed
    1. Carter B.C., Giessel A.J., Sabatini B.L., Bean B.P. Transient sodium current at subthreshold voltages: activation by EPSP waveforms. Neuron. 2012;75:1081–1093. - PMC - PubMed

Publication types

Substances