. 2016 Jun 17:16:300.
doi: 10.1186/s12879-016-1606-z.

Epidemic resurgence of dengue fever in Singapore in 2013-2014: A virological and entomological perspective

Affiliations

Epidemic resurgence of dengue fever in Singapore in 2013-2014: A virological and entomological perspective

Hapuarachchige Chanditha Hapuarachchi et al. BMC Infect Dis. .

Abstract

Background: Dengue resurged in Singapore during 2013-14, causing an outbreak with unprecedented number of cases in the country. In the present study, we summarise the epidemiological, virological and entomological findings gathered through the dengue surveillance programme and highlight the drivers of the epidemic. We also describe how the surveillance system facilitated the preparedness to moderate epidemic transmission of dengue in the country.

Methods: The case surveillance was based on a mandatory notification system that requires all medical practitioners to report clinically-suspected and laboratory-confirmed cases within 24 hours. The circulating Dengue virus (DENV) populations were monitored through an island wide virus surveillance programme aimed at determining the serotypes and genotypes of circulating virus strains. Entomological surveillance included adult Aedes surveillance as well as premise checks for larval breeding.

Results: A switch in the dominant serotype from DENV-2 to DENV-1 in March 2013 signalled a potential spike in cases, and the alert was corroborated by an increase in average Aedes house index. The alert triggered preparedness and early response to moderate the impending outbreak. The two-year outbreak led to 22,170 cases in 2013 and 18,338 in 2014, corresponding to an incidence rate of 410.6 and 335.0 per 100,000 population, respectively. DENV-1 was the dominant serotype in 2013 (61.7 %, n = 5,071) and 2014 (79.2 %, n = 5,226), contributed largely by a newly-introduced DENV-1 genotype III strain. The percentage of houses with Ae. aegypti breeding increased significantly (p < 0.001) from 2012 (annual average of 0.07 %) to 2013 (annual average of 0.14 %), followed by a drop in 2014 (annual average of 0.10 %). Aedes breeding data further showed a wide spread distribution of Ae. aegypti in the country that corresponded with the dengue case distribution pattern in 2013 and 2014. The adult Aedes data from 34 gravitrap sentinel sites revealed that approximately 1/3 of the monitored sites remained at high risk of DENV transmission in 2013.

Conclusions: The culmination of the latest epidemic is likely to be due to a number of demographic, social, virological, entomological, immunological, climatic and ecological factors that contribute to DENV transmission. A multi-pronged approach backed by the epidemiological, virological and entomological understanding paved way to moderate the case burden through an integrated vector management approach.

Keywords: Aedes aegypti; Control; Dengue; Entomology; Epidemic; Genotype; House index; Surveillance; Virology.


Figures

Fig. 1
Fig. 1
Epidemiological curve for weekly dengue cases in 2013 and 2014. All cases are laboratory confirmed
Fig. 2
Fig. 2
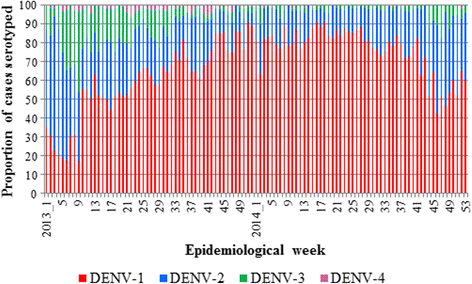
Weekly distribution of DENV serotypes in Singapore: 2013-2014. The serotype proportions were calculated based on 14,814 patient sera successfully typed in 2013 (n = 8,216) and 2014 (n = 6,598)
Fig. 3
Fig. 3
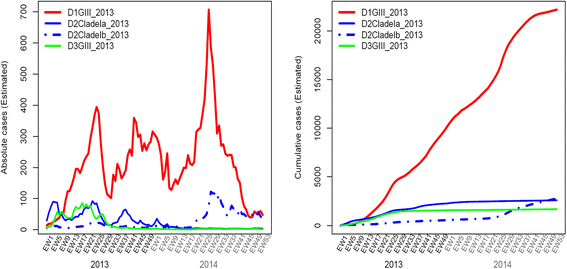
Cumulative dynamics of cases due to the most common DENV strains detected during the epidemic and their case contributory pattern in 2013 and 2014. The weekly national serotype data and weekly EHI genotype data from 2007 to 2014 were used to estimate the historical genotype proportions. In order to obtain smooth estimates of genotype proportions over time, a Bayesian approach was used assuming multinomial distribution of serotypes and genotypes, and an auto-correlated prior distribution for logarithm transformed proportions. Bayesian estimates of the weekly genotype proportions were sampled from the posterior distribution, which were used together with weekly national case count to calculate the weekly cases attributed to each genotype as well the cumulative case count. The analysis was done using R software version 3.1.1 [33]. Only the genotypes dominant during the epidemic years have been plotted in the graph
Fig. 4
Fig. 4
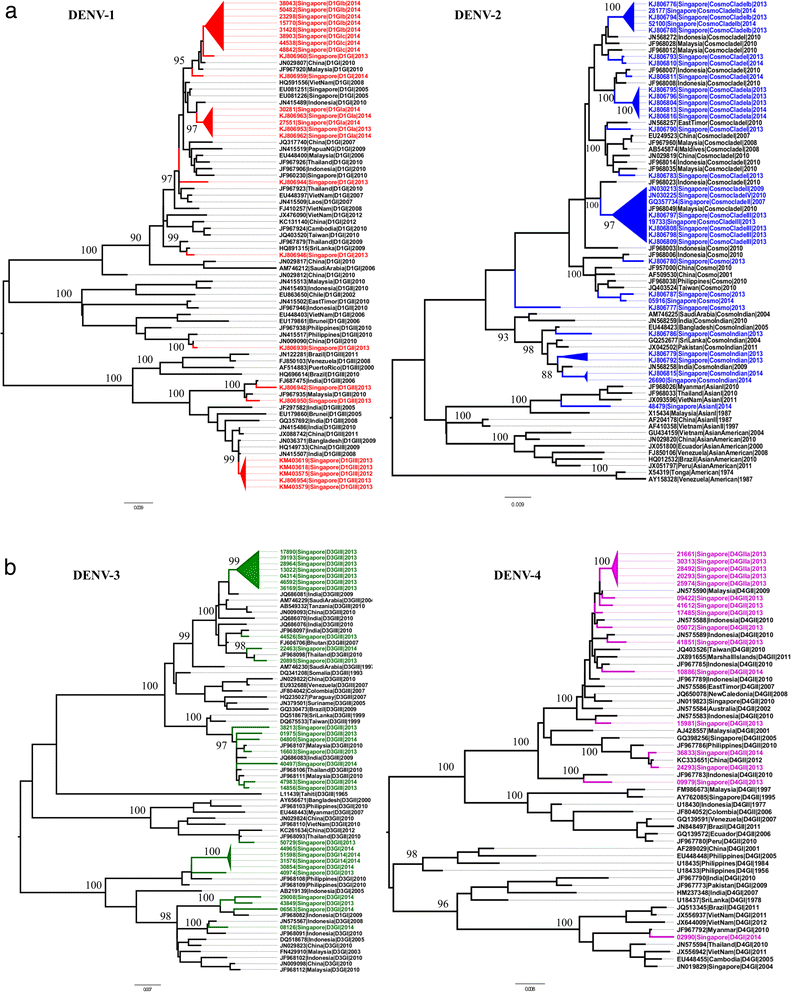
E-gene based phylogeny of DENV illustrating different types of virus strains circulated during 2013-2014. Phylogenetic analysis was performed in MEGA6 program [32] using the maximum-likelihood method based on the general time reversible model with gamma distribution and invariant sites. The robustness of the original tree was tested with 1000 bootstrap replications. a. DENV-1 and DENV-2 strains circulated in Singapore in both years have been highlighted in red and blue respectively. b. DENV-3 and DENV-4 strains circulated in Singapore in both years have been highlighted in green and purple respectively. The major groups summarized in Table 1 are shown in triangular cartoons. Each taxon is named with sample ID/NCBI accession number, reported year, country and genotype information. Numbers on branches are bootstrap support values. GI, GII, and GIII = genotypes I, II and III; cosmo = cosmopolitan genotype
Fig. 5
Fig. 5
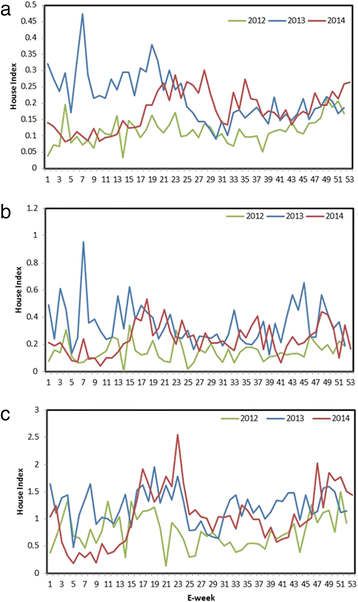
Temporal variation of House Index in different types of residential premises in 2013 and 2014. a. Housing Development Board (HDB) apartments, b. Private apartments/condominiums and c. Landed properties. House Index for each residential premise type is defined as the number of houses detected with Aedes mosquito breeding per 100 houses inspected. The analysis is based on the outcome of routine inspections carried out by approximately 800 ground officers from the Environmental Public Health Operations, NEA. Aedes immatures were morphologically identified to the species level at EHI. E-week = epidemiological week
Fig. 6
Fig. 6
Weekly trends of cases and Ae. aegypti house index during 2012-2014. The Ae. aegypti house index is expressed as the percentage of houses with Ae. aegypti mosquito breeding. The comparison shows that the fluctuation of Ae. aegypti house index generally preceded that of cases
Fig. 7
Fig. 7
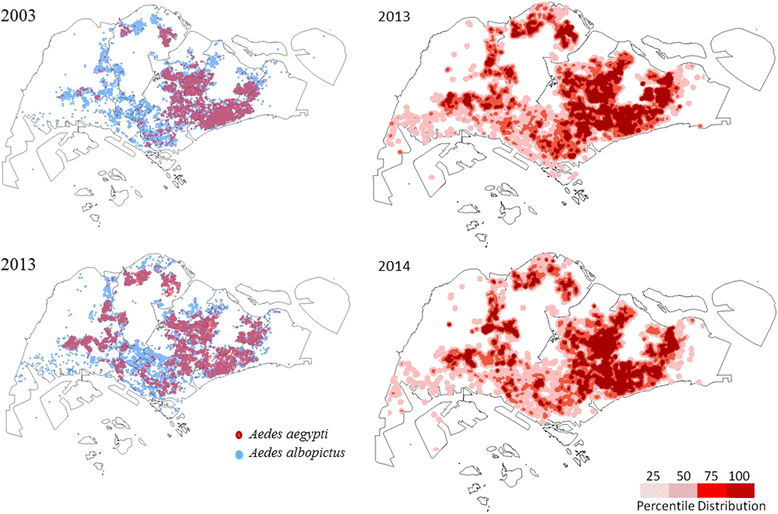
Spatial distribution of Ae. aegypti and dengue cases in 2013 and 2014. a. Spatial expansion of Ae. aegypti breeding in 2013 as compared to 2003. The breeding sites were identified based on island wide Aedes breeding data collected on a daily basis as part of vector control operations. The map was generated using the ArcGIS 10.1 ArcMap software (ESRI, CA, USA). b. Spatial distribution of dengue cases in 2013 and 2014. The spatial distribution of dengue cases in Singapore was generated using the kernel density tool in the spatial analyst toolbox of ArcGIS 10.1 ArcMap software (ESRI, CA, USA) based on a search radius of 400 m. Case density values were classified into four classes of < 25th (2 cases/km2), 25th-50th (16-25 cases/km2), 51st-75th (56-61 cases/km2) and more than 75th (217 cases/km2) quantiles, using the quantile classification method and were displayed in tones of pink as shown in the legend

References

    1. Murray NE, Quam MB, Wilder-Smith A. Epidemiology of dengue: past, present and future prospects. Clin Epidemiol. 2013;5:299–309. - PMC - PubMed
    1. Bhatt S, Gething PW, Brady OJ, Messina JP, Farlow AW, Moyes CL, Drake JM, Brownstein JS, Hoen AG, Sankoh O, et al. The global distribution and burden of dengue. Nature. 2013;496:504–507. doi: 10.1038/nature12060. - DOI - PMC - PubMed
    1. Calisher CH, Karabatsos N, Dalrymple JM, Shope RE, Porterfield JS, Westaway EG, Brandt WE. Antigenic relationships between flaviviruses as determined by cross-neutralization tests with polyclonal antisera. J Gen Virol. 1989;70(Pt 1):37–43. doi: 10.1099/0022-1317-70-1-37. - DOI - PubMed
    1. Simmons CP, Farrar JJ, Nguyen VV, Wills B. Dengue. N Engl J Med. 2012;366:1423–1432. doi: 10.1056/NEJMra1110265. - DOI - PubMed
    1. Rico-Hesse R. Molecular evolution and distribution of dengue viruses type 1 and 2 in nature. Virology. 1990;174:479–493. doi: 10.1016/0042-6822(90)90102-W. - DOI - PubMed