. 2016 Jul;28(7):1701-21.
doi: 10.1105/tpc.16.00313. Epub 2016 Jun 17.

The Arabidopsis Malectin-Like/LRR-RLK IOS1 Is Critical for BAK1-Dependent and BAK1-Independent Pattern-Triggered Immunity

Affiliations

The Arabidopsis Malectin-Like/LRR-RLK IOS1 Is Critical for BAK1-Dependent and BAK1-Independent Pattern-Triggered Immunity

Yu-Hung Yeh et al. Plant Cell. 2016 Jul.

Abstract

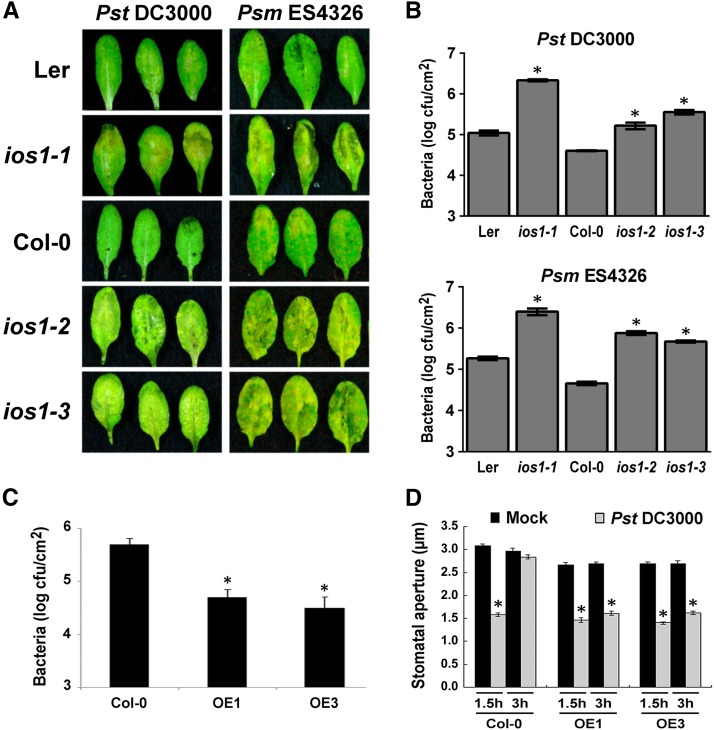
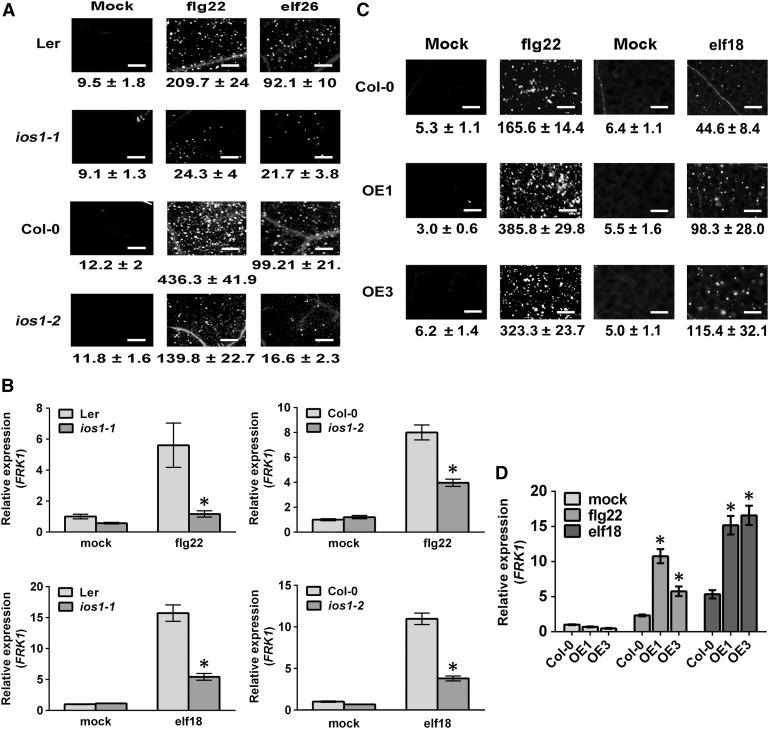
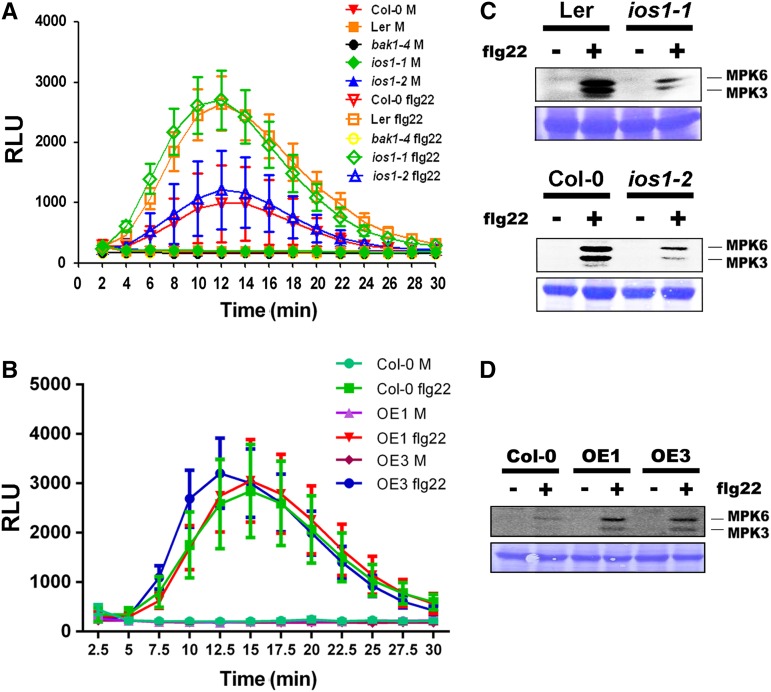
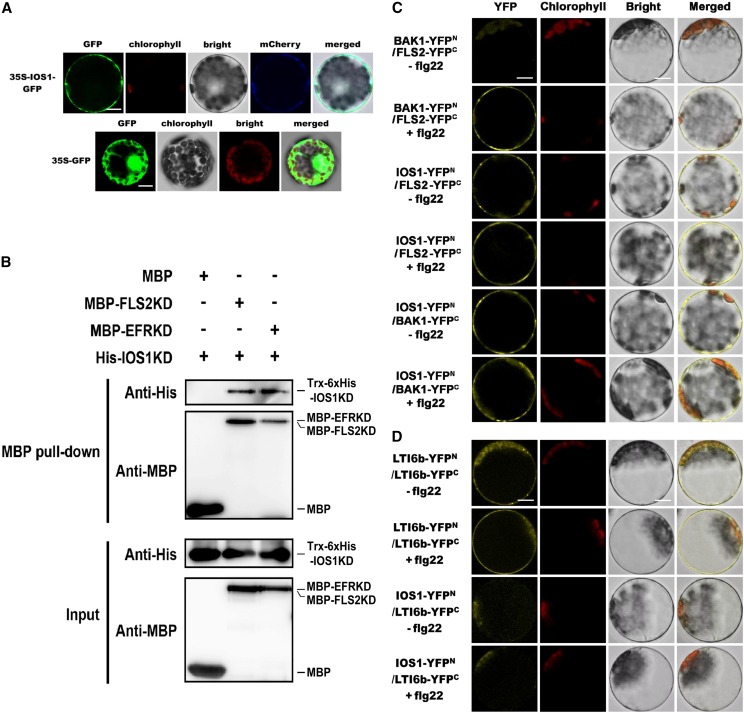
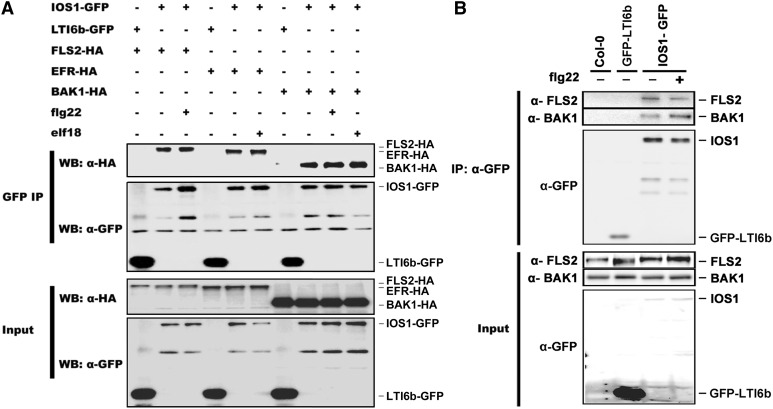
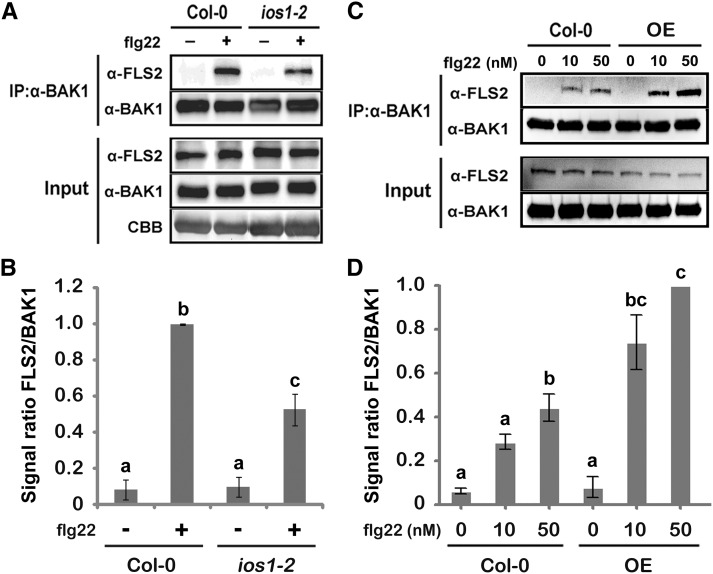
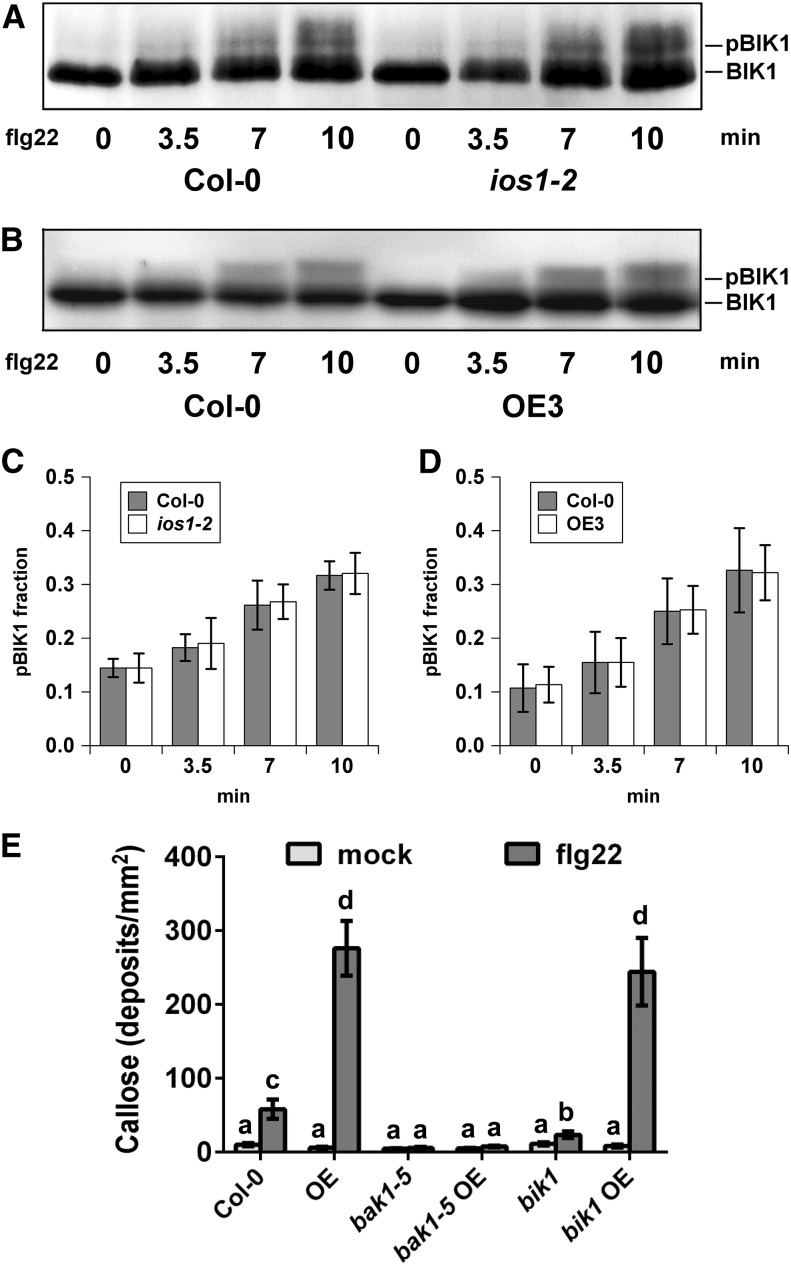
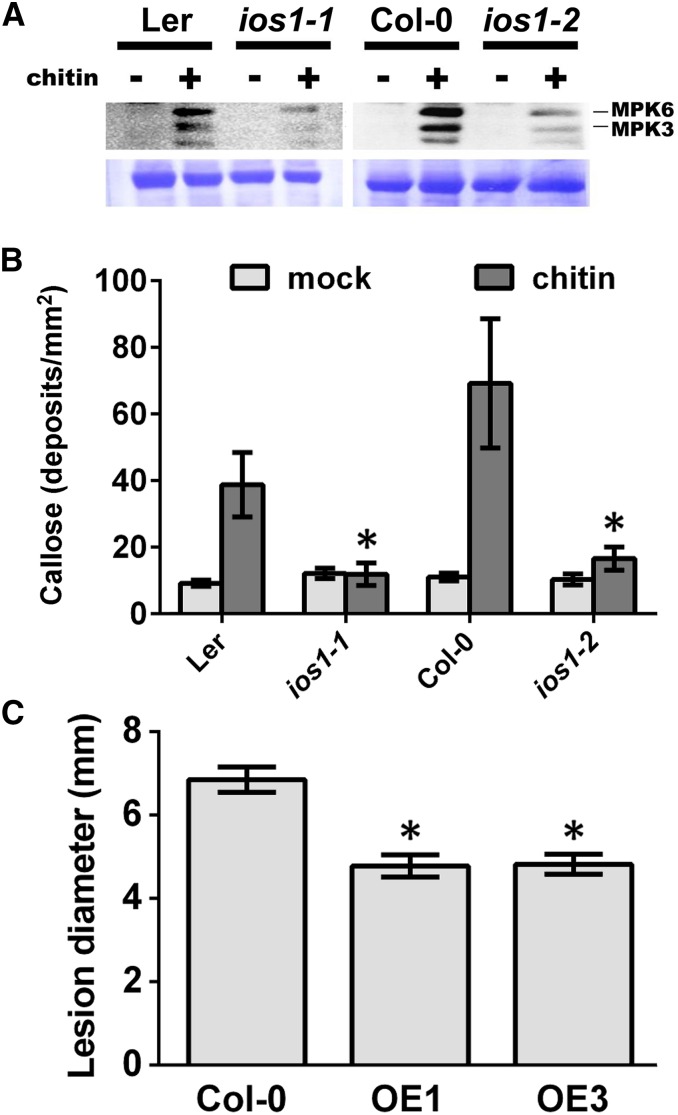
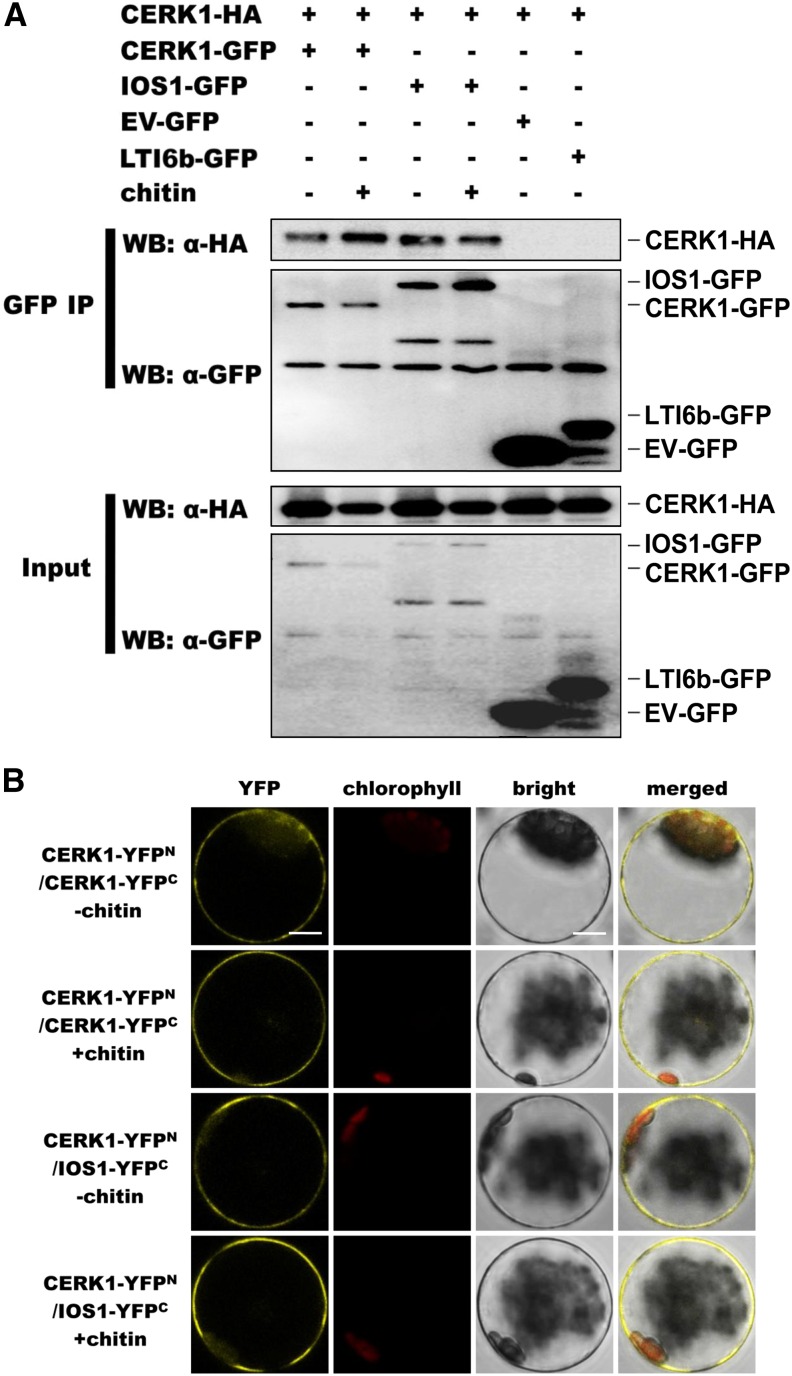
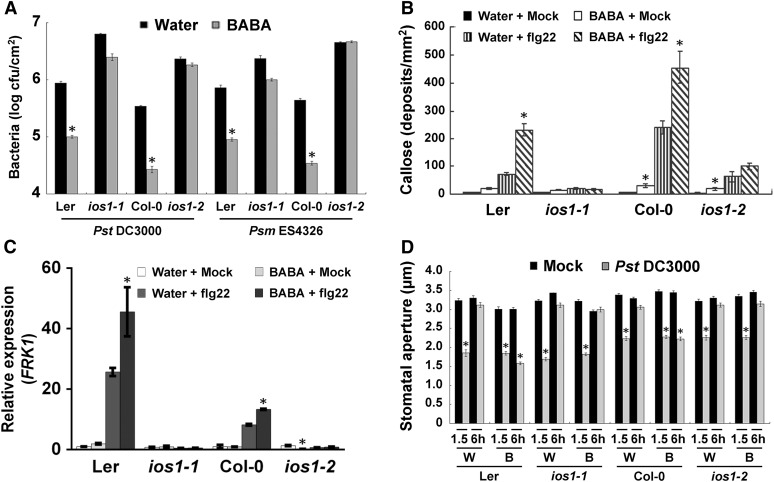
Plasma membrane-localized pattern recognition receptors (PRRs) such as FLAGELLIN SENSING2 (FLS2), EF-TU RECEPTOR (EFR), and CHITIN ELICITOR RECEPTOR KINASE1 (CERK1) recognize microbe-associated molecular patterns (MAMPs) to activate pattern-triggered immunity (PTI). A reverse genetics approach on genes responsive to the priming agent β-aminobutyric acid (BABA) revealed IMPAIRED OOMYCETE SUSCEPTIBILITY1 (IOS1) as a critical PTI player. Arabidopsis thaliana ios1 mutants were hypersusceptible to Pseudomonas syringae bacteria. Accordingly, ios1 mutants showed defective PTI responses, notably delayed upregulation of the PTI marker gene FLG22-INDUCED RECEPTOR-LIKE KINASE1, reduced callose deposition, and mitogen-activated protein kinase activation upon MAMP treatment. Moreover, Arabidopsis lines overexpressing IOS1 were more resistant to bacteria and showed a primed PTI response. In vitro pull-down, bimolecular fluorescence complementation, coimmunoprecipitation, and mass spectrometry analyses supported the existence of complexes between the membrane-localized IOS1 and BRASSINOSTEROID INSENSITIVE1-ASSOCIATED KINASE1 (BAK1)-dependent PRRs FLS2 and EFR, as well as with the BAK1-independent PRR CERK1. IOS1 also associated with BAK1 in a ligand-independent manner and positively regulated FLS2-BAK1 complex formation upon MAMP treatment. In addition, IOS1 was critical for chitin-mediated PTI. Finally, ios1 mutants were defective in BABA-induced resistance and priming. This work reveals IOS1 as a novel regulatory protein of FLS2-, EFR-, and CERK1-mediated signaling pathways that primes PTI activation.


Figures

Figure 1.
Figure 1.
A Critical Role for IOS1 in Arabidopsis Resistance to Hemibiotrophic Bacteria. (A) Disease symptoms in ios1 mutants. Five-week-old Arabidopsis were dip-inoculated in a bacterial solution of 106 cfu/mL Pst DC3000 or 5 × 10⁵ cfu/mL Psm ES4326. Symptoms were evaluated at 3 dpi. These experiments were repeated at least twice with similar results. (B) Bacterial growth in ios1 mutants. Five-week-old Arabidopsis were dip-inoculated as in (A) and bacterial titers were evaluated at 2 dpi. Values are means ± se of two independent experiments each consisting of three plants (n = 6). Asterisks indicate a significant difference to the respective wild-type control based on a paired two-tailed t test (P < 0.01). (C) Growth of Pst DC3000 in lines overexpressing IOS1. Bacterial titers in 5-week-old Col-0 and IOS1 overexpression lines OE1 and OE3 were determined at 3 dpi with 106 cfu/mL Pst DC3000. Values are means ± se of three independent biological replicates each with three plants (n = 9). Asterisks indicate a significant difference to Col-0 wild-type based on a paired two-tailed t test (*P < 0.01). (D) Stomatal innate immunity in lines overexpressing IOS1. Stomatal apertures in leaf epidermal peels from 5-week-old Col-0 and IOS1 overexpression lines OE1 and OE3 were analyzed after 1.5 or 3 h exposure to MgSO4 (Mock) or 108 cfu/mL Pst DC3000. Values are shown as means ± se of three independent experiments each consisting of at least 60 stomata (n > 180). Asterisks indicate a significant difference to respective mock controls based on a paired two-tailed t test analysis (P < 0.001).
Figure 2.
Figure 2.
Altered Late PTI Responses in ios1 Mutants and IOS1-OE Lines. (A) and (C) Callose deposition. Leaves of 5-week-old ios1-1 and ios1-2 (A) were syringe infiltrated with 1 µM flg22 or elf26 and samples were collected 9 h (flg22) or 24 h (elf26) later for aniline blue staining. For IOS1-OE lines (C), leaves of 5-week-old Arabidopsis or 10-d-old seedlings were respectively syringe infiltrated with 1 µM flg22 or treated with 100 nM elf18 and samples were collected 6 h (flg22) or 16 h (elf18) later for aniline blue staining. Mock samples were infiltrated with MgSO4 (for flg22 and elf26) or water (for elf18). Numbers under the pictures are average ± sd of the number of callose deposits per square millimeter from at least two independent experiments each consisting of 6 plants (n = 12). Bar = 200 µm. (B) and (D) PTI-responsive gene FRK1 upregulation. Relative FRK1 expression levels were evaluated at 30 min posttreatment with 100 nM flg22 or elf18 in ios1-1 and ios1-2 mutants (B) or at 45 min posttreatment with 50 nM flg22 or elf18 in IOS1-OE lines (D). UBQ10 was used for normalization. Relative gene expression levels were compared with wild-type mock (Ler-0 or Col-0) (defined value of 1) by RT-qPCR analyses. The values are means ± sd of two independent experiments each with three batches of 20 plantlets (n = 6). Asterisks indicate a significant difference to wild-type controls based on a paired two-tailed t test (P < 0.01).
Figure 3.
Figure 3.
Early PTI Responses. (A) ROS production in ios1 mutants. Responsiveness of 5-week-old Ler-0 and Col-0 wild-type controls and respective mutants ios1-1 and ios1-2 to 10 nM flg22. bak1-4 was used as a negative control. Production of ROS in Arabidopsis leaf discs is expressed as relative light units (RLU) for a period of 30 min after elicitation. Values are means ± se of three independent experiments each with six leaf discs (n = 18). Differences between ios1 mutants and the wild type were not statistically significant based on a paired two-tailed t test (P < 0.01). (B) ROS production in IOS1-OE lines. Responsiveness of 5-week-old overexpression lines OE1 and OE3 and Col-0 wild-type control to 10 nM flg22. Production of ROS in Arabidopsis leaf discs is expressed as relative light units for a period of 30 min after elicitation. Values are means ± se of three independent experiments each with six leaf discs (n = 18). Differences between OE lines and the wild type were not statistically significant based on a paired two-tailed t test (P < 0.01). (C) MPK activation in ios1 mutants. Ten-day-old Ler-0 and ios1-1 or Col-0 and ios1-2 were treated with 100 nM flg22 for 5 min. Immunoblot analysis using phospho-p44/42 MPK antibody is shown in top panel. Lines indicate the positions of MPK3 and MPK6. Coomassie blue staining is used to estimate equal loading in each lane (bottom panel). Similar results were observed in another independent repeat. (D) MAPK activation in IOS1-OE lines. Ten-day-old Col-0 and IOS1 overexpression lines OE1 and OE3 were treated with 50 nM flg22 for 5 min. Immunoblot analysis using phospho-p44/42 MAP kinase antibody is shown in the top panel. Lines indicate the positions of MPK3 and MPK6. Coomassie blue staining is used to estimate equal loading in each lane (bottom panel). Similar results were observed in another independent repeat.
Figure 4.
Figure 4.
IOS1 Localization, Pull-Down, and BiFC Analyses of IOS1 Interaction with PRRs. (A) Subcellular localization of IOS1-GFP fusion protein in Arabidopsis mesophyll protoplasts. IOS1-GFP expression was driven by the cauliflower mosaic virus 35S promoter and transiently expressed in Arabidopsis mesophyll protoplasts. The images of the GFP fluorescence (GFP), the chlorophyll autofluorescence (chlorophyll), the bright-field image (bright), the plasma membrane marker (pm-rk CD3-1007)-mCherry fluorescence localization, and the combined images (merged) are shown. Similar observations were made in another independent repeat. Bars = 10 µm. (B) In vitro MBP pull-down assay of IOS1 interaction with FLS2 and EFR. E. coli expressed MBP (negative control), MBP-FLS2KD, or MBP-EFRKD were incubated with Trx-6xHis-IOS1KD and pulled down with amylose resin beads. Input and bead-bound proteins were analyzed by immunoblotting with specific antibodies. Experiments were repeated three times with similar results. (C) BiFC analyses of IOS1 interactions with FLS2 and BAK1. Arabidopsis protoplasts were cotransfected with BAK1-YFPN + FLS2-YFPC, IOS1-YFPN + FLS2-YFPC, and IOS1-YFPN + BAK1-YFPC and treated with (+) or without (–) 100 nM flg22 for 10 min. The YFP fluorescence (yellow), chlorophyll autofluorescence (red), bright-field, and the combined images were visualized under a confocal microscope 16 h after transfection. Images are representative of multiple protoplasts. Experiments were repeated at least twice with similar results. Bars = 10 µm. (D) BiFC of LTI6b and IOS1 interaction. Arabidopsis protoplasts were cotransfected with LTI6b-YFPN + LTI6b-YFPC or IOS1-YFPN + LTI6b-YFPC and treated with (+) or without (−) 100 nM flg22 for 10 min. The YFP fluorescence (yellow), chlorophyll autofluorescence (red), bright-field, and the combined images were visualized under a confocal microscope 16 h after transfection. Images are representative of multiple protoplasts. Experiments were repeated twice with similar results. Bars = 10 µm.
Figure 5.
Figure 5.
IOS1 Associates with Unstimulated and Stimulated FLS2, EFR, and BAK1. (A) Coimmunoprecipitation of IOS1, FLS2, EFR, and BAK1 proteins. Arabidopsis protoplasts expressing IOS1-GFP and FLS2-HA3 (lanes 2 and 3), IOS1-GFP and EFR-HA3 (lanes 5 and 6), or IOS1-GFP and BAK1-HA3 (lanes 8 to 10) constructs were treated (+) or not (−) with 100 nM flg22 or elf18 for 10 min. LTI6b-GFP, a known plasma membrane protein, was used as a control to illustrate that FLS2-HA3, EFR-HA3, and BAK1-HA3 do not associate with GFP at the plasma membrane (lanes 1, 4, and 7). Total proteins (input) were subjected to immunoprecipitation with GFP trap beads followed by immunoblot analysis with anti-HA antibodies to detect FLS2-HA3, EFR-HA3, and BAK1-HA3. Anti-GFP antibodies detect IOS1-GFP and LTI6b-GFP. Experiments were repeated twice with similar results. (B) Coimmunoprecipitation of FLS2, BAK1, and IOS1 proteins in Arabidopsis. Transgenic Arabidopsis seedlings overexpressing IOS1-GFP (OE3) were treated (+) or not (−) with 100 nM flg22 for 10 min. Total proteins (input) were subjected to immunoprecipitation with anti-GFP magnetic beads followed by immunoblot analysis with anti-FLS2 antibodies, anti-BAK1 antibodies, or anti-GFP antibodies to detect FLS2, BAK1, and IOS1-GFP. Untransformed Col-0 Arabidopsis tissue was used as a control to show that FLS2 and BAK1 do not adhere nonspecifically to anti-GFP magnetic beads (lane 1). LTI6b, a known plasma membrane protein was used as a control to illustrate that FLS2 and BAK1 do not associate with GFP at the plasma membrane (lane 2). This experiment is one of two independent replicates.
Figure 6.
Figure 6.
IOS1 Regulates Ligand-Induced FLS2/BAK1 Association. (A) and (B) Ligand-dependent association of FLS2 to BAK1 is reduced in the ios1-2 mutant. Col-0 or ios1-2 seedlings were treated (+) or not (−) with 100 nM flg22 for 10 min. Total proteins (input) were subjected to immunoprecipitation (IP) with anti-BAK1 antibodies and IgG beads followed by immunoblot analysis using anti-FLS2 and anti-BAK1 antibodies. For (A), Coomassie blue (CBB) is used to estimate equal loading (bottom panel). The experiment shown in (A) is one of three independent replicates pooled together in (B). (C) and D) Ligand-dependent association of FLS2 to BAK1 is augmented in the IOS1-OE3 line. Col-0 or OE3 seedlings were treated with MgSO4 (0) or 10 or 50 nM flg22 for 10 min. Total proteins (input) were subjected to immunoprecipitation with anti-BAK1 antibodies and IgG beads followed by immunoblot analysis using anti-FLS2 and anti-BAK1 antibodies. The experiment shown in (C) is one of three independent replicates pooled together in (D). For both (B) and (D), signals were evaluated with the ImageJ software. Values are means ± sd of three independent biological replicates (n = 3). Different letters denote significant difference based on a one-way ANOVA with post-hoc Tukey HSD (P < 0.05).
Figure 7.
Figure 7.
IOS1 Functions in a BAK1-Dependent but BIK1-Independent Manner in the FLS2 Complex. (A) to (D) Immunoblot analysis of BIK1 phosphorylation revealed by gel mobility shift. Nonphosphorylated (BIK1) and phosphorylated (pBIK1) BIK1 signals are indicated. Protoplasts from Col-0 leaves and ios1-2 ([A] and [C]) or OE3 ([B] and [D]) were treated 4 h after transfection using 0.75 µM flg22 for 3.5, 7, and 10 min. The reaction was stopped by immersion in liquid nitrogen following concentration by low speed centrifugation. Experiments were repeated at least five times with similar results. For (C) and (D), phosphorylated over nonphosphorylated BIK1 fractions were calculated by measuring digital signals with the ImageJ software. Values are means ± sd of five independent biological replicates (n = 5). For each time point, differences between the wild type and the ios1-2 mutant or the OE3 line were not statistically significant based on a paired two-tailed t test (P < 0.01). (E) Callose deposition upon elicitation with flg22. Fourteen-day-old Col-0 wild-type, IOS1-OE3 (OE), bak1-5 or bik1 mutants, and IOS1-OE in bak1-5 or bik1 mutant background were treated with 100 nM flg22 and samples were collected 16 h later for aniline blue staining. Each bar represents average ± se of callose deposits per square millimeter from two independent experiments each with six plants (n = 12). For IOS1-OE lines in the bak1-5 and bik1 backgrounds, data represent two independent transformation events for each genotype. Different letters denote significant differences among different lines based on a one-way ANOVA with post-hoc Tukey HSD (P < 0.01).
Figure 8.
Figure 8.
A Role for IOS1 in the Chitin Response. (A) MPK activation upon elicitation with chitin. Fourteen-day-old seedlings from Ler-0 or Col-0 wild type, ios1-1, or ios1-2 were syringe-infiltrated with 0.2 mg/mL chitin for 5 min. Immunoblot analysis using phospho-p44/42 MPK antibody is shown in top panel. Lines indicate the positions of MPK3 and MPK6. Coomassie blue staining is used to estimate equal loading in each lane (bottom panel). An independent experiment showed similar results. (B) Callose deposition upon elicitation with chitin. Fourteen-day-old seedlings from Ler-0 and ios1-1 or Col-0 and ios1-2 were treated with 0.2 mg/mL chitin and samples were collected 16 h later for aniline blue staining. Numbers are averages ± se of callose deposits per square millimeters from two independent experiments each including six seedlings (n = 12). Asterisks indicate a significant difference to wild-type controls based on a paired two-tailed t test (P < 0.01). (C) B. cinerea-mediated lesions. Arabidopsis leaves of Col-0 and IOS1 overexpression lines were droplet-inoculated (10 μL) with 105 B. cinerea spores/mL and lesion diameters were evaluated at 3 dpi. Data are average ± se of lesion diameters from two independent experiments each with six plants (n = 12). Asterisks indicate a significant difference to wild-type controls based on a paired two-tailed t test (P < 0.01).
Figure 9.
Figure 9.
IOS1 Associates with CERK1. (A) Coimmunoprecipitation of IOS1 with CERK1 proteins in Arabidopsis protoplasts. Arabidopsis protoplasts expressing CERK1-GFP and CERK1-HA3 (lanes 1 and 2), IOS1-GFP and CERK1-HA3 (lanes 3 and 4), EV-GFP and CERK1-HA3 (lane 5), or LTI6b-GFP and CERK1-HA3 (lane 6) constructs were treated with (+) or without (−) 0.2 mg/mL chitin for 10 min. Total proteins (input) were subjected to immunoprecipitation (IP) with GFP trap beads followed by immunoblot analysis with anti-HA antibodies to detect CERK1-HA3. EV-GFP and LTI6b-GFP, a known plasma membrane protein, were used as controls to illustrate that CERK1-HA3 does not stick to GFP beads or associate with GFP at the plasma membrane, respectively. This experiment was repeated twice with similar results. (B) BiFC analyses of IOS1 interactions with CERK1. Arabidopsis protoplasts were cotransfected with CERK1-YFPN + CERK1-YFPC and CERK1-YFPN + IOS1-YFPC, and treated with (+) or without (−) 0.2 mg/mL chitin for 10 min. The YFP fluorescence (yellow), chlorophyll autofluorescence (red), bright-field, and the combined images were visualized under a confocal microscope 16 h after transfection. Images are representative of multiple protoplasts. At least two independent experiments were performed with similar results. Bars = 10 μm.
Figure 10.
Figure 10.
BABA Action Is Defective in ios1 Mutants. (A) BABA-induced resistance. Bacterial titers in 5-week-old Ler-0, ios1-1, Col-0, and ios1-2 were determined at 2 dpi with 106 cfu/mL Pst DC3000 or 5 × 10⁵ cfu/mL Psm ES4326. Two days before bacterial inoculation, plants were soil-drenched with water as a control or 225 µM BABA. Values are means ± se of three independent experiments each with three plants (n = 9). Asterisks indicate a significant difference to respective water-treated control based on a paired two-tailed t test (P < 0.01). (B) BABA priming of PTI-mediated callose deposition. Leaves of water- or BABA-pretreated (225 µM) Ler-0 and ios1-1 or Col-0 and ios1-2 were syringe-infiltrated with 1 µM flg22 and samples were collected 6 h later for aniline blue staining. Values are average ± sd from three independent experiments each consisting of nine plants (n = 27). Asterisks indicate a significant difference to water-treated respective controls based on a paired two-tailed t test (P < 0.01). (C) BABA priming of PTI-mediated FRK1 expression. Ten-day-old Ler-0 and ios1-1 or Col-0 and ios1-2 seedlings grown on 0.5× MS medium supplemented with 30 µM BABA (BABA) or not (Water) were submerged with water (Mock) or 1 µM flg22, and FRK1 expression levels were analyzed 60 min later by RT-qPCR. UBQ10 was used for normalization. Relative gene expression levels were compared with respective water + mock-treated wild type (defined value of 1). Values are means ± sd of two independent experiments each with three plants (n = 6). Asterisks indicate a significant difference to water-treated respective controls based on a paired two-tailed t test (P < 0.01). (D) BABA inhibition of bacteria-mediated stomatal reopening. Stomatal apertures in epidermal peels from water- (W) or BABA-treated (225 µM) (B) Ler-0 and ios1-1 or Col-0 and ios1-2 were analyzed after 1.5 and 6 h exposure to MgSO4 (Mock) or 108 Pst DC3000. Results are shown as mean ± se of three independent experiments each consisting of at least 60 stomata (n > 180). Asterisks indicate a significant difference to respective mock controls based on a paired two-tailed t test analysis (P < 0.001).

References

    1. Asai T., Tena G., Plotnikova J., Willmann M.R., Chiu W.L., Gomez-Gomez L., Boller T., Ausubel F.M., Sheen J. (2002). MAP kinase signalling cascade in Arabidopsis innate immunity. Nature 415: 977–983. - PubMed
    1. Beckers G.J.M., Jaskiewicz M., Liu Y., Underwood W.R., He S.Y., Zhang S., Conrath U. (2009). Mitogen-activated protein kinases 3 and 6 are required for full priming of stress responses in Arabidopsis thaliana. Plant Cell 21: 944–953. - PMC - PubMed
    1. Böhm H., Albert I., Fan L., Reinhard A., Nürnberger T. (2014). Immune receptor complexes at the plant cell surface. Curr. Opin. Plant Biol. 20: 47–54. - PubMed
    1. Boller T., Felix G. (2009). A renaissance of elicitors: perception of microbe-associated molecular patterns and danger signals by pattern-recognition receptors. Annu. Rev. Plant Biol. 60: 379–406. - PubMed
    1. Boudsocq M., Willmann M.R., McCormack M., Lee H., Shan L., He P., Bush J., Cheng S.H., Sheen J. (2010). Differential innate immune signalling via Ca(2+) sensor protein kinases. Nature 464: 418–422. - PMC - PubMed

MeSH terms