. 2016 Oct 1;32(19):2973-80.
doi: 10.1093/bioinformatics/btw372. Epub 2016 Jun 17.

Pseudotime estimation: deconfounding single cell time series

Affiliations

Pseudotime estimation: deconfounding single cell time series

John E Reid et al. Bioinformatics. .

Abstract

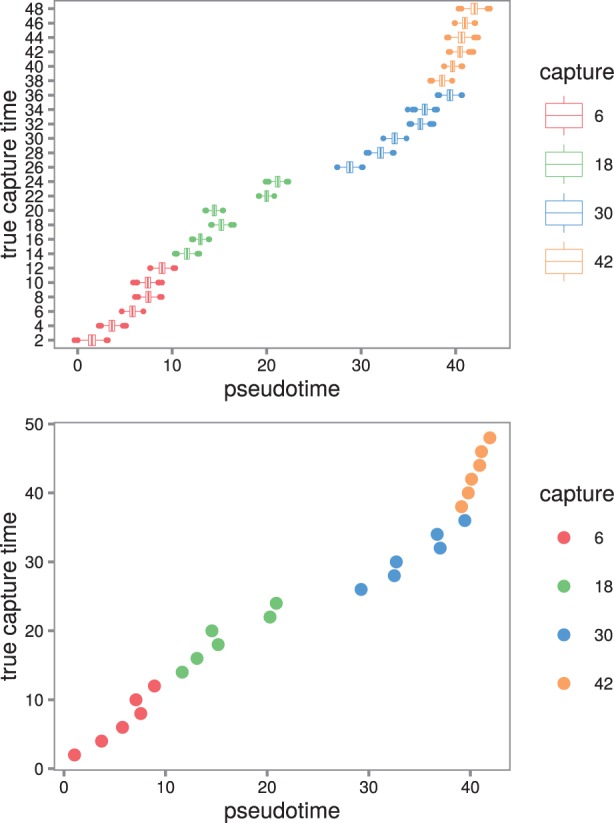
Motivation: Repeated cross-sectional time series single cell data confound several sources of variation, with contributions from measurement noise, stochastic cell-to-cell variation and cell progression at different rates. Time series from single cell assays are particularly susceptible to confounding as the measurements are not averaged over populations of cells. When several genes are assayed in parallel these effects can be estimated and corrected for under certain smoothness assumptions on cell progression.

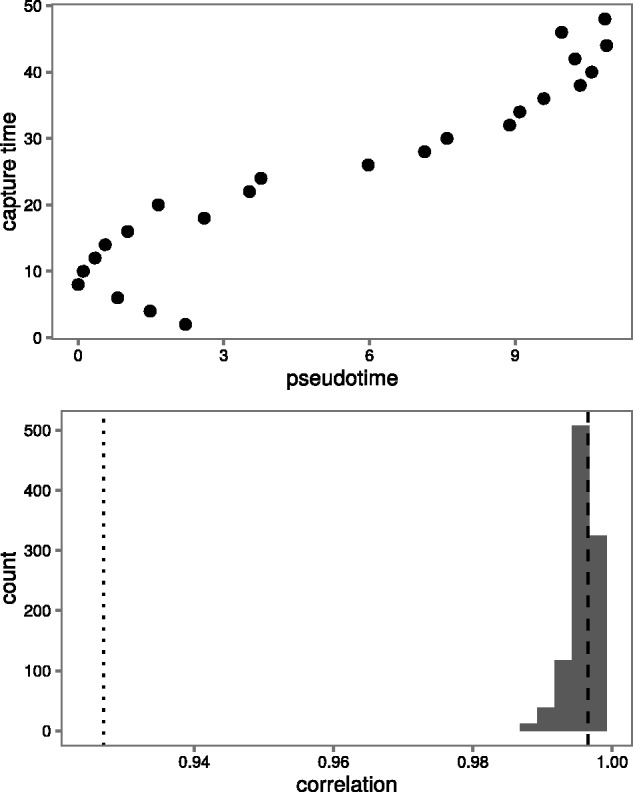
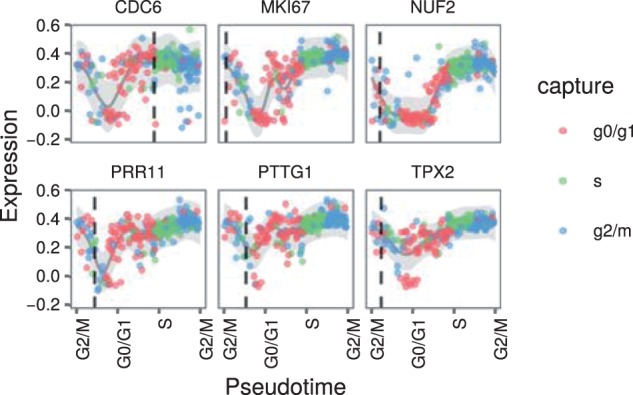
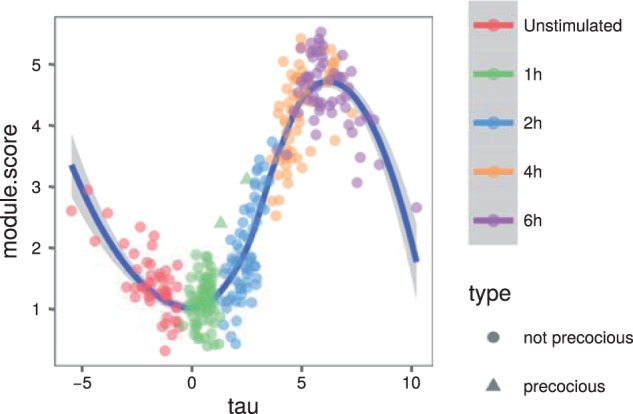
Results: We present a principled probabilistic model with a Bayesian inference scheme to analyse such data. We demonstrate our method's utility on public microarray, nCounter and RNA-seq datasets from three organisms. Our method almost perfectly recovers withheld capture times in an Arabidopsis dataset, it accurately estimates cell cycle peak times in a human prostate cancer cell line and it correctly identifies two precocious cells in a study of paracrine signalling in mouse dendritic cells. Furthermore, our method compares favourably with Monocle, a state-of-the-art technique. We also show using held-out data that uncertainty in the temporal dimension is a common confounder and should be accounted for in analyses of repeated cross-sectional time series.

Availability and implementation: Our method is available on CRAN in the DeLorean package.

Contact: john.reid@mrc-bsu.cam.ac.uk

Supplementary information: Supplementary data are available at Bioinformatics online.


Figures

Fig. 1.
Fig. 1.
Pseudotime estimates for the samples from the Windram et al.’t (2012) Arabidopsis data. (Top) Boxplots of the full pseudotime posteriors. The estimated pseudotimes are in good agreement with the true capture times. The model tends to spread the samples out around the 20-h mark in pseudotime. Presumably the expression profiles vary the most at this point. In addition, the samples are spread out more broadly in pseudotime (between -20 and 60 h) compared to the true capture times. (Bottom) The pseudotimes estimated by the best sample from the posterior plotted against the true capture times
Fig. 2.
Fig. 2.
A comparison of the performance of our method and the Monocle algorithm. (Top) Pseudotimes predicted by the Monocle algorithm (ρ=0.927). (Bottom) Posterior of the Spearman correlation between estimated pseudotimes from our model and true capture times. The Spearman correlation of the Monocle pseudotimes with the true capture times is shown as a dotted line. The Spearman correlation of the best sample with the true capture times is shown as a dashed line
Fig. 3.
Fig. 3.
Expression profiles over pseudotime from the McDavid et al. (2014) cell cycle data. The pseudotimes are those from the best sample. Note the circular x axis: the first and last labels are both for the G2/M stage. The genes were selected based on high ratios of temporal variance to noise. Each point represents the expression of the given gene in a cell. The points are coloured by the cell cycle stage with which the cell was labelled by McDavid et al. The dark grey line represents the posterior mean of the expression profile for the gene and the shaded grey ribbon represents two standard deviations either side of this mean. The vertical dotted lines are the peak times as defined by the CycleBase database
Fig. 4.
Fig. 4.
The module score (as defined by Shalek et al.) of core antiviral genes over pseudotime. The two precocious cells captured at 1 h are plotted as triangles. These two cells have been placed at a later pseudotime than the other cells captured at 1 h. A Loess curve has also been plotted through the data

References

    1. Äijö T., Lähdesmäki H. (2009) Learning gene regulatory networks from gene expression measurements using non-parametric molecular kinetics. Bioinformatics, 25, 2937–2944. - PubMed
    1. Äijö T. et al. (2014) Methods for time series analysis of RNA-seq data with application to human Th17 cell differentiation. Bioinformatics, 30, i113–i120. - PMC - PubMed
    1. Bendall S.C. et al. (2014) Single-cell trajectory detection uncovers progression and regulatory coordination in human B cell development. Cell, 157, 714–725. - PMC - PubMed
    1. Brennecke P. et al. (2013) Accounting for technical noise in single-cell RNA-seq experiments. Nat. Methods, 10, 1093–1095. - PubMed
    1. Brooks S.P., Gelman A. (1998) General methods for monitoring convergence of iterative simulations. J. Comput. Graph. Stat., 7, 434–455.