

Flow of Red Blood Cells in Stenosed Microvessels
- PMID: 27319318
- PMCID: PMC4913314
- DOI: 10.1038/srep28194
Flow of Red Blood Cells in Stenosed Microvessels
Abstract
A computational study is presented on the flow of deformable red blood cells in stenosed microvessels. It is observed that the Fahraeus-Lindqvist effect is significantly enhanced due to the presence of a stenosis. The apparent viscosity of blood is observed to increase by several folds when compared to non-stenosed vessels. An asymmetric distribution of the red blood cells, caused by geometric focusing in stenosed vessels, is observed to play a major role in the enhancement. The asymmetry in cell distribution also results in an asymmetry in average velocity and wall shear stress along the length of the stenosis. The discrete motion of the cells causes large time-dependent fluctuations in flow properties. The root-mean-square of flow rate fluctuations could be an order of magnitude higher than that in non-stenosed vessels. Several folds increase in Eulerian velocity fluctuation is also observed in the vicinity of the stenosis. Surprisingly, a transient flow reversal is observed upstream a stenosis but not downstream. The asymmetry and fluctuations in flow quantities and the flow reversal would not occur in absence of the cells. It is concluded that the flow physics and its physiological consequences are significantly different in micro- versus macrovascular stenosis.
Figures
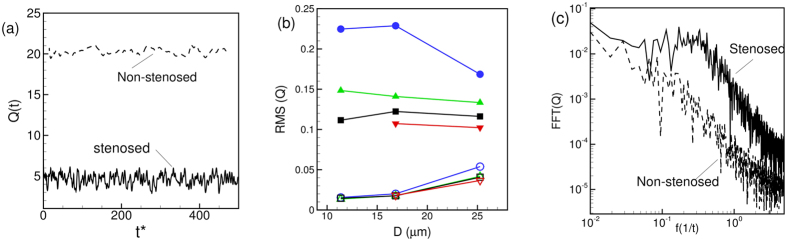
 versus vessel diameter for β = 1 (O), 2 (Δ), 3 (◻), and 4 (∇); filled symbols are for stenosed vessels, and unfilled symbols for non-stenosed vessels. (c) Representative FFT of flow rate
  for stenosed (—) and non-stenosed (- - - - -) vessels.
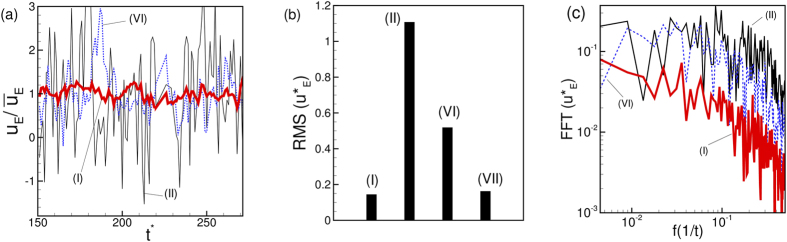
 at a fixed radial distance 1.2 μm (near the edge of the CFL) from the wall but at three different streamwise locations: At a location far upstream (red thick line, location (I) as defined in Fig. 1), at the beginning of stenosis (black thin line, location II), and at the end of stenosis (blue dotted line, location VI). The Eulerian velocity has been scaled by the time-averaged velocity at the same location as
  . (b) RMS of fluctuations of
  for the cases shown in (a). Also added is the RMS at a location far downstream marked as (VII). (c) Spectra of
  for the three cases shown in (a). Here D = 25 μm, β = 3, and Ht = 24%.
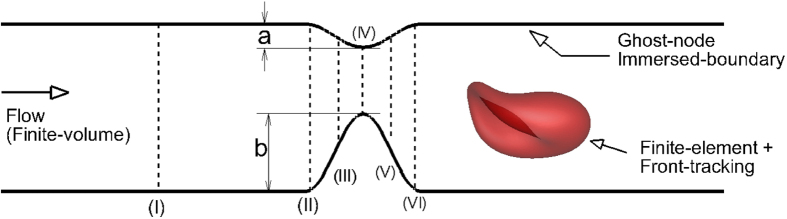
 = 84%, and Ht = 24%. Here R is the vessel radius in non-stenosed section.
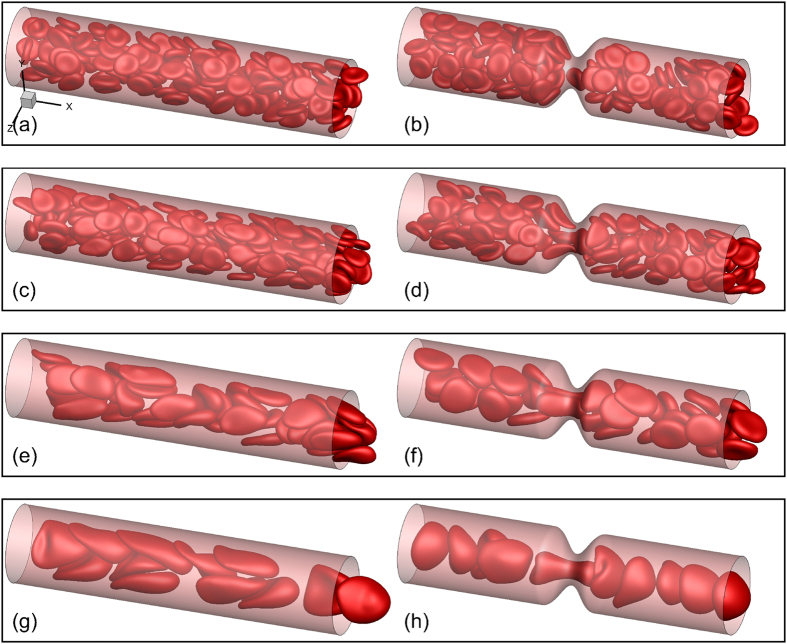
 = 84%, β = 1, and Ht = 24%.
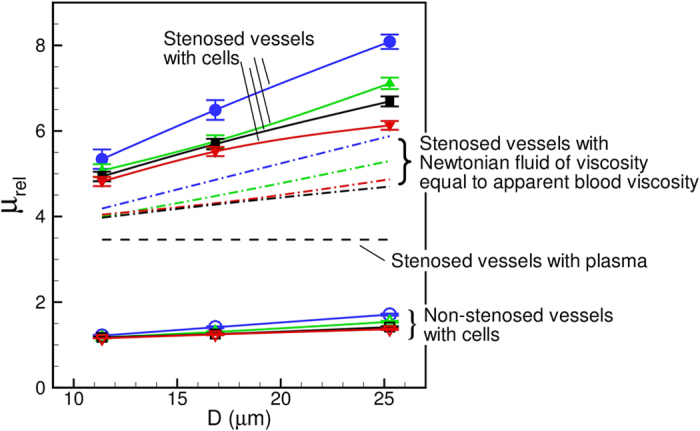
 = 84%, Ht ≈ 22–24%) with RBCs, for various values of
  = 1 (O, blue), 2 (Δ, green), 3 (◻, black), 4 (∇, red). Dash line is for stenosed tubes with plasma only. Dash-dot lines are for stenosed tubes with Newtonian fluids having viscosities same as the apparent viscosity of blood in non-stenosed tubes of the same diameters.
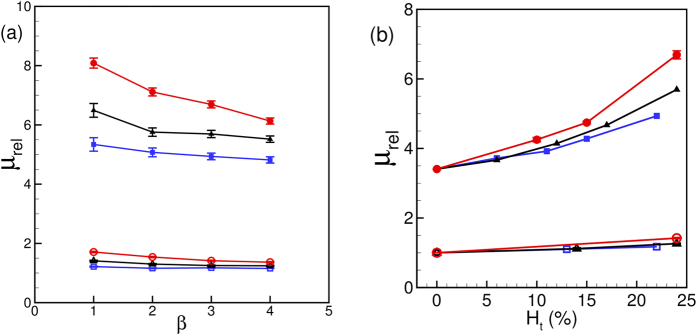
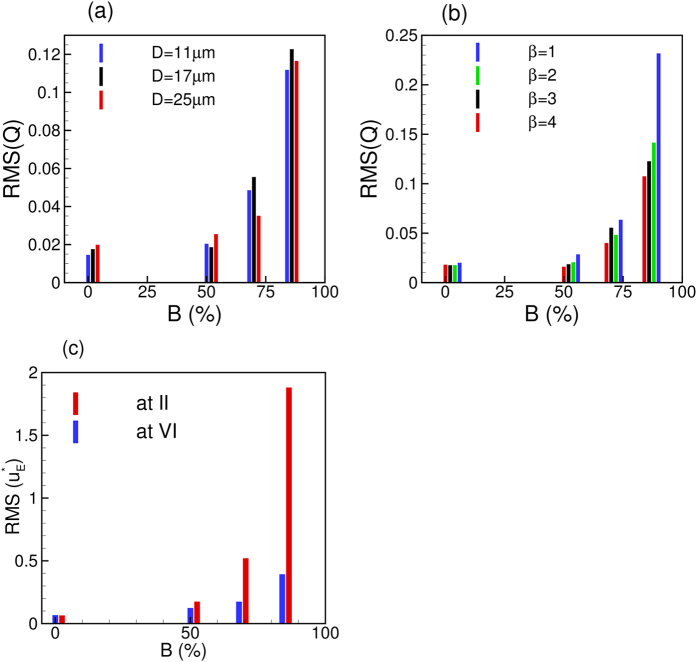
 on RMS of flow rate oscillations for different vessels at constant β = 3. (b) Effect of
  on RMS(Q) for different β but at constant D = 17 μm. (c) Effect of
  on Eulerian velocity fluctuations at locations II (upstream) and VI (downstream). Here D = 17 μm and β = 3. For all cases, Ht = 23%.
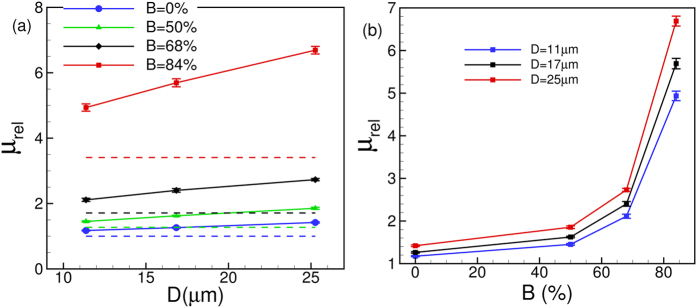
 on the Fahraeus-Lindqvist effect. The dash lines are for plasma. (b) μrel versus
  for different vessels.
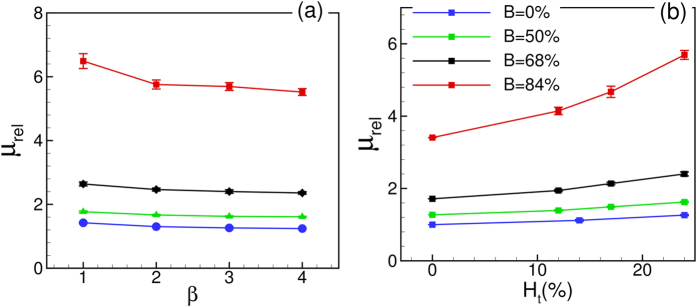
 . In (a) Ht = 23%, and in (b) β = 3. For all cases D = 17 μm.
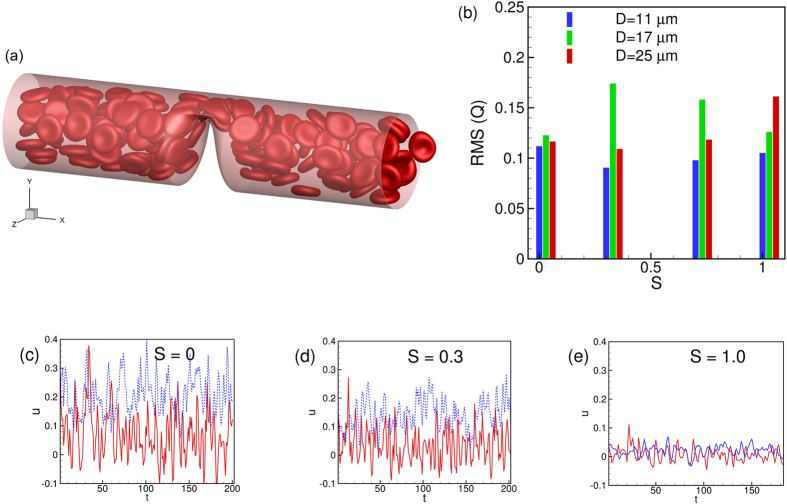
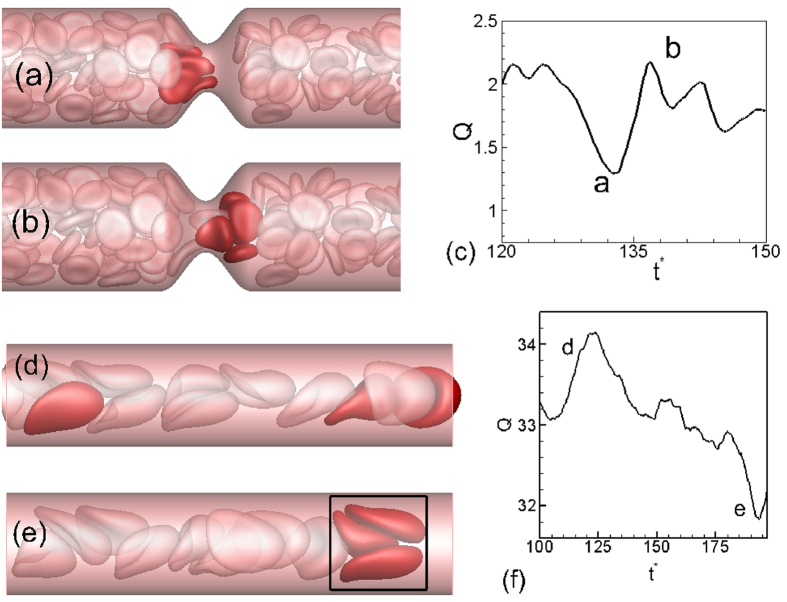
 = 1, β = 1, Ht = 24%). (b) Effect of
  on RMS of flow rate. (c,d,e) shows the effect of
  on time-dependent Eulerian velocity at locations II (continuous red line) and VI (dotted blue line).
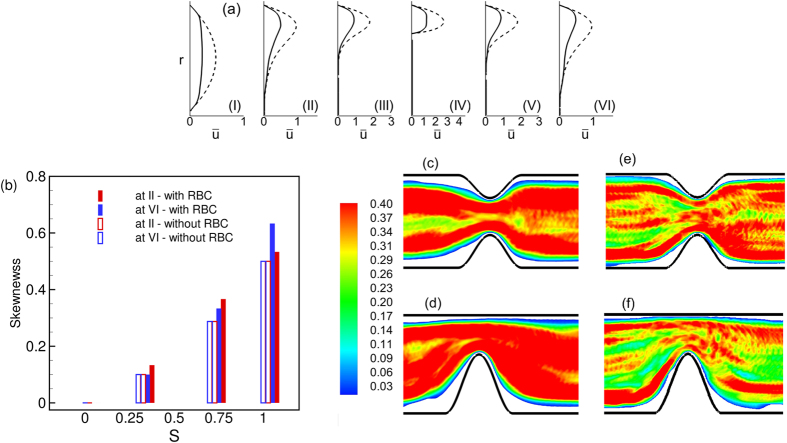
 = 1, D = 17 μm. (b) Skewness of velocity profiles as a function of
  at locations II and VI. (c,d) RBC distribution in D = 17 μm for
  = 0.3 and 1, respectively. (e,f) Same but in D = 25 μm.
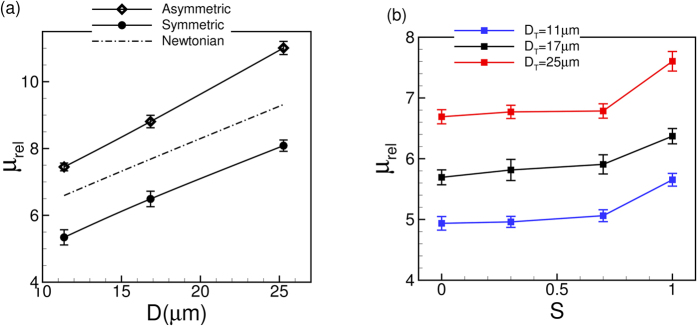
 = 0 and 1. The dash-dot line is the relative viscosity obtained in the asymmetric stenosis for a Newtonian fluid having viscosity equal to the apparent blood viscosity in non-stenosed tubes. (b) Variation of μrel with respect to S for different vessels.
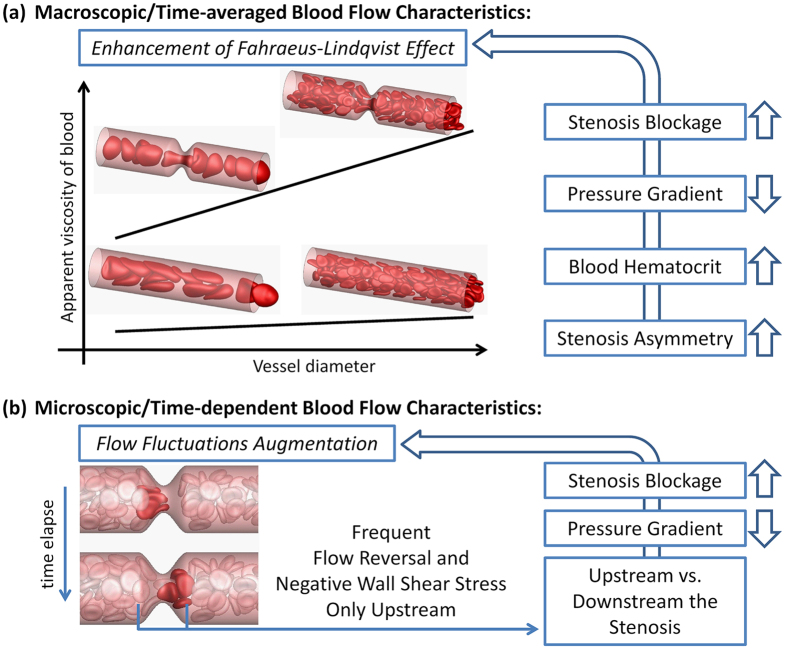
References
-
- Wootton D. M. & Ku D. N. Fluid mechanics of vascular systems, diseases, and thrombosis. Annu. Rev. Biomed. Eng. 1, 299–329 (1999). - PubMed
-
- Ku D. N. Blood flow in arteries. Ann. Rev. Fluid Mech. 29, 399–434 (1997).
-
- Giddens D. P., Zarins C. K. & Glagov S. The role of fluid mechanics in the localization and detection of atherosclerosis. J. Biomech. Eng. 115, 588–594 (1993). - PubMed
Publication types
MeSH terms
LinkOut - more resources
Full Text Sources
Other Literature Sources
