. 2016 Jun 20:6:28006.
doi: 10.1038/srep28006.

Circulating Plasma microRNAs can differentiate Human Sepsis and Systemic Inflammatory Response Syndrome (SIRS)

Affiliations

Circulating Plasma microRNAs can differentiate Human Sepsis and Systemic Inflammatory Response Syndrome (SIRS)

Stefano Caserta et al. Sci Rep. .

Abstract

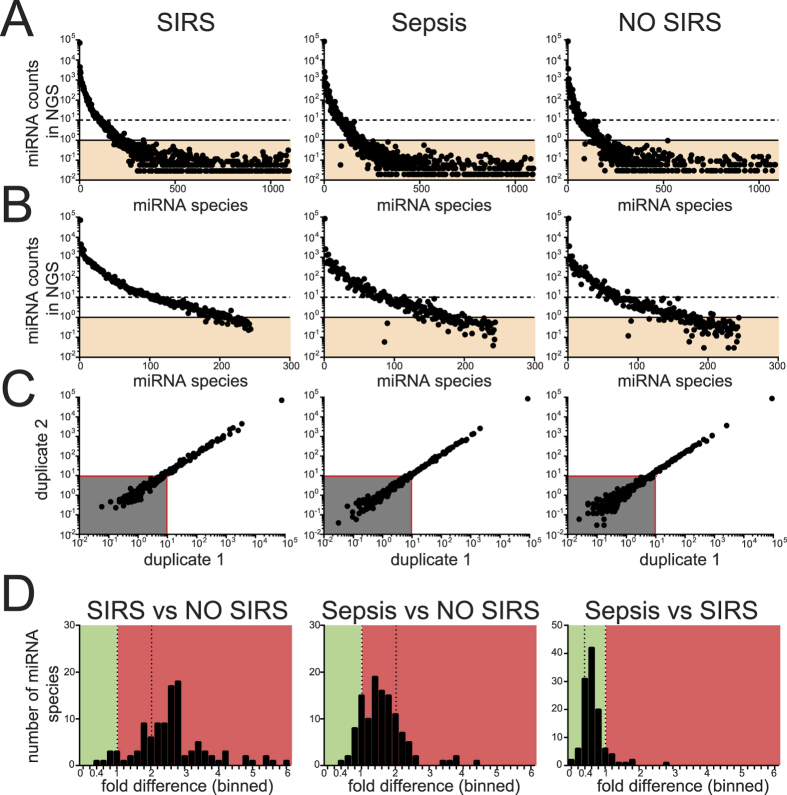
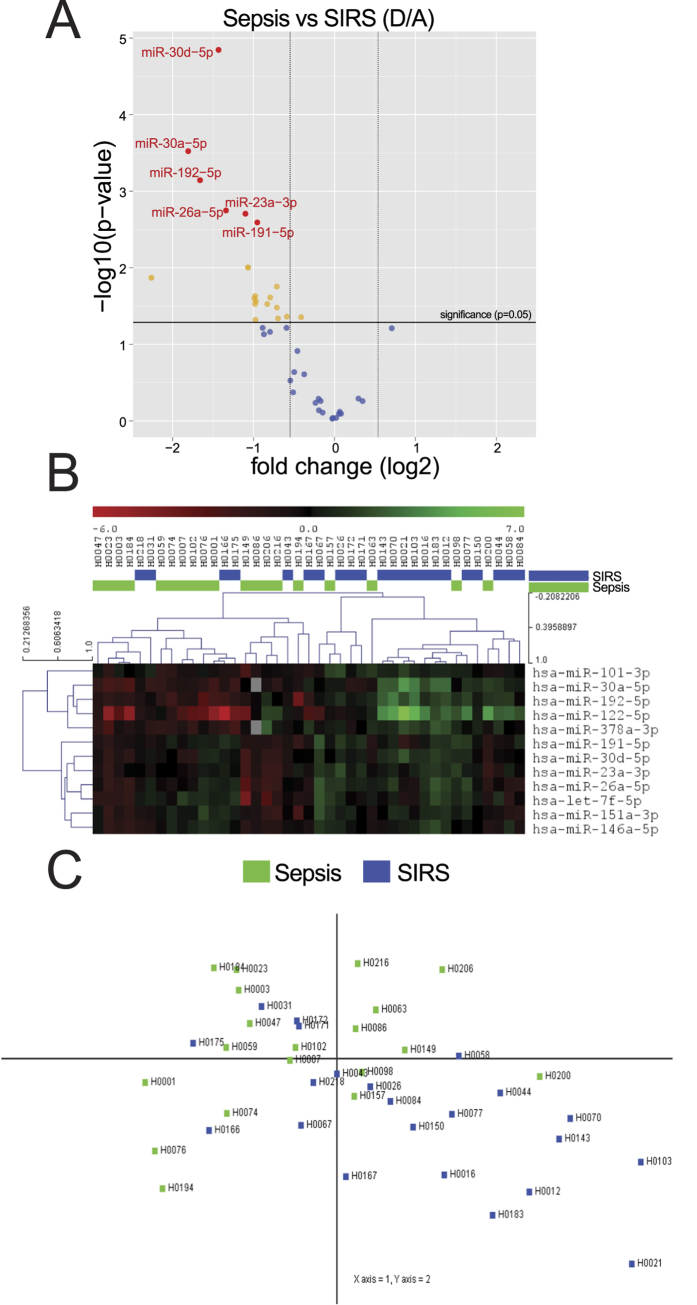
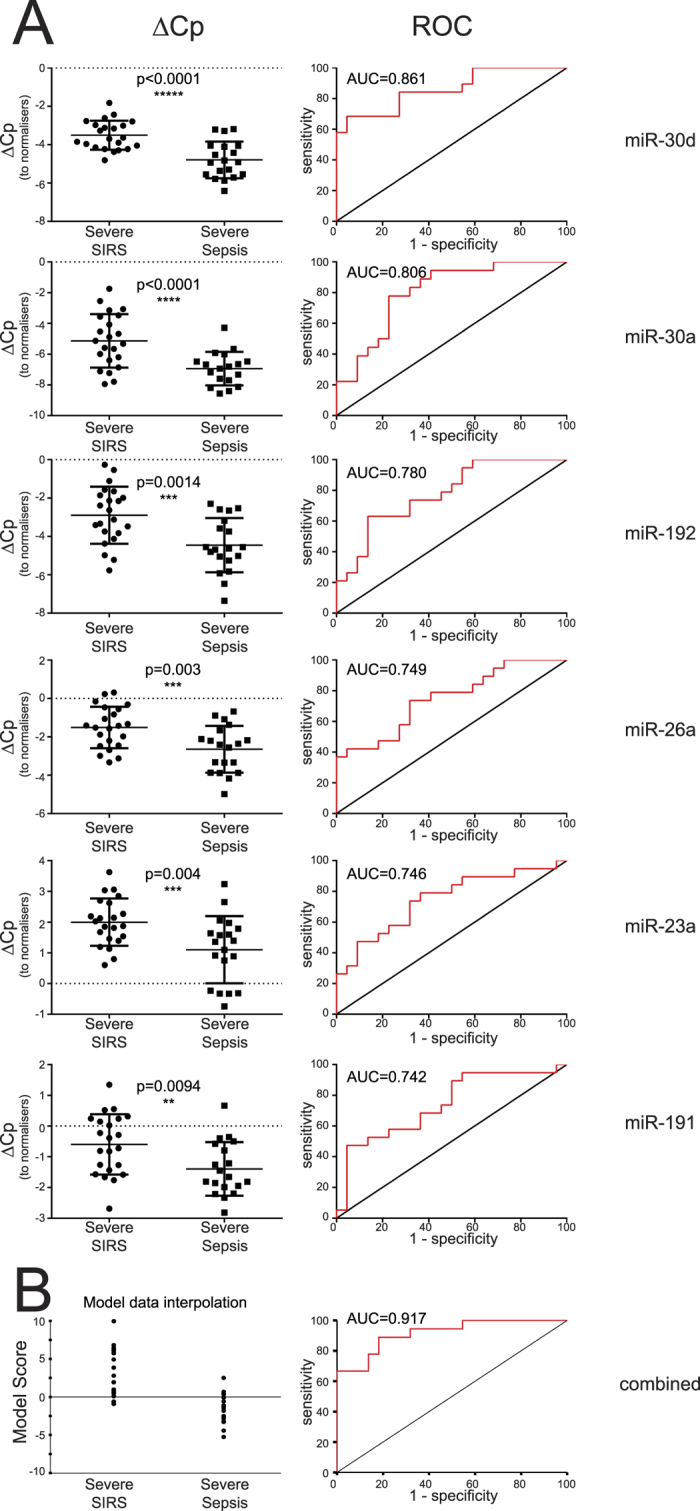
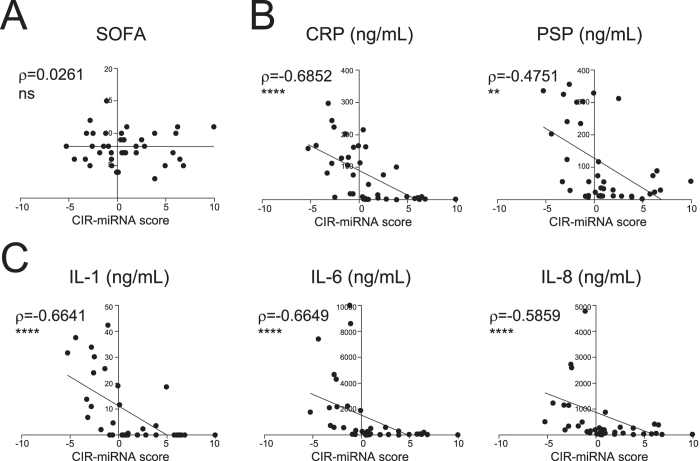
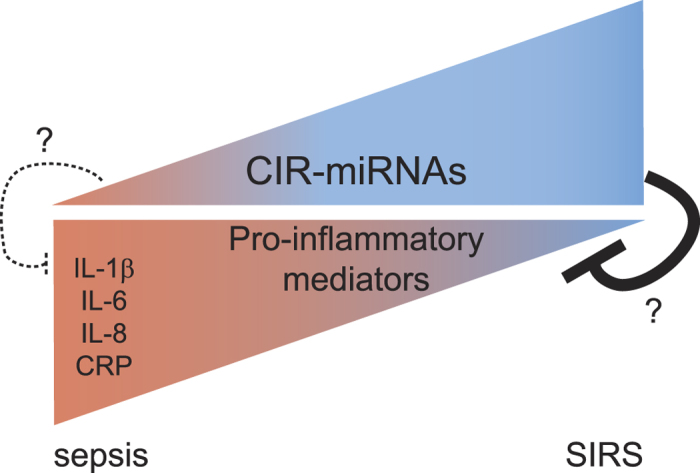
Systemic inflammation in humans may be triggered by infection, termed sepsis, or non-infective processes, termed non-infective systemic inflammatory response syndrome (SIRS). MicroRNAs regulate cellular processes including inflammation and may be detected in blood. We aimed to establish definitive proof-of-principle that circulating microRNAs are differentially affected during sepsis and non-infective SIRS. Critically ill patients with severe (n = 21) or non-severe (n = 8) intra-abdominal sepsis; severe (n = 23) or non-severe (n = 21) non-infective SIRS; or no SIRS (n = 16) were studied. Next-generation sequencing and qRT-PCR were used to measure plasma microRNAs. Detectable blood miRNAs (n = 116) were generally up-regulated in SIRS compared to no-SIRS patients. Levels of these 'circulating inflammation-related microRNAs' (CIR-miRNAs) were 2.64 (IQR: 2.10-3.29) and 1.52 (IQR: 1.15-1.92) fold higher for non-infective SIRS and sepsis respectively (p < 0.0001), hence CIR-miRNAs appeared less abundant in sepsis than in SIRS. Six CIR-miRNAs (miR-30d-5p, miR-30a-5p, miR-192-5p, miR-26a-5p, miR-23a-5p, miR-191-5p) provided good-to-excellent discrimination of severe sepsis from severe SIRS (0.742-0.917 AUC of ROC curves). CIR-miRNA levels inversely correlated with pro-inflammatory cytokines (IL-1, IL-6 and others). Thus, among critically ill patients, sepsis and non-infective SIRS are associated with substantial, differential changes in CIR-miRNAs. CIR-miRNAs may be regulators of inflammation and warrant thorough evaluation as diagnostic and therapeutic targets.


Conflict of interest statement

In relation to the work presented here, S.C., F.K., S.F.N. and M.J.L. declare to be inventors in a patent application submitted by the University of Sussex.

Figures

Figure 1
Figure 1. Patients plasma tested for miRNAs in Illumina NGS.
Plasma total RNA was extracted from 10 pools (representative of 89 ICU patients, as in Table 1) using the miRVana PARIS technology and then human miRNAs were sequenced using the Illumina next generation sequencing (NGS) platform. (A) Representative plots show the number of blood miRNAs (x-axis, sorted based on their abundance in the first duplicate of SIRS) and relative NGS counts (y-axis), in SIRS, sepsis and no-SIRS patients. Many miRNA were expressed below 1/105 NGS counts (orange shadowed areas) consistently across all pools and were excluded from further analysis. (B) Prolife of miRNA distribution after miRNAs with <1/105 counts (orange areas) in all pools were excluded. (C) miRNA counts in 2 identical replicates are shown in scatter plots for SIRS, sepsis and no-SIRS patients. Reproducible results were obtained for miRNAs with NGS counts >10/105 (red lines) and miRNA in the grey area were excluded. (D) The average miRNA counts (shortlisted in A–C, n = 116) from severe SIRS and Sepsis groups was expressed as a ratio against no-SIRS controls (left and middle panels) or in between each others (right panel), resulting in fold differences (fd) for each blood miRNA (histograms). Green and red areas, respectively, represent miRNA decrease and increase, separated by fd = 1 (left dotted line) and fd = +2 (right dotted line). Compared to no-SIRS, many CIR-miRNAs had fd > +2 in SIRS (left), but not in sepsis (fd < +2, middle). When Sepsis/SIRS are compared CIR-miRNAs are mostly downregulated (right).
Figure 2
Figure 2. Shortlisting of internal normalizers in NGS and miRNA Q-PCR arrays.
Plasma total RNA extracted and analyzed in NGS as described in Fig. 1, in 10 duplicate plasma pools (5 groups representative of 89 individuals) (A) or in 89 individuals samples using the miRCURY LNA Universal RT microRNA PCR technology (B). (A) Among the finally shortlisted miRNAs (miR-320a, miR-92-3p and miR-486-5p), the fold-differences (fd) of average NGS counts seen in severe and non-severe sepsis and SIRS groups (8 pools representative of 73 individuals) relative to no-SIRS controls (2 duplicate pools, n = 16) are shown. (B) In miRNA qPCR arrays, normalizer miRNAs were tested for 89 individual patients in 5 groups: severe sepsis (n = 21); non-severe sepsis (n = 8); severe SIRS (n = 23); non-severe SIRS (n = 21); and patients without SIRS (no-SIRS controls, n = 16), in two independent technical repeat experiments. Because miR-92b-3p was below the level of detection in 22/89 patients, it was excluded from further analysis. The mean Cp of the miR-320a and miR-486-5p is shown in each group and was selected as an internal normalizer for the miRNA qPCR array dataset.
Figure 3
Figure 3. Shortlisted CIR-miRNAs measured with Exiqon miRNA qPCR arrays.
In miRNA qPCR arrays, within each patient’s specimen, Cp of a single miRNA is compared to the mean Cp of 2 normalizers (as from Fig. 2) to give delta-Cp (dCp). dCp of all patients are analyzed, comparing severe Sepsis (D, n = 21) and SIRS (A, n = 23). (A) Volcano plot shows fold changes (log2, D/A) relative to p values (−log10) in each miRNA assay. In the upper left quadrant of the plot, around 20 miRNAs are significantly (red and yellow dots above the horizontal black line, which indicates a level of significance p ≤ 0.05) downregulated in D/A (fd < −1.5, left vertical line), see Table 2. Orange and red dots represent significant differences by t-test (p < 0.05) with red dots representing miRNA that also passed the Benjamini-Hochberg correction. No CIR-miRNA significantly increased in D/A. (B) Heatmap shows the top 12 significant miRNA clustering with opposite patterns in D/A. (C) Principal component analysis (PCA) transforms the top 5 significant miRNAs to maximize the visualization of differences across the severe sepsis and SIRS groups. The PCA plot shows that within the dataset it is possible to discriminate patients with SIRS (blue dots, mostly in the lower right quadrant of the PCA plot) away from patients with sepsis (Fig. 3C, green dots falling in other quadrants).
Figure 4
Figure 4. CIR-miRNAs are good-to-excellent biomarkers of sepsis.
In miRNA qPCR arrays, data was analyzed as in Fig. 3 and the top-6 differentially expressed miRNA in sepsis compared to SIRS (after the Benjamini-Hochberg correction) are shown. (A) Left dot plots show dCp values in severe SIRS vs sepsis in individual samples (n = 21 and n = 23 for sepsis and SIRS respectively, except n = 20 in sepsis for miRNA-30a-5p) together with the level of significance. The relative receiver operator curve (ROC, right) is shown with the Area Under the Curve (AUC). Each of the top 6 significant CIR-miRNAs is a good-to-excellent biomarker and CIR-miRNAs were mostly downregulated in Sepsis compared to SIRS in Exiqon miRNA qPCR arrays. (B) A model combines the top-6 significant CIR-miRNAs to maximize distinction between SIRS and sepsis. The CIR-miRNA score is directly related to the odds of having SIRS or sepsis given the measurements of the 6 top miRNAs (see Material and Methods for further details). Left dot plot shows the model interpolation of the experimental cohort: SIRS patients -that have high CIR-miRNA levels (in A)- tend to score >0, whilst sepsis patients tend to score <0. ROC (and AUC, right) shows that the 6 CIR-miRNAs combined outperformed single miRNAs.
Figure 5
Figure 5. Correlation of the model scores with pathology scores and plasma levels of immune mediators relevant in sepsis and SIRS.
The model scores that combine the top-6 CIR-miRNA measurements in Severe SIRS and Severe Sepsis patients were plotted against (A) the pathology score (SOFA, sequential organ failure assessment); (B) current biomarkers of sepsis and inflammation, CRP (C-reactive protein) and PSP (pancreatic soluble protein); and (C) inflammatory cytokines, IL-6, IL-8, and IL-1. Correlation trends are shown with the linear regression model including Spearman rho and the significances of the correlations. Negative scores -typical of sepsis patients with lower plasma CIR-miRNAs (as in Fig. 4)- correspond to individuals with increased levels of inflammatory mediators. Positive scores -more often seen in SIRS patients and reflective of high plasma CIR-miRNAs- are found in individuals with low levels of inflammatory cytokines. Thus, CIR-miRNA levels negatively correlate with pro-inflammatory cytokines critical in systemic inflammatory conditions.
Figure 6
Figure 6. Proposed model for CIR-miRNA and inflammatory mediator plasma levels.
The triangular shapes represent plasma levels of CIR-miRNA (circulating miRNA, top) and pro-inflammatory mediators (bottom). Based on our results, in Sepsis we found low levels of CIR-miRNAs correlating with increasing levels of pro-inflammatory mediators (dark red). In contrast, in SIRS patients CIR-miRNAs are more abundant than what is found for sepsis patients correlating with lower levels of pro-inflammatory markers (blue). We speculate that immunologically relevant CIR-miRNAs may exist that act as regulators of inflammatory processes especially during systemic inflammatory diseases. This hypothesis is consistent with recent data showing that regulatory cells secrete exosomes which exert miRNA-mediated immune-suppression.

Similar articles

Cited by

References

    1. American College of Chest Physicians/Society of Critical Care Medicine Consensus Conference: definitions for sepsis and organ failure and guidelines for the use of innovative therapies in sepsis. Crit. Care Med. 20, 864–874 (1992). - PubMed
    1. Angus D. C. et al.. Epidemiology of severe sepsis in the United States: analysis of incidence, outcome, and associated costs of care. Crit. Care Med. 29, 1303–1310, doi: 10.1097/00003246-200107000-00002 (2001). - DOI - PubMed
    1. Adib-Conquy M. & Cavaillon J. M. Stress molecules in sepsis and systemic inflammatory response syndrome. FEBS Lett. 581, 3723–3733, doi: 10.1016/j.febslet.2007.03.074 (2007). - DOI - PubMed
    1. Oberholzer A., Oberholzer C. & Moldawer L. L. Sepsis syndromes: understanding the role of innate and acquired immunity. Shock 16, 83–96, doi: 10.1097/00024382-200116020-00001 (2001). - DOI - PubMed
    1. Lichtenstern C., Brenner T., Bardenheuer H. J. & Weigand M. A. Predictors of survival in sepsis: what is the best inflammatory marker to measure? Curr. Opin. Infect. Dis. 25, 328–336, doi: 10.1097/QCO.0b013e3283522038 (2012). - DOI - PubMed

Publication types

MeSH terms