. 2016 Jul 7;63(1):60-71.
doi: 10.1016/j.molcel.2016.05.014. Epub 2016 Jun 16.

Defining the Essential Function of Yeast Hsf1 Reveals a Compact Transcriptional Program for Maintaining Eukaryotic Proteostasis

Affiliations

Defining the Essential Function of Yeast Hsf1 Reveals a Compact Transcriptional Program for Maintaining Eukaryotic Proteostasis

Eric J Solís et al. Mol Cell. .

Erratum in

Abstract

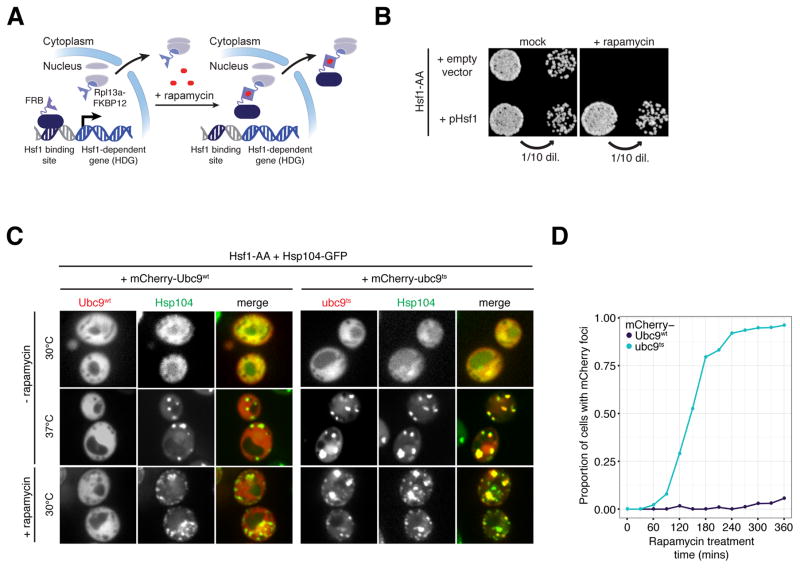
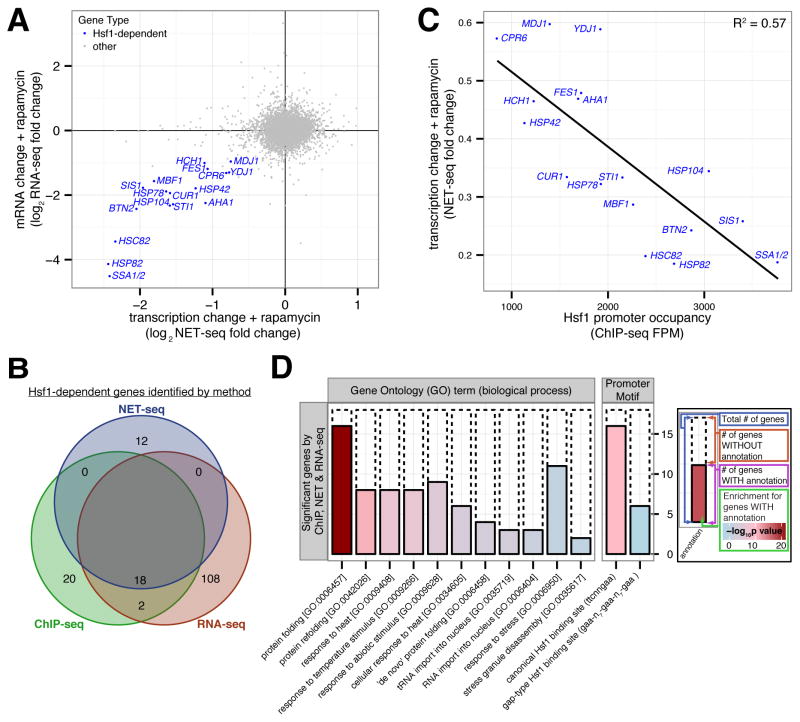
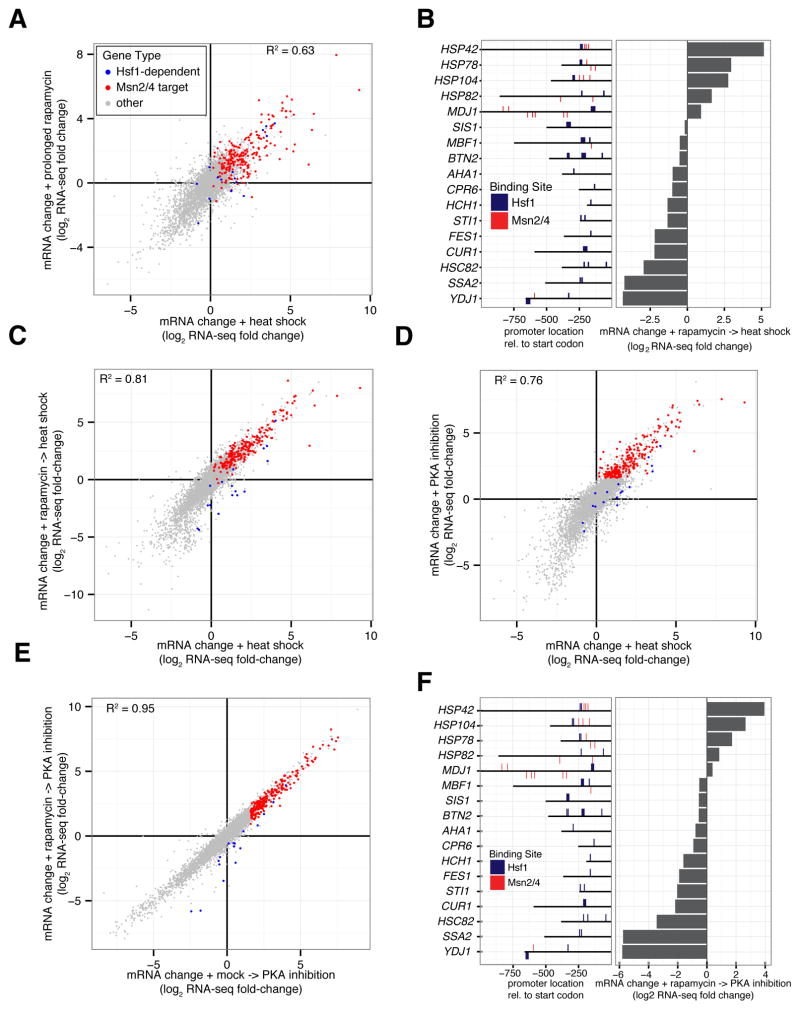
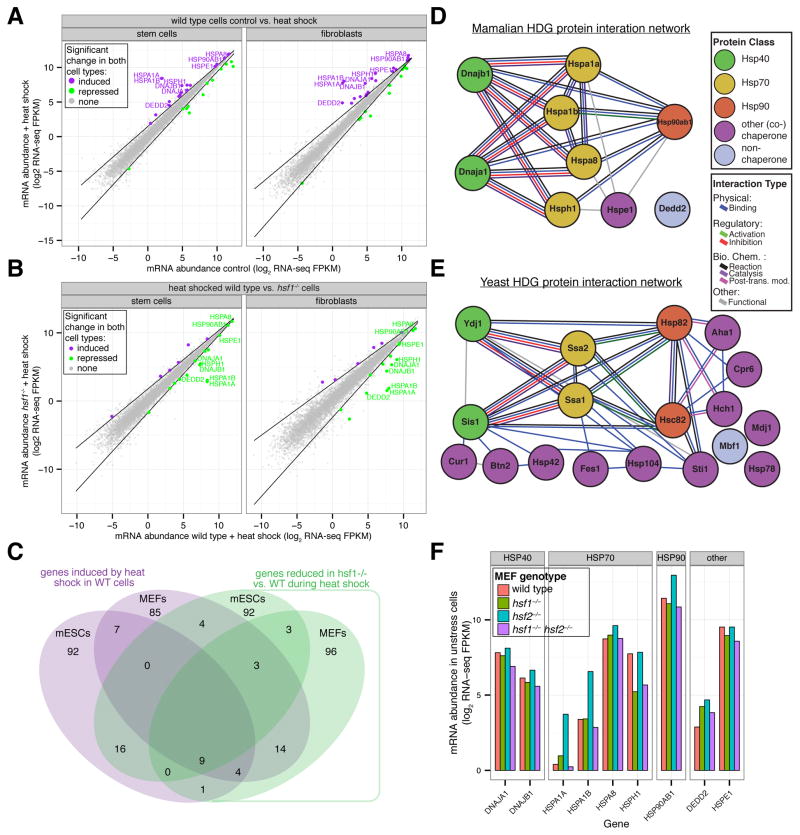
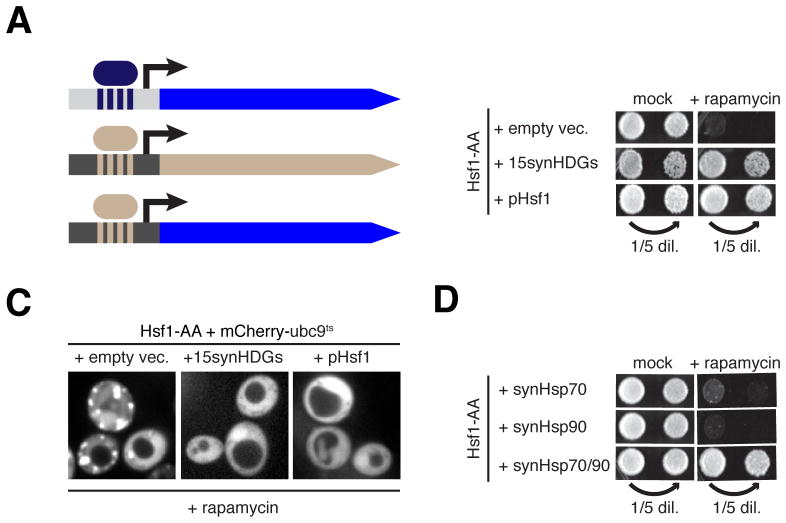
Despite its eponymous association with the heat shock response, yeast heat shock factor 1 (Hsf1) is essential even at low temperatures. Here we show that engineered nuclear export of Hsf1 results in cytotoxicity associated with massive protein aggregation. Genome-wide analysis revealed that Hsf1 nuclear export immediately decreased basal transcription and mRNA expression of 18 genes, which predominately encode chaperones. Strikingly, rescuing basal expression of Hsp70 and Hsp90 chaperones enabled robust cell growth in the complete absence of Hsf1. With the exception of chaperone gene induction, the vast majority of the heat shock response was Hsf1 independent. By comparative analysis of mammalian cell lines, we found that only heat shock-induced but not basal expression of chaperones is dependent on the mammalian Hsf1 homolog (HSF1). Our work reveals that yeast chaperone gene expression is an essential housekeeping mechanism and provides a roadmap for defining the function of HSF1 as a driver of oncogenesis.


Figures

Figure 1
Figure 1. Acute inactivation of Hsf1 induces proteotoxicity even in the absence of stress
(A) Schematic of Hsf1 Anchor Away (Hsf1-AA). (B) Hsf1-AA cells with indicated plasmids were spotted at two cell densities onto rapamycin or mock plates. Shown are images of plates incubated for 3 days at 30°C. (C) Representative confocal micrographs of Hsf1-AA cells expressing endogenous Hsp104-GFP and plasmid-borne mCherry-Ubc9wt or -ubc9ts taken after logarithmic growth at 30°C, after treatment with heat shock (20′ at 37°C), and after treatment with rapamycin (360′ at 30°C). (D) Hsf1-AA cells described in part (C) were treated with rapamycin for indicated times at 30°C and imaged by epifluorescence microscopy. Blinded images containing at least 100 cells were scored for cells containing mCherry foci and the fraction of scored cells plotted. See also Figure S1.
Figure 2
Figure 2. Hsf1 drives basal expression of a diverse set of protein folding factors
(A) Hsf1-AA cells were grown logarithmically at 30°C and harvested for analysis by NET-seq or RNA-seq immediately prior to and after 15′, 30′ and 60′ of rapamycin treatment. Shown is a gene scatter plot of transcription versus mRNA changes induced by treatment with rapamycin for 15′ and 60′, respectively. (B) Venn diagram comparing Hsf1 target genes defined by ChIP-, NET- and RNA-seq, with the names of the 18 Hsf1-dependent genes (HDGs) detected by all 3 techniques indicated. (C) Gene scatter plot of change in HDG transcription resulting from 15′ of rapamycin treatment versus Hsf1 occupancy at HDG promoters. (D) Bioinformatic analysis of the 18 HDGs defined by ChIP-, NET- and RNA-seq. Solid bars show the number of HDGs with the given annotation (GO term or promoter motif) and dashed bars show the remaining number of HDGs. The fill color indicates the significance level for the enrichment of the annotated HDGs versus other genes. See Supplementary Figure 2J for a similar bioinformatic analysis of Hsf1 targets defined by each individual genome-wide approach or by combining any two approaches. See also Figure S2 and Tables S1–3.
Figure 3
Figure 3. Induction of most genes by heat shock is Hsf1-independent and Msn2/4-dependent
(A) Hsf1-AA cells were grown at 30°C, heat shocked (39°C for 30′) or treated with rapamycin for either 60′ or 240′ at 30°C prior to harvesting for analysis by RNA-seq. Shown is a gene scatter plot of mRNA changes induced by prolonged rapamycin treatment (240′ vs. 60′) (y-axis) versus changes induced by heat shock (x-axis). Msn2/4 targets were defined as genes with at least one Msn2/4 promoter binding site (AGGGG) that were in the top 10% of genes induced by PKA inhibition (see Figure 3D). (B) Left: Locations of predicted bindings sites for Hsf1 (TTCnnGAA and TTC-n7-TTC-n7-TTC) and Msn2/4 (AGGGG) in HDG promoters. Right: Hsf1-AA cells were grown logarithmically at 30°C (control) or treated with rapamycin (30°C for 30′) followed by heat shock (39°C for 30′) prior to harvesting for RNA-seq analysis. Shown are HDG mRNA changes induced by sequential treatment relative to control. (C) Hsf1-AA cells were grown at 30°C (control) or treated with either rapamycin (30′ at 30°C) and then heat shock (39°C for 30′) or carrier-only and then heat shock prior to harvesting for RNA-seq analysis. Shown is a gene scatter plot of mRNA changes induced by the two treatments relative to the control. (D) Hsf1-AA PKAas cells were grown at 30°C (control) or treated with heat shock (39°C for 30′) or the PKA inhibitor 1-NM-PP1 (30°C for 30′) prior to harvesting for RNA-seq analysis. Shown is a gene scatter plot comparing mRNA changes induced by these two treatments relative to control. (E) Hsf1-AA PKAas cells were grown at 30°C or after treatment with either rapamycin (30′ at 30°C) and then 1-NM-PP1 (30′ at 30°C) or carrier-only and then 1-NM-PP1 prior to harvesting for RNA-seq analysis. Shown is a gene scatter plot comparing mRNA changes induced by these two treatments relative to control. (F) Left: HDG promoter locations of Hsf1 and Msn2/4 binding sites as in part (B). Right: Hsf1-AA PKAas cells were grown at 30°C (control) or after treatment with rapamycin (30′ at 30°C) and then 1-NM-PP1 (30′ at 30°C) prior to harvesting for RNA-seq analysis. Shown are HDG mRNA changes induced by sequential treatment relative to control. See also Figure S3.
Figure 4
Figure 4. Mammalian HSF1 enables heat induction of a chaperone network similar to the yeast HDG network
(A) Wild-type mESCs and MEFs were cultured at 37°C or treated with heat shock (42°C for 60′) prior to harvesting for RNA-seq analysis. Shown is a gene scatter plot of mRNA abundances in treated versus control samples for each cell type. Dark lines indicate statistical thresholds used to define genes with significant changes in expression (see Experimental Procedures) and genes with significant changes in both cell types are colored. Also indicated are gene names of HSF1-dependent genes (HDGs) defined by additional experiments and analyses (see Figures 4B and 4C and Experimental Procedures). (B) Wild-type (WT) and hsf1/ mESCs and MEFs were heat shocked (42°C for 60′) and then analyzed by RNA-seq. Shown is a gene scatter plot of mRNA abundances in heat shocked WT versus hsf1/ cells for each cell type. For definition of dark lines and gene names see part (A). (C) Venn diagram comparing genes in mESC and MEFs that are significantly induced by heat shock in WT cells (purple) with genes whose expression is significantly reduced during heat shock in hsf1/ vs. WT cells. HDGs are defined as genes in the 4-way intersection and their names indicated. (D) and (E) Mammalian and yeast HDG protein-protein interaction network (see Experimental Procedures). (F) Wild-type, hsf1/, hsf2/, and hsf1/ hsf2/ MEFs were cultured at 37°C prior to harvesting for RNA-seq analysis. Shown are mRNA abundances for HDGs in each cell line. See also Figure S4 and Table S4.
Figure 5
Figure 5. A synthetic transcriptional program reveals the essential function of Hsf1
(A) Schematic of promoter swapping strategy for constitutive expression of Hsf1 targets from strong Hsf1-independent promoters. See Supplementary Figure 4A for details. (B) Hsf1-AA cells with indicated plasmids were spotted at two concentrations onto rapamycin or mock (carrier-only) plates. Shown are images of plates incubated for 5 days at 30°C. (C) Representative confocal micrographs of Hsf1-AA cells expressing plasmid-borne mCherry-ubc9ts and indicated plasmids taken after treatment with rapamycin (360′ at 30°C). (D) Hsf-AA cells with indicated transgenes were spotted at two concentrations onto rapamycin or mock plates, which also contained β-estradiol to drive synHsp expression from β-estradiol-dependent promoters (see Experimental Procedures for details). Shown are images of plates incubated for 5 days at 30°C. See also Figure S5 and Table S5.

Comment in

References

    1. Akerfelt M, Morimoto RI, Sistonen L. Heat shock factors: integrators of cell stress, development and lifespan. Nat Rev Mol Cell Biol. 2010;11:545–555. - PMC - PubMed
    1. Anckar J, Sistonen L. Regulation of HSF1 function in the heat stress response: implications in aging and disease. Annu Rev Biochem. 2011;80:1089–1115. - PubMed
    1. Balch WE, Morimoto RI, Dillin A, Kelly JW. Adapting proteostasis for disease intervention. Science. 2008;319:916–919. - PubMed
    1. Boy-Marcotte E, Lagniel G, Perrot M, Bussereau F, Boudsocq A, Jacquet M, Labarre J. The heat shock response in yeast: differential regulations and contributions of the Msn2p/Msn4p and Hsf1p regulons. Molecular Microbiology. 1999;33:274–283. - PubMed
    1. Brandman O, Stewart-Ornstein J, Wong D, Larson A, Williams CC, Li GW, Zhou S, King D, Shen PS, Weibezahn J, Dunn JG, Rouskin S, Inada T, Frost A, Weissman JS. A ribosome-bound quality control complex triggers degradation of nascent peptides and signals translation stress. Cell. 2012;151:1042–1054. - PMC - PubMed

MeSH terms