Case Reports
. 2016 Oct 1;78(9):1475-1480.
doi: 10.1292/jvms.15-0656. Epub 2016 Jun 16.

Use of standing low-field magnetic resonance imaging to assess oblique distal sesamoidean ligament desmitis in three Thoroughbred racehorses

Affiliations
Case Reports

Use of standing low-field magnetic resonance imaging to assess oblique distal sesamoidean ligament desmitis in three Thoroughbred racehorses

Fumiaki Mizobe et al. J Vet Med Sci. .

Abstract

Desmitis of the oblique distal sesamoidean ligaments (ODSL) is caused by hyperextension of the metacarpophalangeal/metatarsophalangeal joint and has been described as a significant cause of lameness in racehorses. In this study, three Thoroughbred racehorses (age range: 3-6 years) were diagnosed with desmitis of the forelimb ODSL using standing low-field magnetic resonance imaging (sMRI). Radiography and ultrasonography were inconclusive with regard to a definitive diagnosis. For all horses, the sMRI characteristics included increased signal intensity within the medial ODSL on T1-weighted gradient echo, T2-weighted fast spin echo and short tau inversion recovery fast spin echo images, which use a fat suppression technique. Effusion of the digital flexor tendon sheath was also clearly visible on sMRI. Following rest and controlled exercise for roughly 3 months, two horses successfully returned to racing within 5 months. Our findings support the use of sMRI for diagnosing ODSL injuries in Thoroughbred racehorses.


Figures
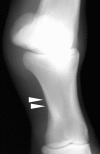
Fig. 1.
Fig. 1.
Dorsomedial palmarolateral 45° oblique radiographic image of the metacarpophalangeal joint of case 1. Periosteal osteoproliferation is visible at the mid-palmaromedial surface of the proximal phalanx (arrowheads).
Fig. 2.
Fig. 2.
(A) Transverse ultrasonographic image of case 1, obtained in a lateral oblique position over the proximal pastern region. The palmar is at the top, and the lateral direction is at left. Marked increases in fluid (arrow) and fibrin (arrowheads) are visible in the digital flexor tendon sheath. (B) Transverse ultrasonographic image of case 1, obtained in a medial oblique position over the proximal pastern region. Note the hypoechoic changes in the medial oblique distal sesamoidean ligament.
Fig. 4.
Fig. 4.
(A) Transverse T1-weighted gradient echo image acquired at the level of the proximal third of the proximal phalanx in case 1. The dorsal and medial directions are at the top and left, respectively. Enlargement of and increased signal intensity in the medial oblique distal sesamoidean ligament (ODSL) are visible (arrow). An area of low signal intensity is visible in the digital flexor tendon sheath (DFTS; arrowheads). (B) Transverse T2-weighted fast spin echo (FSE) image of the proximal phalanx of case 1, acquired at the same level as above. Abnormally high signal intensity is visible in the medial ODSL (arrow). An increased amount of fluid is present within the DFTS (arrowheads). (C) Transverse short tau inversion recovery FSE image of the proximal phalanx from the case 1, acquired at the same level as above. Increased signal intensity is visible in the medial ODSL (arrow). An increased amount of fluid is present within the DFTS (arrowheads).
Fig. 5.
Fig. 5.
Transverse ultrasonographic image obtained in the medial oblique direction over the proximal pastern region of case 2. The palmar and medial directions are at the top and left, respectively. Note the enlargement of the medial oblique distal sesamoidean ligament (arrows).
Fig. 6.
Fig. 6.
(A) Transverse T1-weighted gradient echo image of the proximal pastern of case 2. The dorsal and medial directions are at the top and right, respectively. High signal intensity is observed in the medial oblique distal sesamoidean ligament (ODSL; arrow). A discrete area of increased signal intensity is visible within the lateral ODSL (open arrowheads). The distended digital flexor tendon sheath exhibits a hypointense signal (arrowheads). (B) Transverse T2-weighted fast spin echo (FSE) image of the proximal pastern of case 2. Increased signal intensity is visible in the medial ODSL (arrow). The lateral ODSL exhibits focal hyperintensity (open arrowheads). An increased amount of fluid is present within the DFTS (arrowheads). (C) Transverse short tau inversion recovery FSE image of the proximal pastern of case 2. Increased signal intensity is present in the medial ODSL (arrow) and lateral ODSL (open arrowheads). Hyperintense fluid is observed within the DFTS (arrowheads).
Fig. 7.
Fig. 7.
(A) Transverse T1-weighted gradient echo image of case 3 showing high signal intensity (arrow) in the medial oblique distal sesamoidean ligament (ODSL) at the proximal third of the proximal phalanx. The dorsal and medial directions are at the top and left, respectively. Fluid in the digital flexor tendon sheath (DFTS) is observed as an area of low signal intensity (arrowhead). (B) Transverse T2-weighted fast spin echo image acquired at the level of the proximal third of the proximal phalanx in case 3. The medial ODSL exhibits increased signal intensity (arrow). An increased amount of fluid is present within the DFTS (arrowhead).
Fig. 3.
Fig. 3.
Transverse T1-weighted gradient echo (A), T2-weighted fast spin echo (FSE) (B) and short tau inversion recovery FSE (C) images of a normal pastern at the level of the proximal third of the proximal phalanx. The dorsal and medial directions are at the top and right, respectively. The medial oblique distal sesamoidean ligament (ODSL) (arrow) and lateral ODSL (open arrowhead) have fairly uniform shapes with low to intermediate signal intensity in all sequences.

Similar articles

Cited by

References

    1. Bertone A. L.2011. Lameness in the Extremities. pp. 588–613. In: Adams and Stashak’s Lameness in Horses, 6th ed. (Baxter, G. M. ed.), Blackwell Publishing, Ltd., West Sussex.
    1. Busoni V., Snaps F., Trenteseaux J., Dondelinger R. F.2004. Magnetic resonance imaging of the palmar aspect of the equine podotrochlear apparatus: normal appearance. Vet. Radiol. Ultrasound 45: 198–204. doi: 10.1111/j.1740-8261.2004.04033.x - DOI - PubMed
    1. Denoix J. M.2000. The Equine Pastern. pp. 129–241. In: The Equine Distal Limb: An Atlas of Clinical Anatomy and Comparative Imaging. (Denoix J. M. ed.), Manson Publishing Ltd., London.
    1. Denoix J. M., Crevier N., Azevedo C.1991. Ultrasound examination of the pastern. Proc. Am. Assoc. Equine Pract. 37: 363–379.
    1. Denoix J. M., Crevier N., Roger B., Lebas J.1993. Magnetic resonance imaging of the equine foot. Vet. Radiol. Ultrasound 34: 405–411. doi: 10.1111/j.1740-8261.1993.tb02029.x - DOI

Publication types