. 2016 Jun 20:6:28163.
doi: 10.1038/srep28163.

Ultrasensitive proteomic quantitation of cellular signaling by digitized nanoparticle-protein counting

Affiliations

Ultrasensitive proteomic quantitation of cellular signaling by digitized nanoparticle-protein counting

Thomas Jacob et al. Sci Rep. .

Abstract

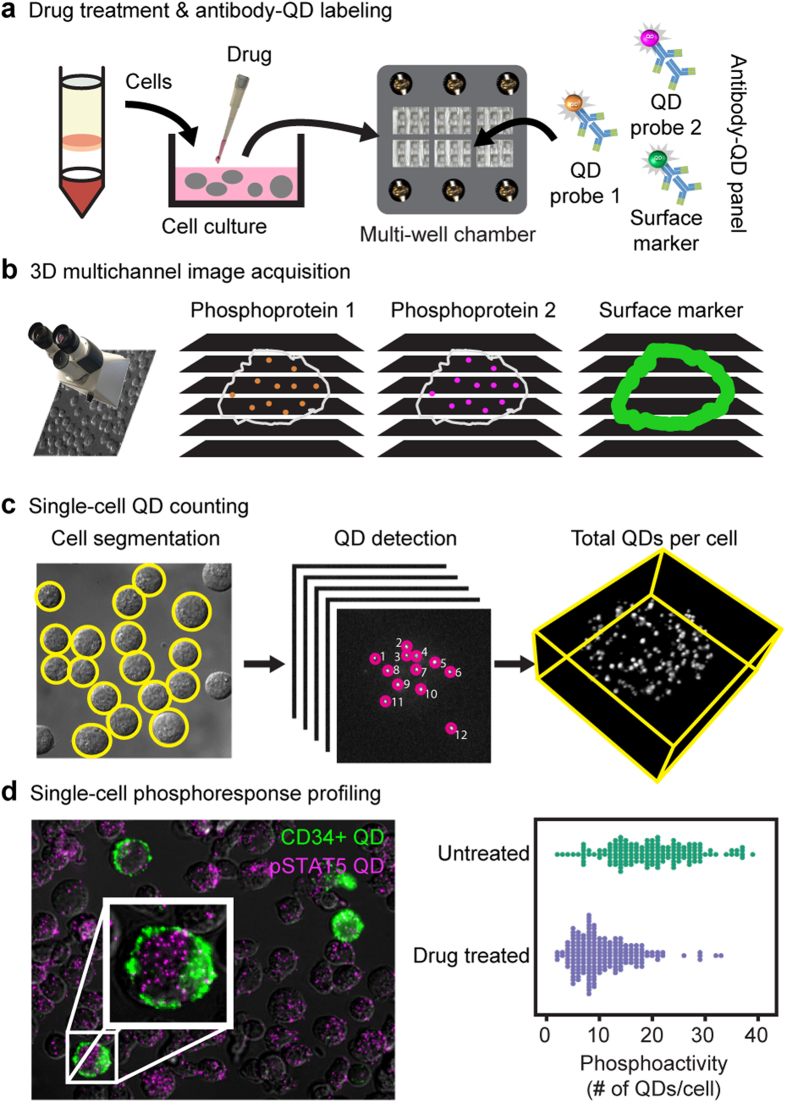
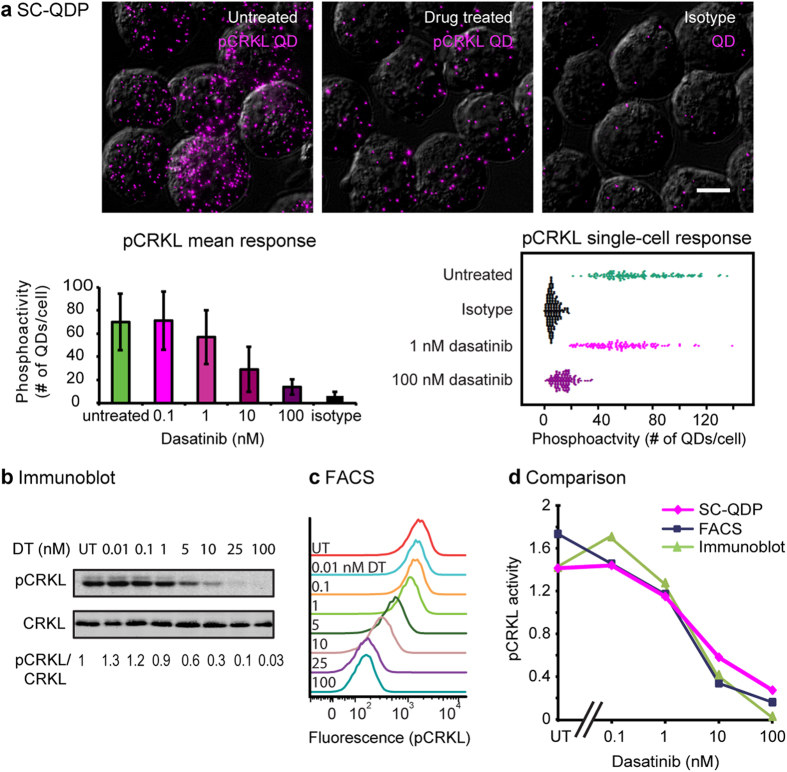
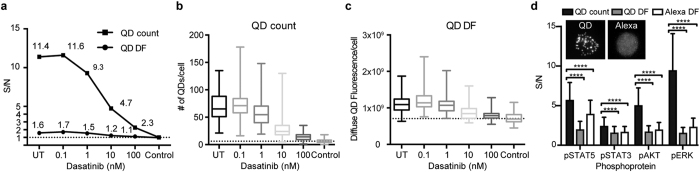
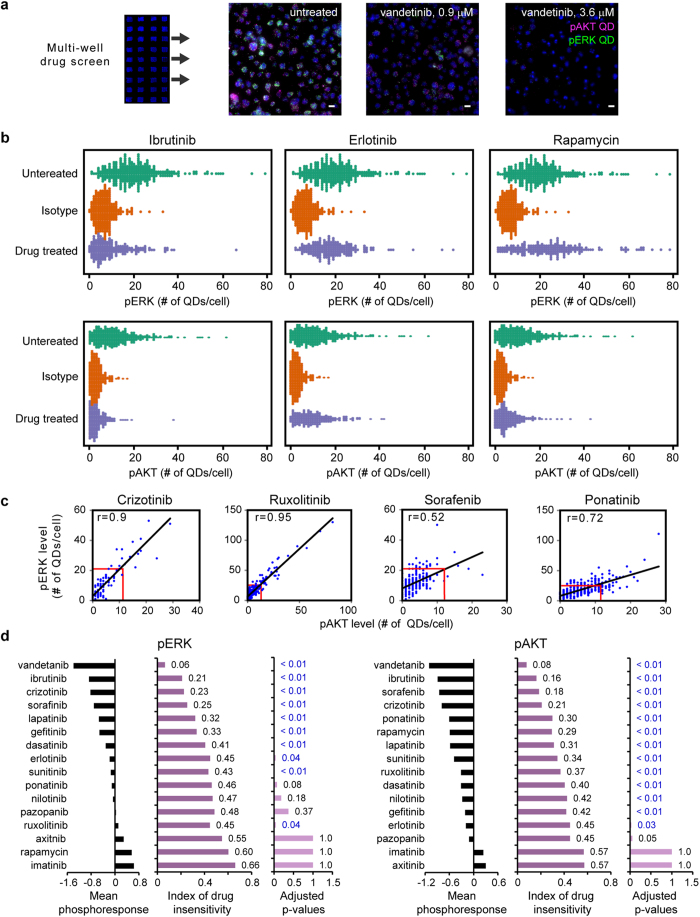
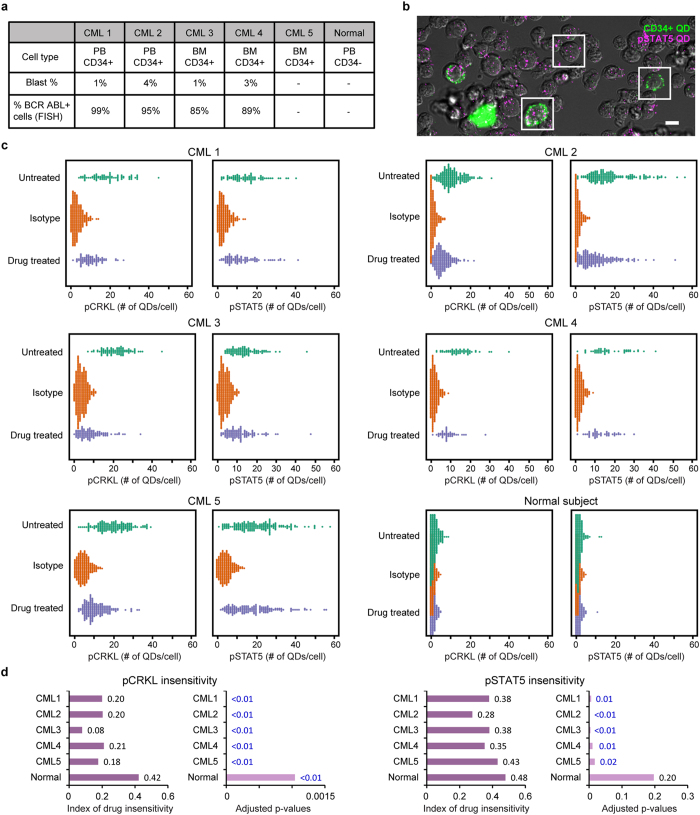
Many important signaling and regulatory proteins are expressed at low abundance and are difficult to measure in single cells. We report a molecular imaging approach to quantitate protein levels by digitized, discrete counting of nanoparticle-tagged proteins. Digitized protein counting provides ultrasensitive molecular detection of proteins in single cells that surpasses conventional methods of quantitating total diffuse fluorescence, and offers a substantial improvement in protein quantitation. We implement this digitized proteomic approach in an integrated imaging platform, the single cell-quantum dot platform (SC-QDP), to execute sensitive single cell phosphoquantitation in response to multiple drug treatment conditions and using limited primary patient material. The SC-QDP: 1) identified pAKT and pERK phospho-heterogeneity and insensitivity in individual leukemia cells treated with a multi-drug panel of FDA-approved kinase inhibitors, and 2) revealed subpopulations of drug-insensitive CD34+ stem cells with high pCRKL and pSTAT5 signaling in chronic myeloid leukemia patient blood samples. This ultrasensitive digitized protein detection approach is valuable for uncovering subtle but important differences in signaling, drug insensitivity, and other key cellular processes amongst single cells.


Figures

Figure 1
Figure 1. Digitized phosphoprotein quantitation by the single cell quantum-dot platform.
(a) Drug-treated cells are fixed, permeabilized, deposited in a multi-well glass chamber, and labeled with primary antibodies, and multicolor secondary antibody-QD probes. (b) 3D multichannel z-stack images are acquired. (c) Discrete QD-tagged protein complexes are counted from image stacks and tabulated for individual cells. (d) Single cell phosphoprofiling showing CD34 and pSTAT5 staining. Bee swarm plots depict the phosphoactivity (# of QDs/cell, x axis) for untreated cells and drug-treated cells.
Figure 2
Figure 2. Validation of the SC-QDP approach by immunoblot and FACS.
CML K562 cells were processed by SC-QDP, immunoblotting, and FACS assays. pCRKL data are shown; pSTAT5 and pSTAT3 data shown in Supplementary Fig. 2. (a) Micrographs of K562 cells processed by SC-QDP for pCRKL in three conditions: untreated, dasatinib-treated (100 nM, 4 h), and no primary antibody (control). Images are collapsed z-stack overlays of pCRKL-QD (magenta) and brightfield DIC channels. Scale bar is 10 μm. Bar graphs show the mean pCRKL activity (y axis), computed as the average number of discrete QD counts in single K562 cells at various dasatinib concentration (x axis). Error bars are standard deviation of the mean. Numbers of cells sampled are: 142, 159, 130, 117, 130, 181, left to right on bar graph. Bee swarm plots show phosphoactivity (# of QDs per cell, x-axis) of cells for conditions of untreated, dasatinib-treated, and no primary antibody control. (b) Immunoblot showing pCRKL and CRKL levels in K562 cells treated with increasing concentrations of dasatinib. Quantitative pCRKL/CRKL ratios are indicated below the blots. UT = untreated. (c) FACS histograms show pCRKL levels in K562 cells treated with increasing concentrations of dasatinib (DT). UT = untreated. FACS curves at mean ± std: 1,574 ± 971, 1,137 ± 788, 170 ± 115, respectively for untreated, 1 nM, 100 nM conditions. (d) Plots compare phosphoactivity (y axis) measured by SC-QDP (blue), FACS (magenta), and quantitation of pCRKL/CRKL from immunoblots (green). Phosphoactivity value at each point is normalized to the mean of the values over the range of drug treatment. Additional validations for pSTAT5 and pSTAT3 are shown in Supplementary Fig. 2.
Figure 3
Figure 3. SC-QDP digitized counting sensitivity supersedes conventional summing of diffuse fluorescence in single cells.
(a) Plot of signal-to-noise (S/N) ratio for pCRKL quantification in K562 cells comparing the SC-QDP method of QD-nanoparticle counting (QD count) to QD diffuse fluorescence (QD DF) averaging in single cells, at increasing dasatinib concentrations. S/N is calculated by dividing the pCRKL level to that of the isotype control. UT is untreated cells. Dashed line is isotype control value. Numbers of cells sampled: 142, 159, 130, 117, 130, and 181 (left to right, x-axis). (b) Box plots showing the numbers of QDs/per cell in the SC-QDP from which S/N ratios were computed in Fig. 3a. Dashed line represents the noise which is the QD count for the isotype control. (c) Box plots showing the QD-DF per cell for a range of dasatinib concentrations. Dashed line represents the noise, which is the QD DF for the isotype control. Numbers of K562 cells sampled are same as given in panel a. (d) Single-cell phosphoquantification using the SC-QDP method of single cell QD-probe counting produces superior detection sensitivity compared to QD DF and Alexa DF per cell. Phosphoactivity levels (y-axis) computed in single untreated K562 cells for pSTAT5, pSTAT3, pERK, and pAKT. S/N ratio calculated by normalizing the phosphoactivity levels in untreated cells to the isotype control. Error bars are standard deviation. P values are calculated by the Holm-Sidak multiple comparison test, asterisks denote p value ≤0.0001. Inset shows representative images of pCRKL labeling by QD655 and Alexa 488 reporters in untreated K562 cells. The same primary phosphoantibody used for QD and Alexa labeling. Numbers of cells sampled are n = 637 (+/−169) for QD-labeling, and n = 940 (+/−118) for the Alexa 488- labeling.
Figure 4
Figure 4. SC-QDP capture of KI-induced phosphoheterogeneity and insensitivity in single cells.
(a) Multi-well, high-throughput SC-QDP KI screen on MOLM-14 AML cells performed at the IC50 dose for cell death, respectively for each drug (blue, Nuclear Mask). Adjacent images show cells labeled with pAKT-QD (magenta), pERK-QD (green), and Nuclear Mask for untreated and vandetinib treated cells. Scale bar, 10 μm. (b) Bee swarm plots show pERK and pAKT levels measured simultaneously in single cells before and after ibrutinib, erlotinib, and rapamycin treatment. Additional plots for vandetanib, axitinib, and imatinib are given in Supplementary Fig. 3. (c) Example plots of pERK vs. pAKT levels measured in single cells illustrate a span of correlation values for different kinase inhibitors. Outlier cells exist with pERK and pAKT values equal to or greater than the mean pERK and pAKT values of untreated cells (blue dots outside red rectangles in the plots). (d) Compilation of degree of cellular drug insensitivity for the kinase inhibitor panel at the IC50 dose that 50% cell death for each drug. Each drug elicits varying degrees of mean phosphoinhibition in the drug-treated cell population. Mean phosphoresponse is calculated as the difference between the inhibitor-treated mean and the untreated mean, divided by units of standard deviation (σ) of the untreated cells. Scores of phosphoresponse insensitivity are given by the Wilcoxon rank sum test (see Methods). An index of 0.5 indicates untreated and treated cell populations are similar; an index < 0.5 indicates the likelihood that a cell from the drug-treated population has a higher level of phosphoactivity than a cell from the un-treated population. Adjusted p values, blue font shows values where p < 0.05 that indicates a significant difference between untreated and drug-treated cell populations. Number of cells sampled is n = 205 (+/−54) per condition.
Figure 5
Figure 5. SC-QDP identifies dasatinib kinase inhibitor-insensitive CD34+ cells in newly diagnosed CML patients.
(a) Cell type, blast percentage and BCR-ABL1 positivity for CML specimens. PB = peripheral blood, BM = bone marrow, dashes = unavailable/not applicable data. (b) QD-labeled CML patient cells show heterogeneity in CD34 positivity (green) and pSTAT5 (magenta) expression. Framed areas show representative CD34+ (green) and CD34− cells, with varying numbers of pSTAT5-QD probes in each cell (magenta). Scale bar = 10 μm. (c) Bee swarm scatter plots of pCRKL and pSTAT5 profiles of CD34+ cells from CML patients and CD34− cells from a healthy subject. Cells were treated with 100 nM dasatinib for 4 h. Scored values of phosphoresponse insensitivity are given by the Wilcoxon rank sum test (see Methods). An index of insensitivity of 0.5 yields the highest level of insensitivity as untreated and treated cell populations are equal; an index that approaches zero indicates the lower likelihood of insensitive cells. Adjusted p-values indicate a significant difference between untreated and drug-treated cell populations (blue text indicates values of p < 0.05). The number of CD34+ cells sampled for pCRKL activity for the five patients was: 80, 87; 195, 196; 160, 191; 91,108 and 56, 45 for untreated and inhibitor-treated conditions, respectively. CD34+ cells sampled for the measurement of pSTAT5 activity for the five CML patients was n = 82, 91; 179, 190; 177, 159; 100, 112 and 47, 47 for untreated and inhibitor-treated conditions, respectively. The healthy subject stained negative for CD34+ cells; the number of CD34- MNCs sampled from the healthy subject for pCRKL measurements was n = 274; 216 for untreated and inhibitor-treated conditions, respectively; and for pSTAT5 measurements was n = 268; 226 for untreated and inhibitor-treated conditions, respectively.

Similar articles

Cited by

References

    1. Mann M., Hendrickson R. C. & Pandey A. Analysis of proteins and proteomes by mass spectrometry. Annu Rev Biochem 70, 437–473 (2001). - PubMed
    1. Twyman R. Principles Of Proteomics. Garland Science (2013).
    1. Delom F. & Chevet E. Phosphoprotein analysis: from proteins to proteomes. Proteome Sci 4, 15 (2006). - PMC - PubMed
    1. Scheele J. S., Rhee J. M. & Boss G. R. Determination of absolute amounts of GDP and GTP bound to Ras in mammalian cells: comparison of parental and Ras-overproducing NIH 3T3 fibroblasts. Proc Natl Acad Sci USA 92, 1097–1100 (1995). - PMC - PubMed
    1. Paradela A. & Albar J. P. Advances in the Analysis of Protein Phosphorylation. Journal of proteome research 7, 1809–1818 (2008). - PubMed

Publication types

MeSH terms