. 2016 Jun 28;16(1):79-91.
doi: 10.1016/j.celrep.2016.05.044. Epub 2016 Jun 16.

Defects in the CAPN1 Gene Result in Alterations in Cerebellar Development and Cerebellar Ataxia in Mice and Humans

Affiliations

Defects in the CAPN1 Gene Result in Alterations in Cerebellar Development and Cerebellar Ataxia in Mice and Humans

Yubin Wang et al. Cell Rep. .

Abstract

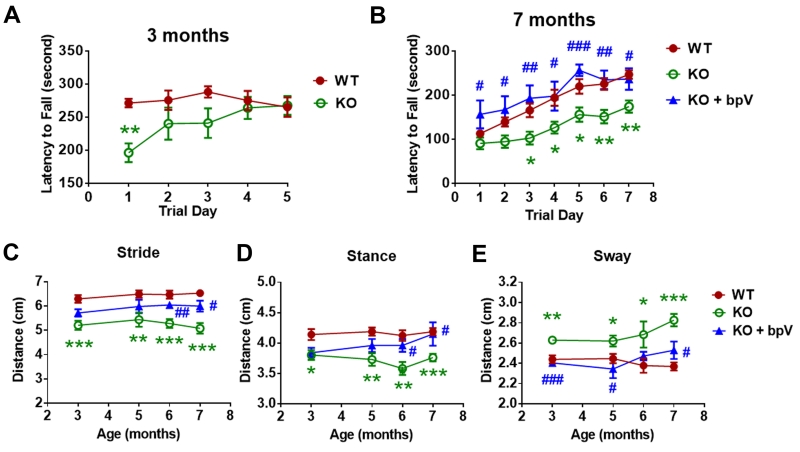
A CAPN1 missense mutation in Parson Russell Terrier dogs is associated with spinocerebellar ataxia. We now report that homozygous or heterozygous CAPN1-null mutations in humans result in cerebellar ataxia and limb spasticity in four independent pedigrees. Calpain-1 knockout (KO) mice also exhibit a mild form of ataxia due to abnormal cerebellar development, including enhanced neuronal apoptosis, decreased number of cerebellar granule cells, and altered synaptic transmission. Enhanced apoptosis is due to absence of calpain-1-mediated cleavage of PH domain and leucine-rich repeat protein phosphatase 1 (PHLPP1), which results in inhibition of the Akt pro-survival pathway in developing granule cells. Injection of neonatal mice with the indirect Akt activator, bisperoxovanadium, or crossing calpain-1 KO mice with PHLPP1 KO mice prevented increased postnatal cerebellar granule cell apoptosis and restored granule cell density and motor coordination in adult mice. Thus, mutations in CAPN1 are an additional cause of ataxia in mammals, including humans.

Keywords: apoptosis; ataxia; calpain-1; cerebellum; development.


Figures

Figure 1
Figure 1. Mutation in CANP1 gene in family R results in lack of calpain-1 expression and activity
(A) Pedigree of family R. There are at least two consanguineous loops where the parents of affected individuals are cousins. Square = male, circle = female, black symbols = affected and arrow indicated the proband. +/+ = homozygous for the mutation, +/− = heterozygous for the mutation and −/− = homozygous wild type. (B) Sagittal T1 MRI from unaffected control (left) and affected proband (right). MRI on the proband shows cerebellar atrophy and cervical spinal cord thinning; repeat MRIs showed the atrophy slowly progressed over time. (C) Homozygous splice site mutation causes an in-frame insert (arrow) in close proximity to the Cys115 active site (arrow). (D) Three-dimensional structure of WT CAPN1 protein and predicted mutant protein showing loss of active site (arrow). (E) Western blot for calpain-1, calpain-2, PHLPP1, phospho-Akt S473 (pAkt), total Akt and actin in fibroblasts from patient RK38 and two control human subjects. (F) Quantitative analysis of the ratios of PHLPP1 to actin, and pAkt to Akt in each cell line. Results represent means ± S.E.M. of 4 experiments. The replicates are different cell batches from the same patient or controls. * p < 0.05. One-way ANOVA followed by Bonferroni test. (G) Calpain-1 and -2 activities were determined in lysates of cultured fibroblasts from control or affected subjects as indicated in Methods. Results represent means ± S.E.M. of 4 experiments. * p < 0.05, ** p < 0.01. One-way ANOVA followed by Bonferroni test.
Figure 2
Figure 2. Impaired motor coordination in adult calpain-1 KO mice is rescued by postnatal bpV treatment
(A) Rotarod test of WT and calpain-1 KO mice at 3 months of age. The latency to fall from an accelerating rotarod (from 4 to 40 rpm) was measured in 3 trials per day for 5 days. Results from the 3 trials on the same day were averaged. Each value represents mean ± S.E.M.. n = 5 - 9. ** p < 0.01 WT vs. KO. Unpaired two-tailed t-test. (B) Rotarod test of WT, calpain-1 KO and bpV-injected KO mice at 7 months of age. Saline or bpV (0.5 mg/kg) was injected (ip) twice per day to calpain-1 KO mice from postnatal day (PND) 1 to 7. The latency to fall from an accelerating rotarod (from 4 to 40 rpm) was measured in 3 trials per day for 7 days. Values for the 3 trials on the same day were averaged. Each value represents means ± S.E.M. n = 9 - 14. * p < 0.05, ** p < 0.01 WT vs. KO. # p < 0.05, ## p < 0.01 KO vs. KO + bpV. One-way ANOVA followed by Bonferroni test. (C-E) Stride, stance and sway lengths of WT, KO and bpV-injected KO mice at 3-7 months of age. Results represent means ± S.E.M. n = 9 – 14. * p < 0.05, ** p < 0.01, *** p < 0.001 WT vs. KO. # p < 0.05, ### p < 0.001 KO vs. KO + bpV. One-way ANOVA followed by Bonferroni test.
Figure 3
Figure 3. Increased apoptosis during postnatal development and decreased density in adult of cerebellar granule cells in calpain-1 KO mice
(A) TUNEL staining in cerebellar sections shows increased apoptosis in cerebellum of PND7 calpain-1 KO mice and MK801-injected WT mice (i.p. injection, 0.5 mg/kg at 24, 16 and 8 h before PND7), as compared to WT and bpV-injected KO mice at the same ages. Calibration bar: 200 μm. (B) Increased apoptosis in cerebellum of PND10 calpain-1 KO mice and MK801-injected WT mice (ip injection, 0.5 mg/kg at 24, 16 and 8 h before PND10), as compared to WT mice. Calibration bar: 200 μm. (C) Number of apoptotic cells in cerebellum of WT, calpain-1 KO, MK801-injected WT and bpV-injected KO mice at different postnatal days. Apoptotic cell densities in various sections from the same cerebellum were averaged (see Methods). Results represent means ± S.E.M. n = 4 (24 sections from 4 animals in each group). ns, no significant difference versus WT. * p < 0.05, *** p < 0.001 versus WT. ## p < 0.01 versus calpain-1 KO. One-way ANOVA followed by Bonferroni test. (D) CGC density in 3-month old calpain-1 KO mice is significantly lower, as compared to WT and bpV-injected KO mice at the same age. Scale bar = 20 μm. Cell densities of sections in the same cerebellum were then averaged (see Methods for details). Results represent means ± S.E.M. n = 5. ** p < 0.01 vs. WT. # p < 0.05 vs. KO. One-way ANOVA followed by Bonferroni test. (E) Golgi stained Purkinje cell dendrites and spines in 3-month old calpain-1 KO and WT mice. Scale bar = 10 μm and 4 μm for magnified images. (F) Dendritic spine densities were analyzed as spine count over length of dendrite. N = 3 (animals) for each genotype. 12-16 sections per animal were analyzed. Distal dendritic branches between 10 and 20 μm in length were measured and averaged for a slice mean. n.s., no significant difference between the groups. Two-tailed t-test. (G) Spine morphology. Calpain-1 KO mice had significantly more thin/filopodia and less mushroom/stubby and double-headed spines as compared to WT. N = 3 (animals) for each genotype. 9-16 slices per animal were analyzed. * p < 0.05, **** p < 0.0001 WT vs. KO. Two-way ANOVA followed by Bonferroni’s test.
Figure 4
Figure 4. Reduced synapse number and evoked population spike in parallel fiber to Purkinje cell synapses in calpain-1 KO mice are reversed in DKO mice
(A) Co-staining of GluR2 and VGluT1 in cerebellar sagittal sections of 3-month old WT (C57Bl/6), calpain-1 KO (C57Bl/6 × C57/SV129) and DKO mice (C57Bl/6 × C57/SV129). Scale bar = 40 μm and 10 μm for magnified images. (B-D) Densities of GluR2 puncta, VGluT1 puncta and co-localized puncta in cerebellum of WT, calpain-1 KO and DKO mice. Means S.E.M. of 6 animals for WT and KO and 4 animals for DKO. * p < 0.05, ** p < 0.01. One-way ANOVA followed by Bonferroni test. (E) Levels of calpain-1, PHLPP1, GluR2, PSD95 and actin in whole lysates and PSD fractions of cerebellar homogenates from 3-month old WT, calpain-1 KO and DKO mice. (F) Ratios of protein levels in PSD fractions to that in whole lysates in cerebellar homogenates of WT, calpain-1 KO and DKO mice. n = 4 – 5 (animals). * p < 0.05, *** p< 0.001. One-way ANOVA followed by Bonferroni test. (G) Parallel fibers to Purkinje cell EPSPs are reduced in calpain-1 KO mice, and partially restored in DKO mice. Acute cerebellar slices were prepared as described in Methods, and field EPSPs evoked by parallel fiber stimulation recorded in the Purkinje cell layer. Results were calculated as ratios of N2 over N1, and represent means ± S.E.M. of 10-11 slices from 3-5 mice. * p <0.001, as compared to WT (Univariate Analysis of Variance followed by Bonferroni test); # p <0.001, as compared to WT (Univariate Analysis of Variance followed by Bonferroni test); § p <0.001, as compared to DKO (Univariate Analysis of Variance followed by Bonferroni test). (H) Co-immunostaining of VGluT2 (green) and Calbindin (red) in cerebellar sections of 3-month old WT, calpain-1 KO and DKO mice. Scale bar = 20 μm. (I) VGluT2 puncta densities in area 0-80% (excluding cell body layer) of Purkinje cells in cerebellum of WT, KO and DKO mice. Means ± S.E.M. of 4 animals. Ns, no significant difference. One-way ANOVA.
Figure 5
Figure 5. Increased PHLPP1 and decreased phospho-Akt levels in developing cerebellum of calpain-1 KO mice
(A) Levels of PHLPP1 and levels in cerebellar homogenates of WT and calpain-1 KO mice, at PND3, 7 and 10 and 3 months (adult). (B) Ratios of PHLPP1 to Akt, and pAkt to Akt in cerebellum of WT and calpain-1 KO mice. Results represent means ± S.E.M. n = 4 - 5. * p < 0.05, ** p < 0.01. Two-way ANOVA followed by Bonferroni test. (C) pAkt and NeuroD1 co-immunostaining in cerebellum of WT, calpain-1 KO and bpV-injected KO mice at PND7. BpV (0.5 mg/kg) was injected (i.p.) 2 h before perfusion. EGL, external granular layer. Scale bar = 40 μm. (D Mean fluorescence density (MFI) of pAkt signal in the external granular layer of cerebellum in WT, KO and bpV-injected KO mice at PND7. Means ± S.E.M. of 4 animals. * p < 0.05, ** p < 0.01. One-way ANOVA followed by Bonferroni test. E. Levels of PHLPP1 and pAkt levels 20 min after NMDA treatment (10 μM) of acute cerebellar slices from PND7 WT mice and effects of pretreatment with MK801 (50 μM), calpain inhibitor III (10 μM) and calpain-2 selective inhibitor (200 nM). (F) Ratios of PHLPP1 to Akt, and pAkt to Akt, in each group. Results represent means ± S.E.M. n = 3 - 4. *, p < 0.05 versus basal group. One-way ANOVA followed by Bonferroni test. (G) Effect of NMDA treatment of acute cerebellar slices from PND7 calpain-1 KO mice on PHLPP1 or pAkt. (H) Ratios of pAkt to Akt and PHLPP1 to Akt in each group. Results represent means ± S.E.M. n = 4. ns, no significant difference. Two-tailed t-test. (I) Ratios of protein levels after NMDA treatment to those under basal condition in cerebellar slices from PND7 WT and KO mice. n = 4. * p < 0.05, ** p < 0.01. Two-way ANOVA followed by Bonferroni test.
Figure 6
Figure 6. Calpain-1/PHLPP1 double knockout mice have increased pAkt levels and granule cell survival in cerebellum, and normal motor coordination, as compared to calpain-1 KO mice
(A) Levels of PHLPP1, calpain-1, pAKT and AKT in cerebellum of 3 PND7 calpain-1 KO and DKO mice. A WT sample was included to show normal calpain-1 band. (B) Ratios of pAkt to Akt in calpain-1 KO and DKO. Results represent means ± S.E.M. n = 5. ** p < 0.01 vs. KO. Two-tailed t-test. (C) TUNEL staining in cerebellar sections of PND7 of Calpain-1 KO, PHLPP1 KO and DKO mice. Calibration bar: 200 μm. (D) Density of apoptotic neurons in cerebellum of PND7 calpain-1 KO, PHLPP1 KO, DKO and WT mice (C57Bl/6). Results represent means ± S.E.M. n = 4 for WT and PHLPP1 KO, 5 for calpain-1 KO, 6 for DKO. **** p < 0.0001 vs. KO. One-way ANOVA followed by Bonferroni test. (E) H&E staining of CGCs in 3-month old calpain-1 KO and DKO mice. Scale bar = 20 μm. (F) CGC densities in 3-month old WT, KO and DKO mice. Results represent means ± S.E.M. n = 5. * p < 0.05, ** p < 0.01 vs. KO. One-way ANOVA followed by Bonferroni test. (G) Rotarod test of WT, calpain-1 KO, PHLPP1 KO mice and DKO mice at 7 months of age. The latency to fall represents means ± S.E.M. n = 8 - 11. * p < 0.05 WT vs. calpain-1 KO. ## p < 0.01, ### p < 0.001 calpain-1 KO vs. DKO. One-way ANOVA followed by Bonferroni test. (H-J) Stride, stance and sway lengths of WT, calpain-1 KO, PHLPP1 KO and DKO mice at 3, 4 and 5 months of age. Results represent means ± S.E.M. n = 9 – 22. * p < 0.05, ** p < 0.01 WT vs. KO. # p < 0.05, ## p < 0.01, ### p < 0.001 KO vs. DKO. One-way ANOVA followed by Bonferroni test.

References

    1. Altman J. Postnatal development of the cerebellar cortex in the rat. 3. Maturation of the components of the granular layer. J Comp Neurol. 1972;145:465–513. - PubMed
    1. Amadoro G, Pieri M, Ciotti MT, Carunchio I, Canu N, Calissano P, Zona C, Severini C. Substance P provides neuroprotection in cerebellar granule cells through Akt and MAPK/Erk activation: evidence for the involvement of the delayed rectifier potassium current. Neuropharmacology. 2007;52:1366–1377. - PubMed
    1. Arias E, Koga H, Diaz A, Mocholi E, Patel B, Cuervo AM. Lysosomal mTORC2/PHLPP1/Akt Regulate Chaperone-Mediated Autophagy. Mol Cell. 2015;59:270–284. - PMC - PubMed
    1. Balazs R, Jorgensen OS, Hack N. N-methyl-D-aspartate promotes the survival of cerebellar granule cells in culture. Neuroscience. 1988;27:437–451. - PubMed
    1. Barlow C, Hirotsune S, Paylor R, Liyanage M, Eckhaus M, Collins F, Shiloh Y, Crawley JN, Ried T, Tagle D, Wynshaw-Boris A. Atm-deficient mice: a paradigm of ataxia telangiectasia. Cell. 1996;86:159–171. - PubMed

MeSH terms

Supplementary concepts