. 2016 Jun 28;16(1):222-231.
doi: 10.1016/j.celrep.2016.05.076. Epub 2016 Jun 16.

A Concentration-Dependent Liquid Phase Separation Can Cause Toxicity upon Increased Protein Expression

Affiliations

A Concentration-Dependent Liquid Phase Separation Can Cause Toxicity upon Increased Protein Expression

Benedetta Bolognesi et al. Cell Rep. .

Abstract

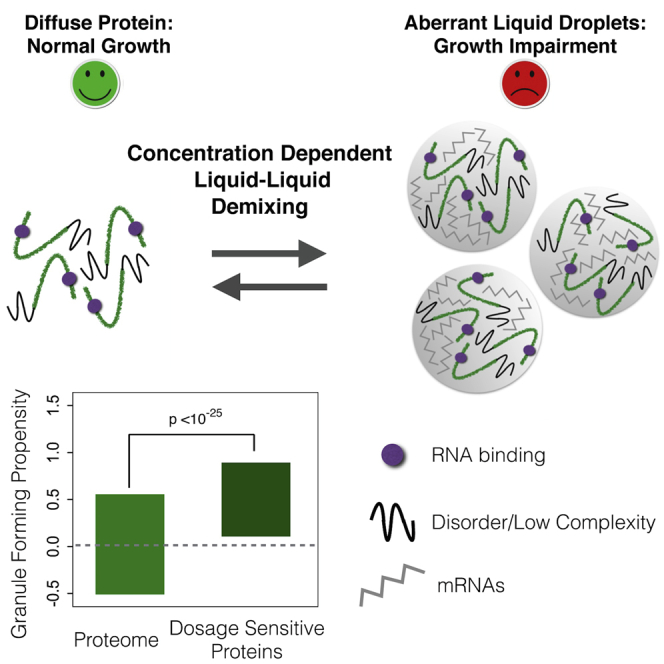
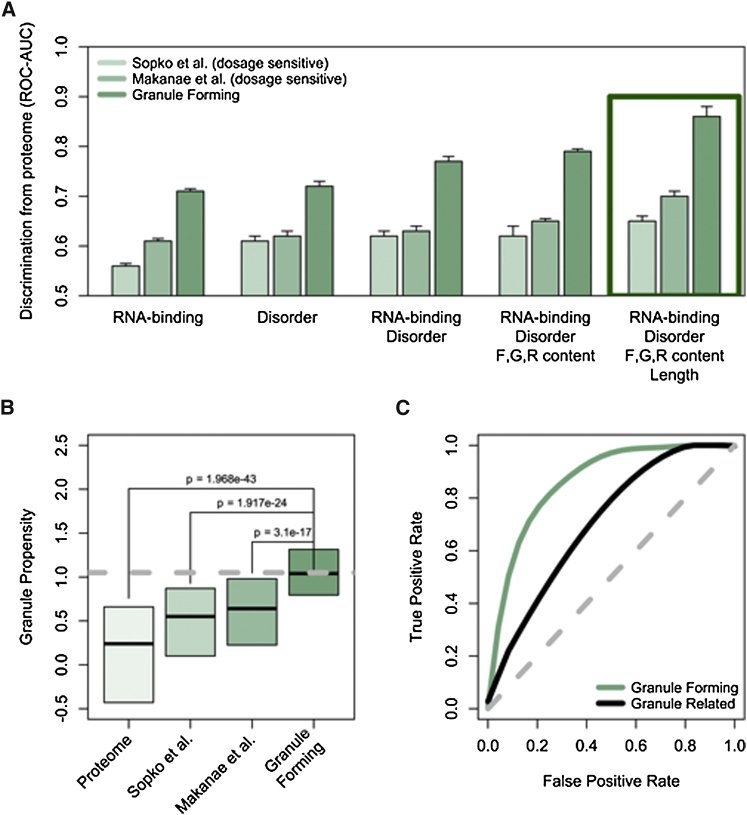
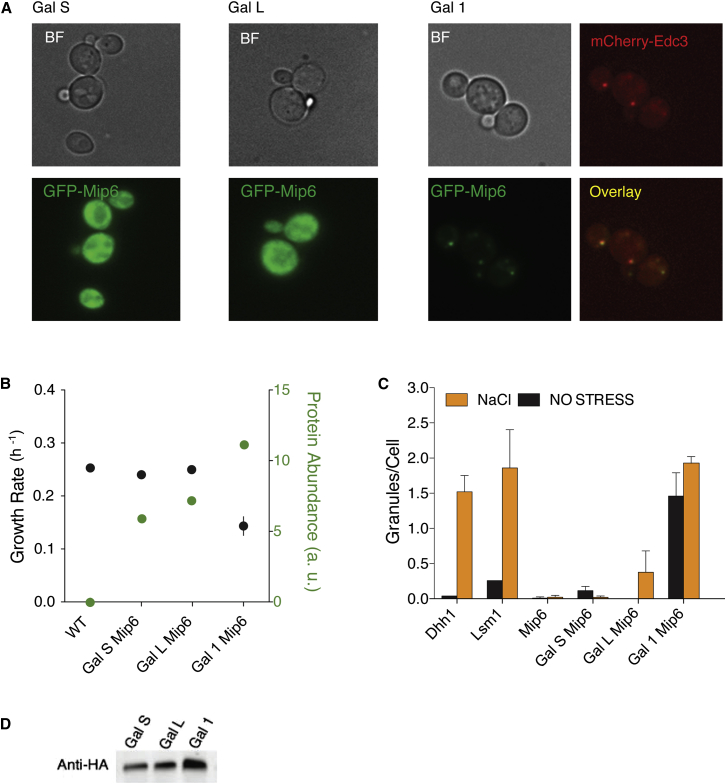
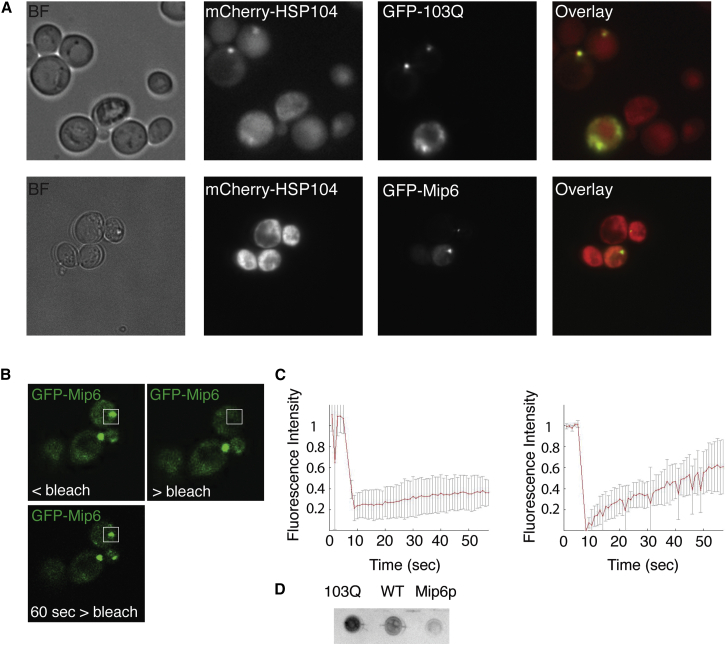
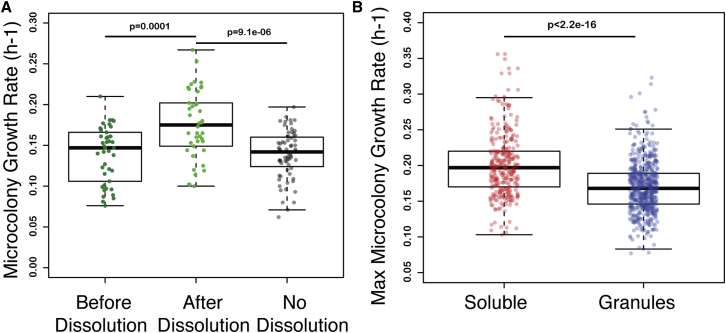
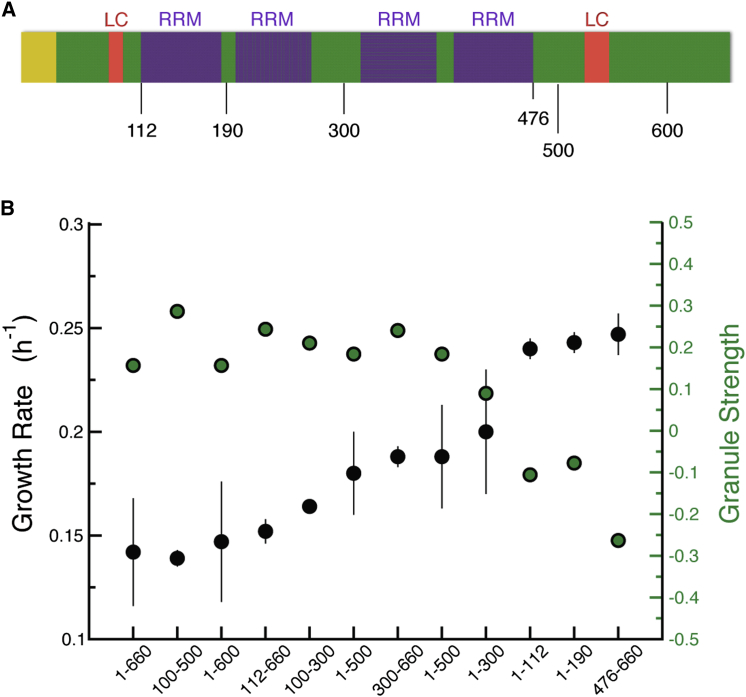
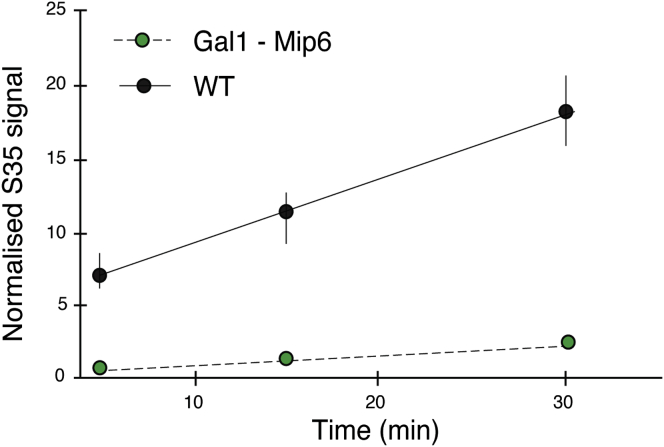
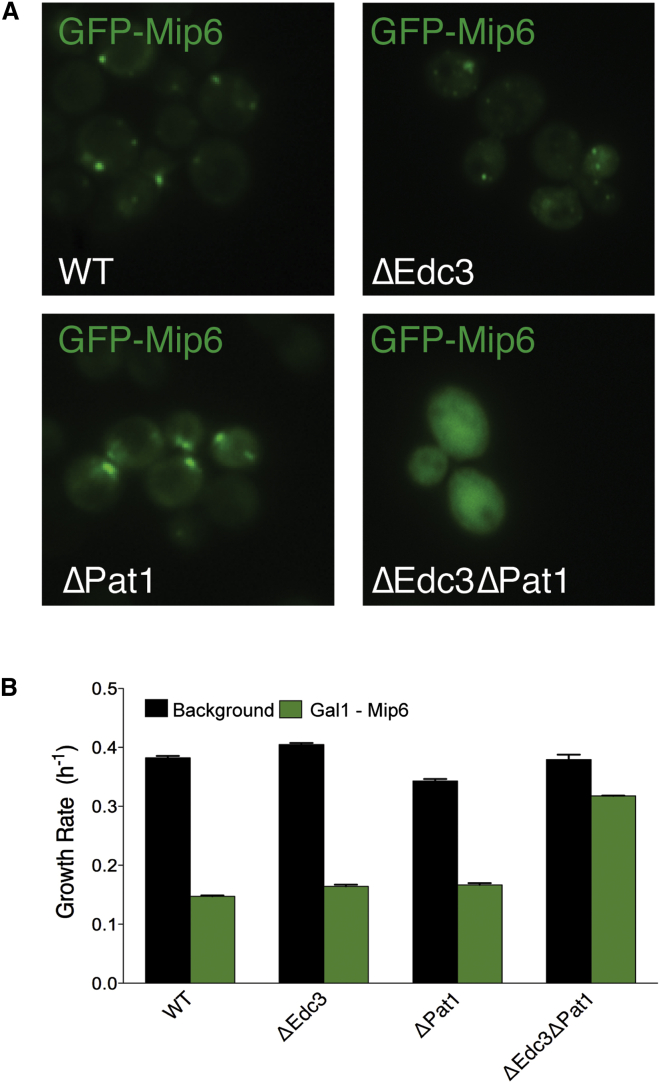
Multiple human diseases are associated with a liquid-to-solid phase transition resulting in the formation of amyloid fibers or protein aggregates. Here, we present an alternative mechanism for cellular toxicity based on a concentration-dependent liquid-liquid demixing. Analyzing proteins that are toxic when their concentration is increased in yeast reveals that they share physicochemical properties with proteins that participate in physiological liquid-liquid demixing in the cell. Increasing the concentration of one of these proteins indeed results in the formation of cytoplasmic foci with liquid properties. Demixing occurs at the onset of toxicity and titrates proteins and mRNAs from the cytoplasm. Focus formation is reversible, and resumption of growth occurs as the foci dissolve as protein concentration falls. Preventing demixing abolishes the dosage sensitivity of the protein. We propose that triggering inappropriate liquid phase separation may be an important cause of dosage sensitivity and a determinant of human disease.


Figures

None
Graphical abstract
Figure 1
Figure 1
Dosage-Sensitive Proteins Have an Intrinsic Propensity for Liquid-Liquid Phase Separation (A) Ability of physico-chemical features to discriminate dosage-sensitive and granule forming sets from the rest of the yeast proteome. The area under the receiver operating characteristic curve (AUC) is used to measure performances of individual properties and combinations of them. Performances of the catGRANULE algorithm (Experimental Procedures) are highlighted with a green square. (B) Distribution of granule propensities calculated with catGRANULE (Experimental Procedures) for annotated granule forming proteins (n = 120), dosage-sensitive proteins as reported in Sopko et al. (2006) (n = 770) and Makanae et al. (2013) (n = 777) and the rest of the S. cerevisiae proteome (n = 3,726). Boxes represent the range between the 25th and 75th percentile. Grey dashed line indicates the propensity value for Mip6p. (C) Performance of the model on “granule forming” genes (AUC: 0.86) and on the independent test set “granule related” genes (AUC: 0.72). See also Table S1 for full table of ORFs. See also Figure S1.
Figure 2
Figure 2
Mip6p Changes Localization when Overexpressed (A) Cellular localization of Mip6-GFP at different levels of overexpression. Co-localization with Edc3p is observed when Mip6 is expressed from the Gal1 promoter. (B) Growth rates of strains expressing Mip6 under the control of different promoters, error bars represent SDs of three independent replicates. (C) Number of foci per cell as counted by monitoring GFP-tagged endogenous levels of Dhh1, Lsm1, and Mip6 in BY4741 (left), or counted in the same strains as in A); 50–100 cells for each condition were counted. (D) Western blot where an antibody against HA was used to detect different amounts of Mip6p upon expression under weak (GalS), medium (GalL), and strong (Gal1) promoters. See also Figure S2.
Figure 3
Figure 3
Mip6p Foci Have Liquid Properties (A) Localization of the chaperone Hsp104 in cells showing either 103Q assemblies or Mip6p cytoplasmic foci. (B) An example of fluorescence recovery after photobleaching for Mip6p foci. (C) Average trends of fluorescence recovery after photo-bleaching for 103Q (left) and Mip6p (right) cytoplasmic assemblies. (D) Dot blot assay showing differential binding of the OC conformational antibody to protein extracts from wild-type (WT) cells or cells expressing 103Q or Mip6p. See also Figures S3 and S4.
Figure 4
Figure 4
Growth Resumes after Dissolution of Foci (A) Average growth rates quantified by automated micro-colony growth assay before dissolution of cytoplasmic Mip6p assemblies (dark green), after their dissolution (light green), or for the colonies in which dissolution was not observed (gray). Boxes represent the 95% confidence interval (CI), while points correspond to the growth rate measurements of all individual micro-colonies. (B) Average growth rate during re-growth after FACS sorting for cells displaying cytoplasmic assemblies (blue) and cells displaying soluble fluorescence (red). See also Figures S3 and S4 and Movies S1, S2, and S3.
Figure 5
Figure 5
Protein Domains Able to Form Foci Impair Growth when Overexpressed (A) A scheme of MIP6p sequence as annotated by ELM (Dinkel et al., 2016) (yellow, disordered region; purple, RNA recognition motifs; red, low complexity sequences. (B) Growth rate (black) of strains overexpressing Mip6p truncated variants with corresponding granule strength (green). Error bars represent SD of three independent replicates. Granule strength is calculated on fragments extracted from the Mip6p profile (Figure S7B) as explained in the Experimental Procedures. See also Figure S5.
Figure 6
Figure 6
Translation Rates Are Reduced in Cells Overexpressing Mip6p S35Met incorporation over time as measured in WT cells and in cells overexpressing Mip6p, where cytoplasmic foci are evident and fitness is impaired.
Figure 7
Figure 7
Mip6p Cytoplasmic Foci Are Causative of Fitness Impairment (A) Cellular localization of Mip6p when overexpressed in different genetic deletion backgrounds. (B) Growth rate of strains overexpressing Mip6p in different genetic deletion backgrounds. The Gal1 promoter is integrated at the endogenous Mip6 locus. Error bars represent SD of three independent replicates. See also Figure S6.

References

    1. Brangwynne C.P., Eckmann C.R., Courson D.S., Rybarska A., Hoege C., Gharakhani J., Jülicher F., Hyman A.A. Germline P granules are liquid droplets that localize by controlled dissolution/condensation. Science. 2009;324:1729–1732. - PubMed
    1. Brangwynne C.P., Mitchison T.J., Hyman A.A. Active liquid-like behavior of nucleoli determines their size and shape in Xenopus laevis oocytes. Proc. Natl. Acad. Sci. USA. 2011;108:4334–4339. - PMC - PubMed
    1. Castello A., Fischer B., Eichelbaum K., Horos R., Beckmann B.M., Strein C., Davey N.E., Humphreys D.T., Preiss T., Steinmetz L.M. Insights into RNA biology from an atlas of mammalian mRNA-binding proteins. Cell. 2012;149:1393–1406. - PubMed
    1. Decker C.J., Parker R. P-bodies and stress granules: possible roles in the control of translation and mRNA degradation. Cold Spring Harb. Perspect. Biol. 2012;4:a012286. - PMC - PubMed
    1. Deléage G., Roux B. An algorithm for protein secondary structure prediction based on class prediction. Protein Eng. 1987;1:289–294. - PubMed

MeSH terms

Substances

LinkOut - more resources