. 2016 Jun 20:7:11957.
doi: 10.1038/ncomms11957.

CRF-like receptor SEB-3 in sex-common interneurons potentiates stress handling and reproductive drive in C. elegans

Affiliations

CRF-like receptor SEB-3 in sex-common interneurons potentiates stress handling and reproductive drive in C. elegans

Changhoon Jee et al. Nat Commun. .

Abstract

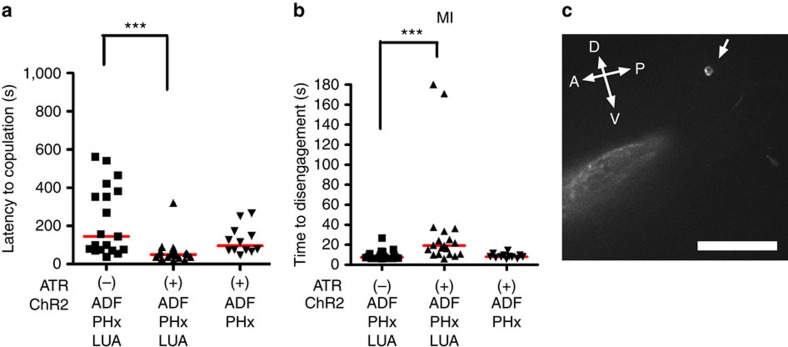
Environmental conditions can modulate innate behaviours. Although male Caenorhabditis elegans copulation can be perturbed in the presence of stress, the mechanisms underlying its decision to sustain copulation are unclear. Here we describe a mating interference assay, which quantifies the persistence of male C. elegans copulation in noxious blue light. We show that between copulations, the male escapes from blue light illumination at intensities over 370 μW mm(-2). This response is attenuated in mutants with constitutive activation of the corticotropin-releasing factor receptor family homologue SEB-3. We show that activation of this receptor causes sex-common glutamatergic lumbar ganglion interneurons (LUA) to potentiate downstream male-specific reproduction circuits, allowing copulatory behaviours to partially override the light-induced escape responses in the male. SEB-3 activation in LUA also potentiates copulation during mild starvation. We suggest that SEB-3 activation allows C. elegans to acclimate to the environment and thus continue to execute innate behaviours even under non-optimal conditions.


Figures

Figure 1
Figure 1. Persistence of male mating with a vulvaless hermaphrodite.
A virgin WT male was paired with a vulvaless, static hermaphrodite on a NGM plate with E. coli as a food source. The males' activity was recorded for 100 min. (a) Summary of the behavioural transitions of a male mating with a vulvaless hermaphrodite. The male initiates copulation when its tail contacts the hermaphrodite. The male moves backwards along the hermaphrodite's cuticle, while it scans for the vulva. When the tail reaches the end of the hermaphrodite' body, the male turns to the other and continues backward. When turning at the ends of the hermaphrodite or scanning along its cuticle, the male would disengage from its partner. Shortly, it returns to the hermaphrodite and reinitiate copulation behaviour as shown in b. (b) Copulatory behaviour of a single male with a vulvaless static hermaphrodite was recorded for 100 min. ‘Mating' indicates the duration from contact to disengagement. (c) The left y axis represents the duration of the first copulatory act as indicated in b and the right y axis displays the amount of time a WT male spends copulating without extinction (n=9). Bar represents mean on the left and the error bar represents s.d. on the right.
Figure 2
Figure 2. The MI assay measures motivation.
(a) Steps in the MI assay under 725 μW mm−2 blue light. The blue dot denotes activation of blue light and the time is specified. The worm in the centre of each image is the hermaphrodite; neither its head nor its tail are visible. In contrast, the smaller male moves around in the different images; the male's tail is indicated by a closed arrow and the male's head is indicated by an open arrow. (b) Behavioural quantification of copulation tenacity against the blue light irritant. The x axis indicates the blue light intensity used. Thw y axis indicates the amount of time it took a copulating male to disengage from a hermaphrodite after the blue light had been turned on. N=12, 18, 20, 24, 20, 10 and 11 (from left to right in order of each group). (c) The latency to blue light (450 μW mm−2) aversion is attenuated in copulating males. The x axis indicates the behavioural state of the male before blue light activation. The y axis indicates the time from blue light activation to first directional change, even if in the case of mating males, they remain at the hermaphrodite. N number is 30 (non-copulating WT) and 14 (copulating WT). (d) The MI assay on non-virgin males using 370 μW mm−2 blue light. The x axis indicates the amount of time a male was incubated with a hermaphrodite (WD; withdrawal from hermaphrodite). N=10, 12, 10 and 10 (from left to right in order of each group). The y axis indicates the time it took a male to leave its partner. Mann–Whitney test indicated; **P<0.01, ***P<0.001.
Figure 3
Figure 3. Activation of SEB-3 results in enhanced motivation.
(a) Quantification of seb-3 mutants' copulation tenacity using the MI assay. Tenacity of copulation is represented by the time of disengagement (y axis) under different intensities of blue light irritant (μW mm−2) (x axis). N=39, 38, 39, 40, 37, 40, 30, 30, 30, 10, 10 and 10 (from left to right in order of each group). **P<0.01 and ***P<0.001 (Mann–Whitney test). (b) Non-copulating seb-3 mutant males avoid blue light, similar to WT males. The response to blue light (450 μW mm−2) was determined when the crawling male stops its movement and changes direction to escape the illuminated area (y axis). N=30, 25, 17, 20, 22 and 20 (from left to right in order of each group). *P<0.05 (Mann–Whitney test).
Figure 4
Figure 4. SEB-3 reinforces the mating drive of males.
(a,c,e,g) Latency to initiate copulation before blue light exposure. (b,d,f,h) The MI assay was conducted under 370 μW mm−2 intensity of blue light exposure. The latency to copulate and time to disengagement in MI assay are shown for copulation-deprived males (a,b), postcoital males (c,d), males at 2 h recovery post copulation (e,f) and males at 3 h 30 min recovery post copulation (g,h). *P<0.05, **P<0.01 and ***P<0.001 (Mann–Whitney test).
Figure 5
Figure 5. Expression of seb-3 in the male tail.
(a) A 3-kb promoter was fused with GFP. The same promoter region drives [SEB-3(gf)::DsRed] in WT and [SEB-3(WT)::DsRed] in seb-3 lf mutant. (b) Florescent image of a L4 male tail expressing Pseb-3:GFP. D, DVA and DVB; E, DVE and DVF neurons; L, LUAL and LUAR; P, PVC; PAG, pre-anal ganglia. A, anterior; D, dorsal; P, posterior; V, ventral. Scale bar, 10 μM. (c) seb-3-expressing interneurons and their reciprocal connections in the male tail.
Figure 6
Figure 6. Potentiation of mating by SEB-3 drive requires LUA neurons.
(a) Measurement of transgenic animals' time to disengagement (y axis) in response to 500 μW mm−2 blue light exposure (N=20 and 21). (b) Measurement of transgenic animals' time to disengagement (y axis) in response to 450 μW mm−2 blue light exposure (N=24 and 24). (c) Measurement of time to disengagement when neurons are ablated in a seb-3(gf) mutant background. The MI assay was conducted under moderate intensity of blue light (370 μW mm−2). N=20, 10, 15, 12, 12, 14, 16, 12 and 12 (from left to right in order of each group). (d,e) Neuron-specific potentiation of the male mating circuit. (d) SEB-3(gf) was expressed in the indicated neurons (x axis) of wild-type males. N number is 30, 30 and 24 (from left to right in order of each group). (e) SEB-3(WT) was expressed in the indicated neurons (x axis) of seb-3(lf) males. N=25, 19 and 21 (from left to right in order of each group). The MI assay was conducted under 400 μW mm−2 blue light (d,e). *P<0.05, **P<0.01 and ***P<0.001 (Mann–Whitney test).
Figure 7
Figure 7. SEB-3 potentiates mating drive via the LUA neurons.
(a) The MI assay (50 μW mm−2) was conducted for each step of copulation with vulva-containing hermaphrodites (x axis). Bar represents median as shown in other MI assay and N=16, 16 and 14 (from left to right in order of each group). (b) Ca2+ transients in LUA neurons of non-copulating and copulating males. The y axis represents the ratio of G-CaMP (green) to DsRed fluorescence during the indicated behaviours. Bar represents mean with s.e.m. and N=5 for each group. (c) Ca2+ transients in LUA neurons of one male during scanning and prodding mating behaviours. The x axis is time in seconds. The y axis is %ΔF/F0. The image is of the LUA fluorescence in a 1-day-old adult male. A, anterior; D, dorsal; P, posterior; V, ventral. Scale bar, 10 μM. (d) Summary of Ca2+ transients of five males analysed as in c. Each point is the average of the %ΔF/F0 during the indicated behaviour (x axis). Each number represents an individual male. Bar represents mean with s.e.m. and N=5 (WT) and 4 (seb-3lf). *P<0.05 and ***P<0.001 (Mann–Whitney test). Inserted, male fully inserting his spicules into the vulva; Prod, male prodding its copulatory spicules at the vulva slit; Scan, male scanning the hermaphrodite cuticle.
Figure 8
Figure 8. Optogenetic activation of LUA is sufficient to enhance mating drive and tenacity of copulation.
ChR2::YFP is expressed in the ADF, PHx and LUA of seb-3 (lf) males using the Q binary expression system. (a) Latency to initiate copulation before blue light exposure. N=19, 19 and 12 (from left to right in order of each group). ‘ATR' refers to all-trans retinal. (b) The MI assay was conducted under 450 μW mm−2 intensity of blue light in [ChR2::YFP]-expressed seb-3 (lf) males. N=19, 19 and 12 (from left to right in order of each group). ‘ATR' refers to all-trans retinal. (c) Arrow indicates LUA neurons that express [ChR2::YFP] in the L4 male tail. Scale bar, 10 μM. ***P<0.001 (Mann–Whitney test).
Figure 9
Figure 9. Stress induces enhanced mating drive through activation of the SEB-3.
(a) The MI assay (450 μW mm−2) was conducted on WT males in well-fed and food-deprived conditions and on LUA neurons-ablated WT males in the food-deprived condition. N=15, 15, 12 and 12 (from left to right in order of each group). (b) Ca2+ transients in LUA neurons of non-copulating WT males and seb-3 (lf) males. The y axis represents the ratio of G-CaMP (green) to DsRed fluorescence with or without food for 120 min (x axis). Each number indicates the same individual male in the presence and absence of food. N=4 for each group. (c) seb-3 mutant respond to food deprivation during MI assay conducted using 450 μW mm−2 blue light. N=29, 25, 25, 25, 15 and 13 (from left to right in order of each group). *P<0.05, **P<0.01 and ***P<0.001 (Mann–Whitney test). (d) Model of stress-elicited enhanced mating drive via LUA in mating circuits.

References

    1. de Wied D. & Gispen W. H. in Peptides in Neurobiology ed. Gainer H. 397–448Springer US (1977).
    1. Schally A. V. Aspects of hypothalamic regulation of the pituitary gland. Science 202, 18–28 (1978). - PubMed
    1. Hetherington A. W. & Ranson S. W. The spontaneous activity and food intake of rats with hypothalamic lesions. Am J Physiol. Legacy Content 136, 609–617 (1942).
    1. Britton K. T., Lee G., Dana R., Risch S. C. & Koob G. F. Activating and ‘anxiogenic' effects of corticotropin releasing factor are not inhibited by blockade of the pituitary-adrenal system with dexamethasone. Life Sci. 39, 1281–1286 (1986). - PubMed
    1. Müller M. B. et al. Limbic corticotropin-releasing hormone receptor 1 mediates anxiety-related behavior and hormonal adaptation to stress. Nat. Neurosci. 6, 1100–1107 (2003). - PubMed

Publication types

MeSH terms

Substances

LinkOut - more resources