. 2016 Jun 30;166(1):181-92.
doi: 10.1016/j.cell.2016.05.029. Epub 2016 Jun 16.

Dynamic Axonal Translation in Developing and Mature Visual Circuits

Affiliations

Dynamic Axonal Translation in Developing and Mature Visual Circuits

Toshiaki Shigeoka et al. Cell. .

Abstract

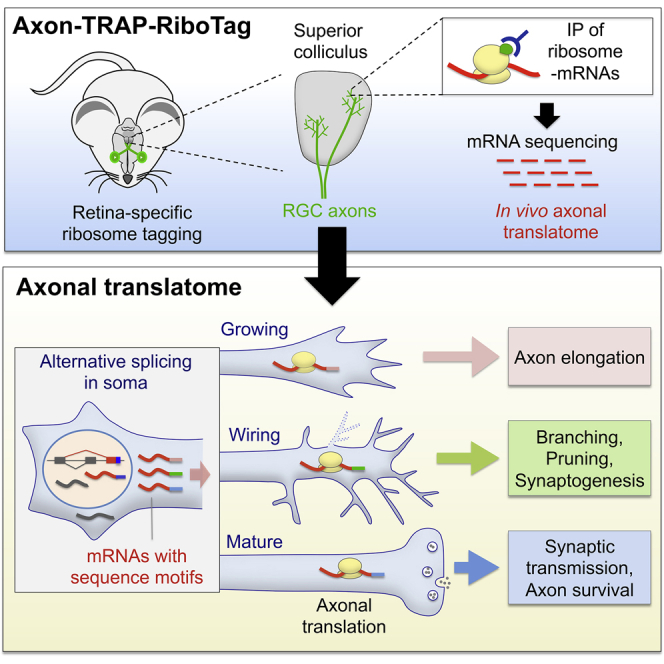
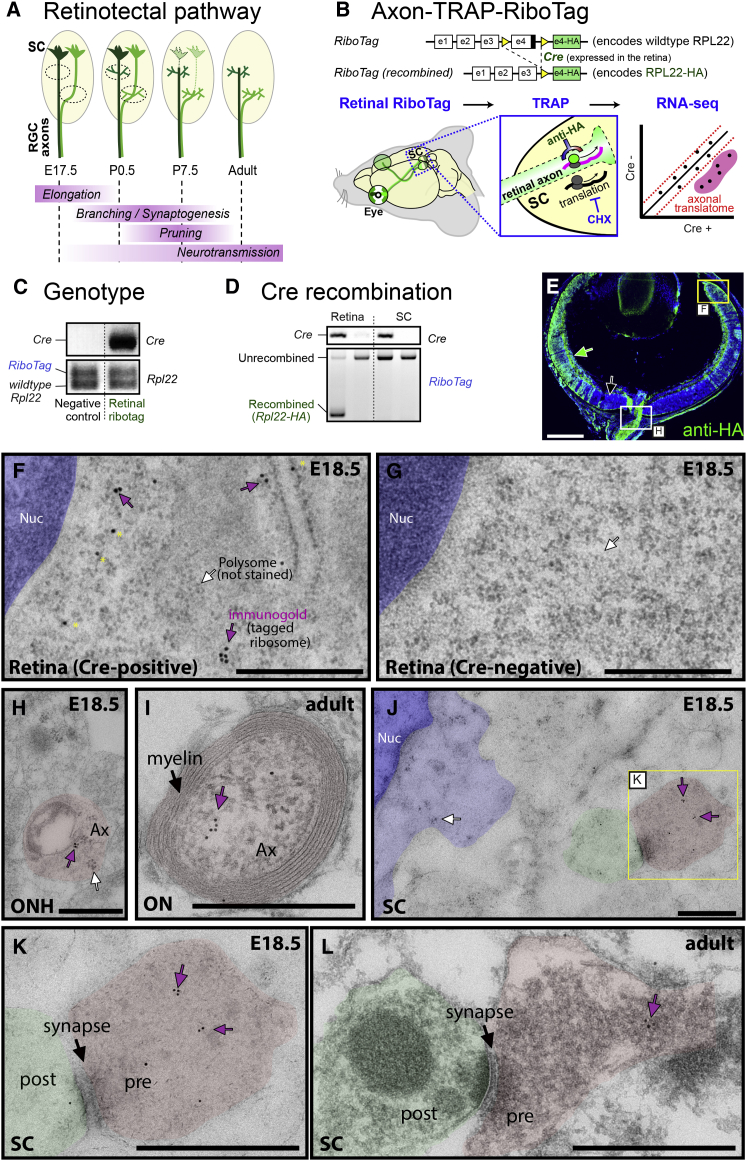
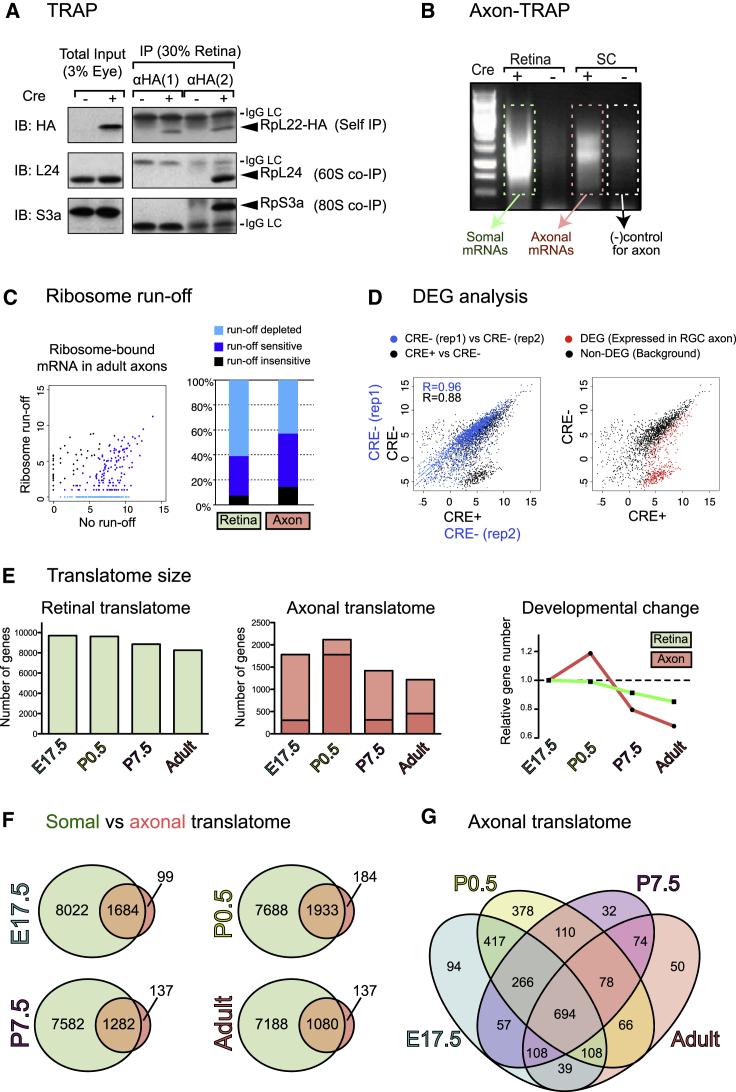
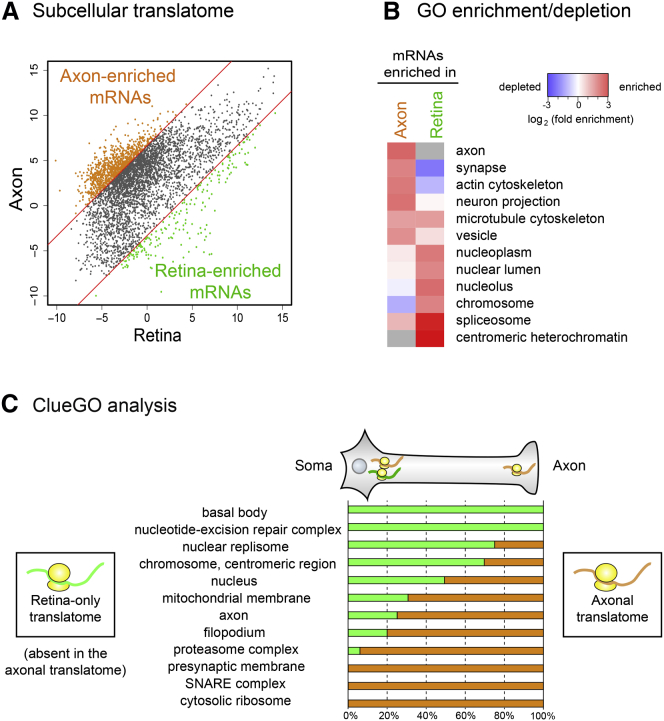
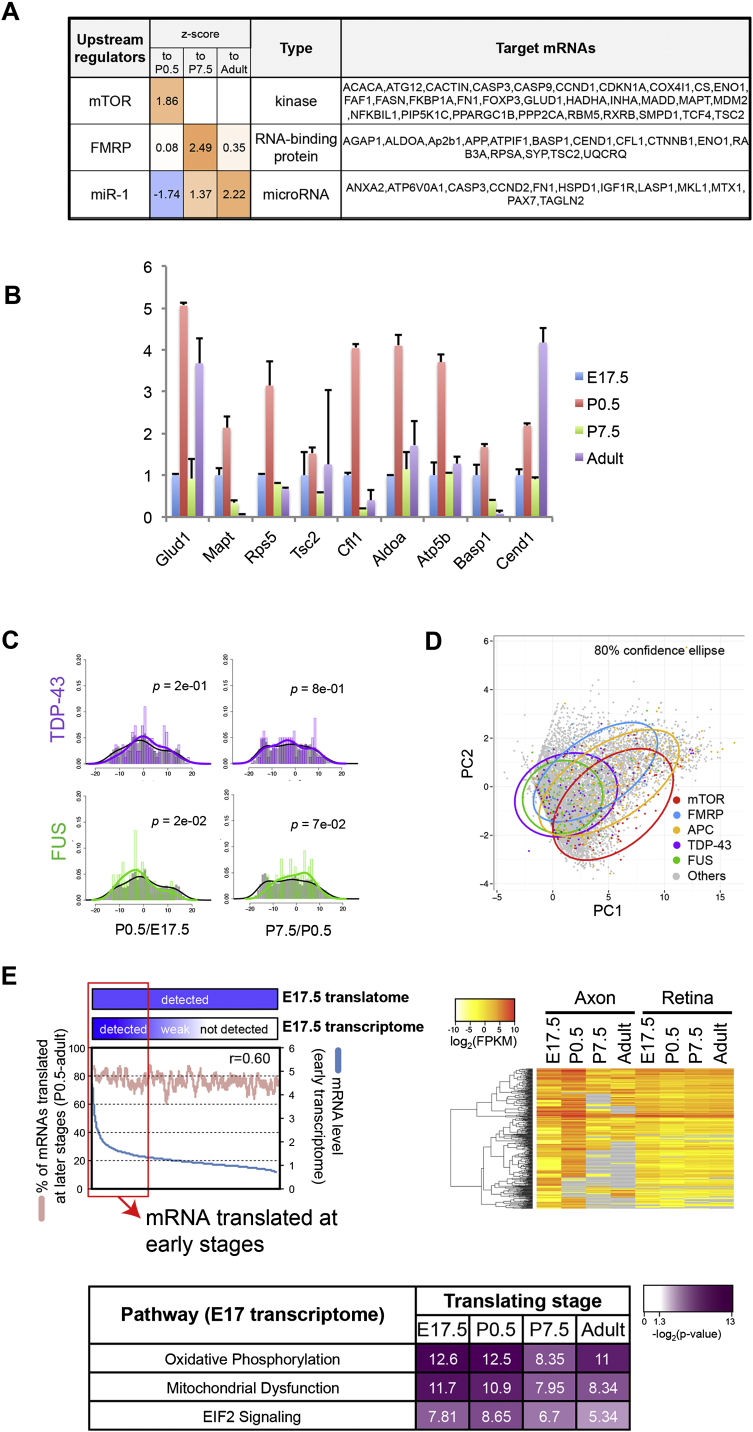
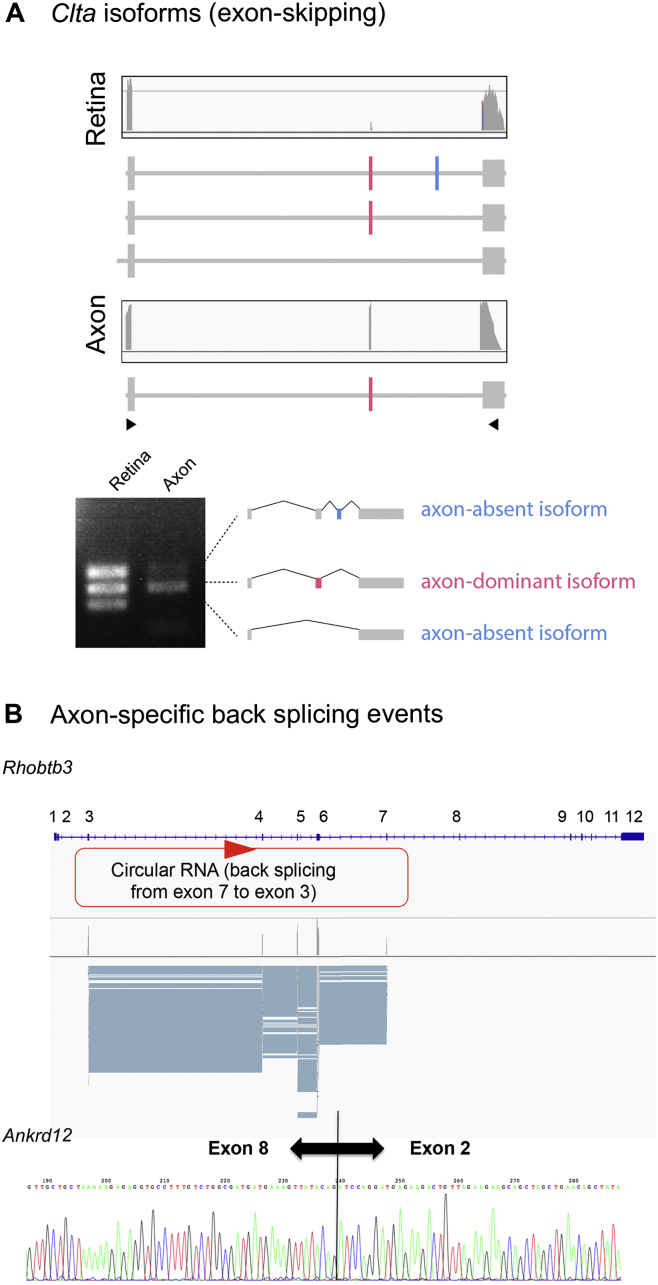
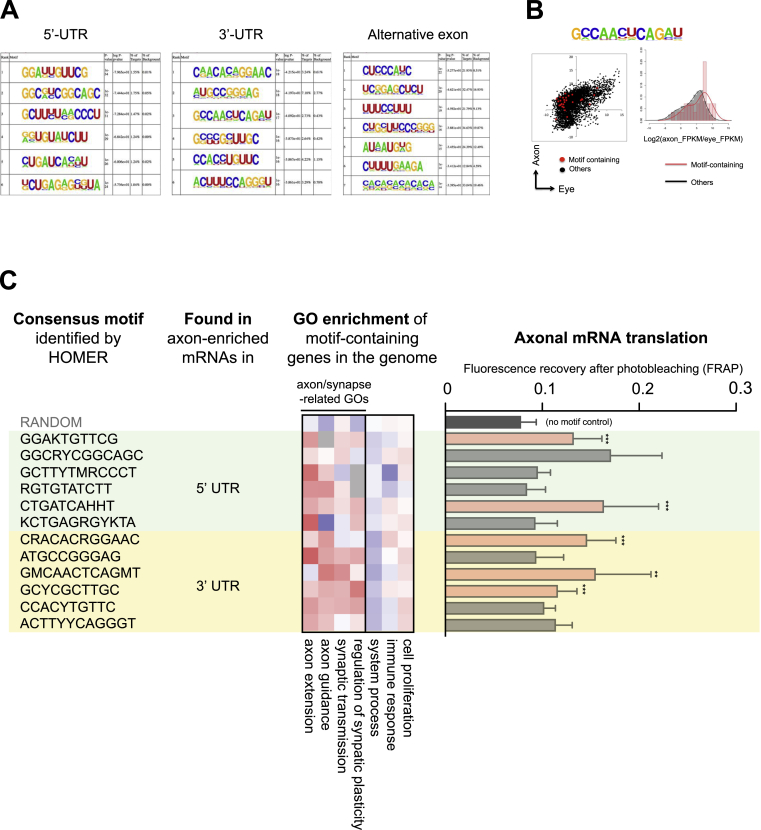
Local mRNA translation mediates the adaptive responses of axons to extrinsic signals, but direct evidence that it occurs in mammalian CNS axons in vivo is scant. We developed an axon-TRAP-RiboTag approach in mouse that allows deep-sequencing analysis of ribosome-bound mRNAs in the retinal ganglion cell axons of the developing and adult retinotectal projection in vivo. The embryonic-to-postnatal axonal translatome comprises an evolving subset of enriched genes with axon-specific roles, suggesting distinct steps in axon wiring, such as elongation, pruning, and synaptogenesis. Adult axons, remarkably, have a complex translatome with strong links to axon survival, neurotransmission, and neurodegenerative disease. Translationally co-regulated mRNA subsets share common upstream regulators, and sequence elements generated by alternative splicing promote axonal mRNA translation. Our results indicate that intricate regulation of compartment-specific mRNA translation in mammalian CNS axons supports the formation and maintenance of neural circuits in vivo.


Figures

None
Graphical abstract
Figure 1
Figure 1
Retinal RiboTag Labels RGC Axonal Ribosomes In Vivo (A) Development of retinal ganglion cell (RGC) axons in the superior colliculus (SC). (B) Strategy of axon-TRAP. (C) PCR detection of Cre transgene (upper) and Rpl22 allele (lower). (D) PCR of genomic DNA from the retina and the SC that distinguish recombined and unrecombined RiboTag alleles. (E) HA fluorescence immunohistochemistry. (F–L) HA immuno-gold electron microscopy (EM). HA-tagged ribosomes localize to retinal cell bodies (F) and RGC axons (Ax) in the optic nerve head (ONH) (H), optic nerve (ON) (I), and RGC axon terminals in the SC (J and K). Two or more adjacent gold particles (purple arrows) were regarded as specific signals. Scattered single immuno-gold particles may be non-specific (yellow asterisks). Ultrastructure of polysomes is visible in the cell bodies in the retina and the SC (white arrows), but these co-localize with immuno-gold only in the retina (F). Cre-negative littermate shows no specific labeling (G). E, embryonic day; Nuc, nucleus; P, postnatal day. The scale bars represent 500 μm (E) and 500 nm (F–L). See also Figure S1.
Figure 2
Figure 2
Unbiased Identification of the Axonal Translatome (A) HA-labeled ribosomes were TRAPed by two independent antibodies against HA, and then co-immunoprecipitated ribosomal proteins from 60S (i.e., rpL24) and 40S (i.e., rpS3a) were visualized by western blot. IgG LC, immunoglobulin G light chain. (B) Double-strand cDNAs were made from TRAPed RNAs. (C) Read counts of adult SC samples with or without ribosome run-off. Left panel is a scatter plot of log2 (read count+1), and right panel represents the percentage of genes whose read counts were decreased by run-off. (D) A scatterplot of log2 (FPKM) between Cre-positive/-negative (x axis) and Cre-negative axons (y axis) at stage P0.5. (E) Change in numbers of DEGs in the retina and axon. For axon, dark pink indicates DEGs at the corresponding stages. Light pink indicates genes that are DEGs only at that stage. Combined value of orange and peach (union of DEGs) indicates the size of axonal translatome. (F) Somal versus axonal translatomes. (G) Four different axonal translatomes. See also Figure S2.
Figure 3
Figure 3
Comparison between the Axonal and Retinal Translatomes (A) Normalized mRNA levels (log2(FPKM)) between the axonal (y axis) and retinal (x axis) translatome at stage P0.5. Axon- and retina-enriched population were defined when FPKMaxon/FPKMretina > 100 and <0.1, respectively. (B) GO terms in the cellular component category. More detailed lists are in Figure S3B (gray, not detected). (C) ClueGO analysis. The left axis indicates the parental GO terms. The percentage of daughter GO terms associated with somal and axonal translatome is presented. See also Figure S3.
Figure 4
Figure 4
Developmental Changes of Translated Genes in RGC Axons (A) Enriched GO (biological process) terms and Kyoto Encyclopedia of Genes and Genomes (KEGG) pathways for axonally translated genes (grey, not detected), sorted by significance for each stage (Fisher’s exact test). The enrichment was analyzed by topGO (Table S3). Statistically significant cells are marked by black squares. (B) Normalized levels of axonal translation for selected genes (gray, not detected). See also Figure S4.
Figure 5
Figure 5
Trans-Acting Elements that Regulate the Axonal Translatome (A) Density plots of the change in FPKM values of axonal translatomes during two consecutive developmental stages (log2(stage A [FPKM]/stage B [FPKM]); gray, distribution of all genes; colors, distribution of target genes) with p values (Kolmogorov-Smirnov test). (B) Average log2 (FPKM) values of target genes (mean ± 95% confidence interval). (C) Representative immunofluorescence images (left) and their quantification (right; mean ± SEM). ∗∗∗p < 0.001, Mann-Whitney test. The scale bar represents 10 μm. (D) Relationship between transcript abundance of genes not detected in E17.5 axonal translatome (read count = 0) and probability of their translation at later stages (upper left: blue line, mRNA level in transcriptome; red line, moving averages of percentage of genes detected at any of three later stages over a window size of 100 genes; r, Pearson correlation coefficient). The upper right and lower heatmaps show mRNA abundance in the translatome and enriched regulators/pathways, respectively. See also Figure S5.
Figure 6
Figure 6
Alternative Splicing Generates High Isoform Diversity in Axons (A) Percentage of genes with alternative events from all axonally translated genes. Alternative events are classified into five different classes depicted in the left panel. (B) Scatter and density plots for the distribution of percentage spliced in (Ψ) values between the retina (x axis) and the axon (y axis). (C) Model for biased distribution of Ψ values in the axon. The comparison of two isoforms suggests that one of two isoforms is predominant in the axon. (D and E) The sequence reads on Acot7 and Stx3 loci visualized with integrative genomics viewer (IGV). The histograms show the depth of the reads displayed at each locus. The retinal isoforms are detected only in the retinal translatome, whereas the axonal isoforms are detected both in the axonal and retinal translatomes. See also Figure S6.
Figure 7
Figure 7
Cis-Regulatory Elements Link Alternative Splicing to Axonal Translation (A and B) Axon- and retina-specific Acot7 and Stx3 UTR isoforms fused with myr-d2EGFP were expressed in cultured RGCs (Xenopus). Quantification of fluorescence intensity after photobleaching (FRAP) revealed axon-specific isoforms of Acot7 (A) and Stx3 (B) markedly increase axonal translation of the myr-d2EGFP reporter construct compared to retina-specific UTR counterparts. Data at each 1 min time point represent the mean fraction of recovery relative to pre- and post-bleach levels ± SEM (n = 9 and 10 for axon and eye-specific 5′ UTR of Acot7, respectively; n = 14 and 14 for axon and eye-specific 3′ UTR of Stx3, respectively). ∗∗∗p < 0.0001; two-way ANOVA. FRAP signal recovery was abolished by 40 μM anisomycin (10 min post-photobleach: Acot7 axon-isoform + anisomycin 0.064 ± 0.028; Stx3 axon-isoform + anisomycin 0.085 ± 0.026). Representative images of RGC axonal growth cones showing fluorescent recovery after photobleaching for each reporter construct are shown (right). The scale bars represent 10 μm. (C) GO enrichment analysis for entire genome containing axon-specific sequence motifs associated with alternative exons (S: G or C) and their relative efficiency in axonal mRNA translation using myr-d2EGFP reporter constructs. Significance of FRAP recovery curves were compared to no UTR control across 10 min (n ≥ 10 for each construct). Statistical significance of FRAP compared to the no-UTR control was tested across all time points (1–10 min) using a two-way ANOVA (∗∗∗p < 0.0001 compared to no-UTR control). For representative purposes, the mean fluorescence recovery at 10 min post-photobleaching is shown. Error bars represent SEM. See also Figure S7.
Figure S1
Figure S1
Specific Labeling of Retinal Axons in Retinal RiboTag, Related to Figure 1 (A) Two Cre activity reporter mice were used in this study. The LacZ reporter labels the cell bodies of Cre-positive cells and their progeny, whereas the TauLacZ reporter labels both the cell bodies and axons. (B) X-gal staining of the retina, optic chiasm (OC) and superior colliculus (SC) in alpha-Cre; LacZ reporter gene double positive mice. Cre labels most peripheral neural retinal cells in both mice. No cells in the SC used for TRAP in this study express Cre as evidenced by the lack of X-gal stain in the LacZ reporter SC. Unlike the alpha-Cre; LacZ mice, alpha-Cre; TauLacZ mice show robust staining not only in the cell bodies but also the OC and the SC. The SC, which was used for axon-TRAP, is highly innervated by retinal axons.
Figure S2
Figure S2
Axon-TRAP, Related to Figure 2 (A) Bioanalyzer analysis of axon-TRAPed mRNA. Lower tables show the amounts of total RNAs and amplified cDNAs for each TRAPed sample. (B) Silver staining of axon-TRAPed protein complexes following SDS-PAGE. (C) Strategy for cDNA synthesis and amplification adapted from the study by Tang et al. (D) Ribosome run-off experiment. The amplified cDNAs from TRAPed mRNAs with or without run-off (P0.5 retina). (E) Retinal and axon-TRAP combined with ribosome run-off. (F) Scatterplots of log2 (FPKM) between Cre-positive (x axis) and Cre-negative axons (y axis).
Figure S3
Figure S3
Comparison between the Axonal and the Retinal Translatome, Related to Figure 3 (A) The upper panel shows a heat map of hierarchical clustering on the normalized level of axonal and retinal translation of genes. Each row in the heat map corresponds to a single gene. The color of the heat map represents the log2 (FPKM value) for each gene (gray = not detected). The lower panel shows a heat map of a correlation matrix. (B) Tables showing the ranking of most significantly enriched GO terms in axon-enriched mRNAs and retina-enriched mRNAs. Terms presented in Figure 3B are shown in red. (C) A heat map showing the enrichment of GO terms in the biological process (BP) category. The colors of the heat map represents the log2 value of the fold enrichment for each GO term value (red = enriched, blue = depleted, gray = not detected), and the numbers on the heat map are –log 10 (Fisher’s exact p value) for enrichment.
Figure S4
Figure S4
Gene Set Enrichment Analysis Describing the Developmental Changes of Translated Genes in RGC Axons, Related to Figure 4 (A) The upper heat map displays the enrichment of GO terms or KEGG pathways for axonally translated genes. Each row in the heat map corresponds to a single GO term. Genes are clustered either by stage-specific expression (“stages”) or hierarchical clustering (lower heat map) according to their developmental changes (“changes”). (B) Ingenuity pathway analysis (IPA) to identify canonical pathways associated with the axonal translatome. Each row represents a single pathway (blue, enriched). The right panel shows lists of pathways extracted from each cluster. (C) A heatmap showing the log2 (read count) for adult samples with and without ribosome run-off. Each row in the heat map corresponds to a single gene.
Figure S5
Figure S5
Analysis of trans-Acting Elements that Regulate the Axonal Translatome, Related to Figure 5 (A) Ingenuity pathway analysis (IPA) to identify upstream regulators associated with the axonal translatome. The abundance of each mRNA between two consecutive stages was represented as the ratio (ratio > 1 indicates increase in translation). The coordinate change in the translation ratios was calculated as the activation z-score. A positive z-score indicates that the translational regulator is expected to be activated. (B) Bar graph representing the fold change in levels of axonally translated genes. The mRNA levels in the axonal translatome were quantified by qRT-PCR (normalized by TRAPed cDNA for each stage). (C) Density plots showing the distribution of changes in FPKM values for the axonal translatome during two consecutive developmental stages with p values (Komogorov-Smirnov test). The values are calculated as follows: log2 (stage A(FPKM)/stage B (FPKM)). The distributions of target genes in pathways, which are indicated by colored lines, are overlapped with non-target genes represented by gray lines. (D) A scatter plot of the Principal Component Analysis (PCA) based on normalized read counts in the axonal and retinal translatome from four different stages. Data were plotted using the first two Principal Components (PCs), which explained up to 73.2% of the total variance. (E) Relationship between transcript abundance of the genes in E17.5 transcriptome, which were detected in E17.5 axonal translatome, and probability of their translation at later stages (blue line, mRNA level in transcriptome; red line, moving averages of percentage of genes detected at any of three later stages over a window size of 100 genes; r, Pearson correlation coefficient). The right heatmap shows mRNA abundance in the translatome (left) and enriched pathways (right).
Figure S6
Figure S6
Analysis for Alternative Isoforms and cis-Acting Elements, Related to Figure 6 (A) Sequence reads (gray bars) mapped on the Clta gene. The mapped reads are visualized with Integrative Genomics Viewer (IGV). (B) Sequence reads (gray bars) mapped on the Rhobtb3 (upper panel). Sanger sequencing of RT-PCR fragment of the Ankrd12 mRNA (lower panel).
Figure S7
Figure S7
Cis-Regulatory Elements for Axonal Translation, Related to Figure 7 (A) Lists of sequence motifs enriched in 5′UTRs, 3′UTRs and alternative exons of axon-enriched mRNAs / exons. (B) An example of axon-enriched motifs. The scatterplot compares the normalized mRNA levels (log2(FPKM)) between the axonal (y axis) and the retinal (x axis) translatome at stage P0.5 for genes with (red dots) and without (black dots) the motif. The density plot shows the distribution of log2 (axon (FPKM) / retina (FPKM)). (C) GO enrichment analysis for entire genome containing axon-specific sequence motifs (K: G or T; R: A or G; Y: C or T; M: A or C; R: A or G; and H A or C or T) and their relative efficiency in axonal mRNA translation measured by fluorescence recovery after photobleaching (FRAP) of motif-containing reporter constructs (myr-d2EGFP). Several axon-specific motifs were able to promote mRNA translation in the growth cone relative to a control myr-d2EGFP construct without a UTR. Statistical significance of FRAP compared to the no-UTR control was tested across all time-points (0-10mins) using a two-way ANOVA (from the top bar, n = 16, 5, 5, 7, 8, 7, 3, 8, 8, 8, 5, 8, and 6, respectively). For representative purposes, the mean fluorescence recovery at 10 min post-photobleaching is shown. Error bars represent SEM. ∗∗p < 0.01, and ∗∗∗p < 0.001 compared to no-UTR control.

References

    1. Aakalu G., Smith W.B., Nguyen N., Jiang C., Schuman E.M. Dynamic visualization of local protein synthesis in hippocampal neurons. Neuron. 2001;30:489–502. - PubMed
    1. Alami N.H., Smith R.B., Carrasco M.A., Williams L.A., Winborn C.S., Han S.S., Kiskinis E., Winborn B., Freibaum B.D., Kanagaraj A. Axonal transport of TDP-43 mRNA granules is impaired by ALS-causing mutations. Neuron. 2014;81:536–543. - PMC - PubMed
    1. Andreassi C., Zimmermann C., Mitter R., Fusco S., De Vita S., Saiardi A., Riccio A. An NGF-responsive element targets myo-inositol monophosphatase-1 mRNA to sympathetic neuron axons. Nat. Neurosci. 2010;13:291–301. - PubMed
    1. Bagni C., Greenough W.T. From mRNP trafficking to spine dysmorphogenesis: the roots of fragile X syndrome. Nat. Rev. Neurosci. 2005;6:376–387. - PubMed
    1. Baleriola J., Walker C.A., Jean Y.Y., Crary J.F., Troy C.M., Nagy P.L., Hengst U. Axonally synthesized ATF4 transmits a neurodegenerative signal across brain regions. Cell. 2014;158:1159–1172. - PMC - PubMed

Publication types