. 2016 Aug;186(8):1989-2007.
doi: 10.1016/j.ajpath.2016.03.017. Epub 2016 Jun 17.

Cardiomyocyte-Specific Human Bcl2-Associated Anthanogene 3 P209L Expression Induces Mitochondrial Fragmentation, Bcl2-Associated Anthanogene 3 Haploinsufficiency, and Activates p38 Signaling

Affiliations

Cardiomyocyte-Specific Human Bcl2-Associated Anthanogene 3 P209L Expression Induces Mitochondrial Fragmentation, Bcl2-Associated Anthanogene 3 Haploinsufficiency, and Activates p38 Signaling

Megan T Quintana et al. Am J Pathol. 2016 Aug.

Abstract

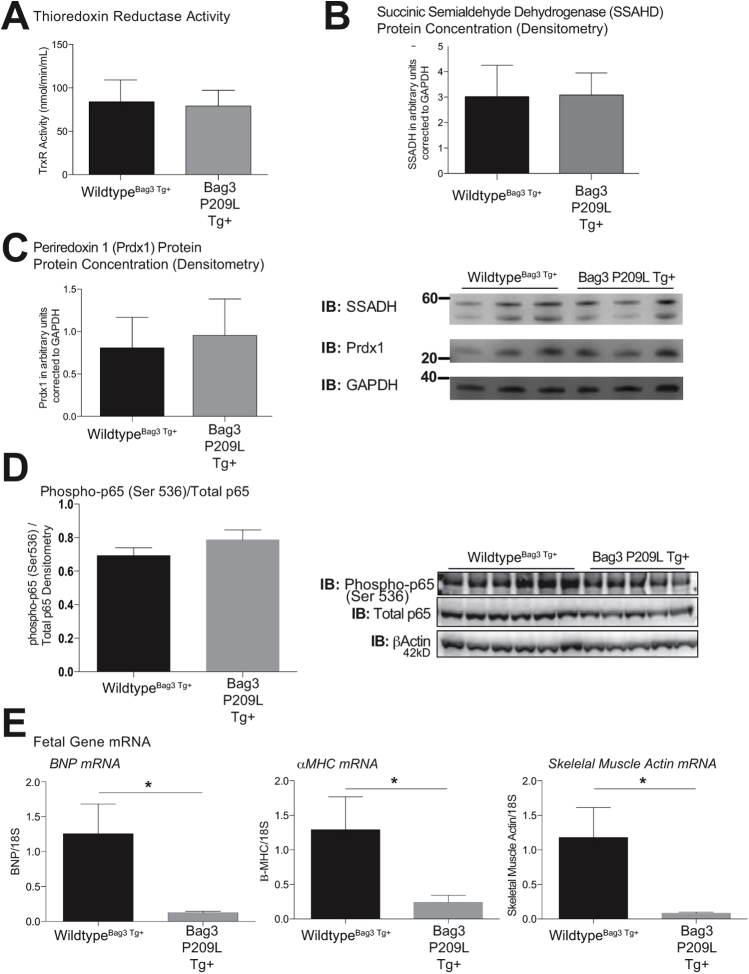
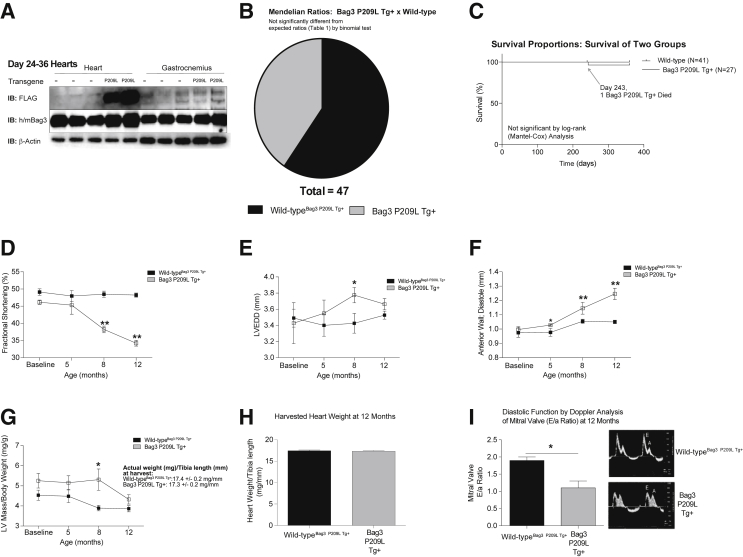
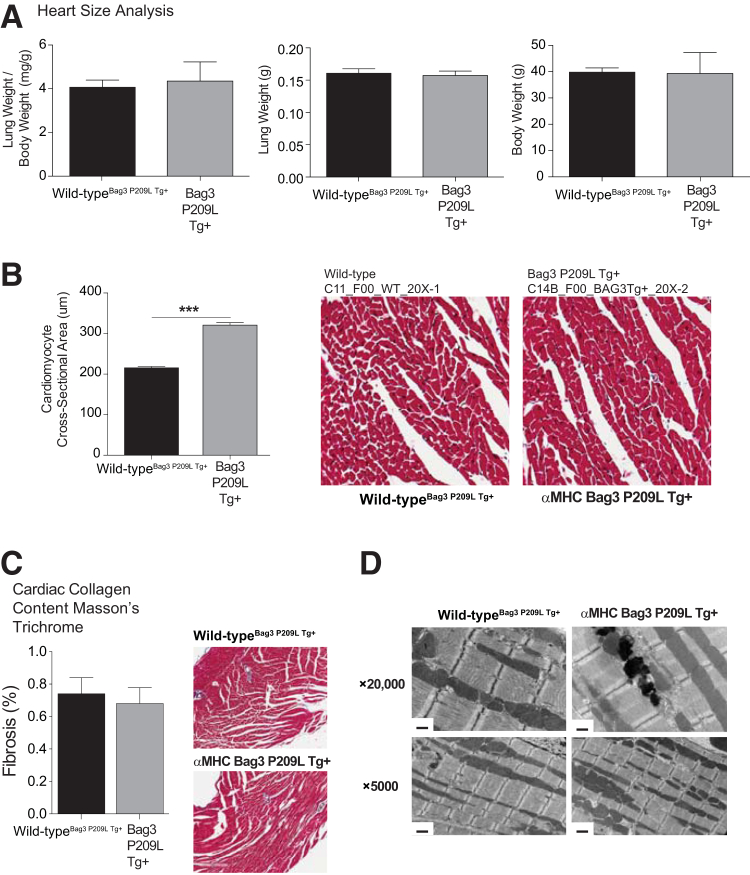
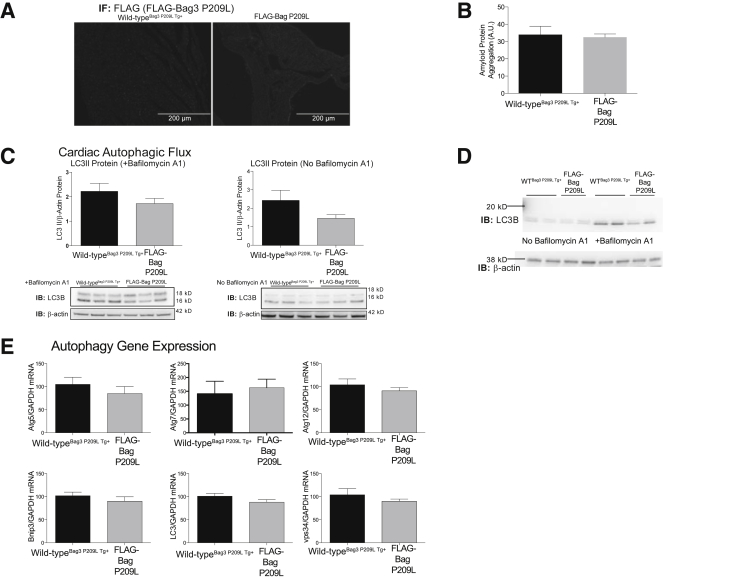
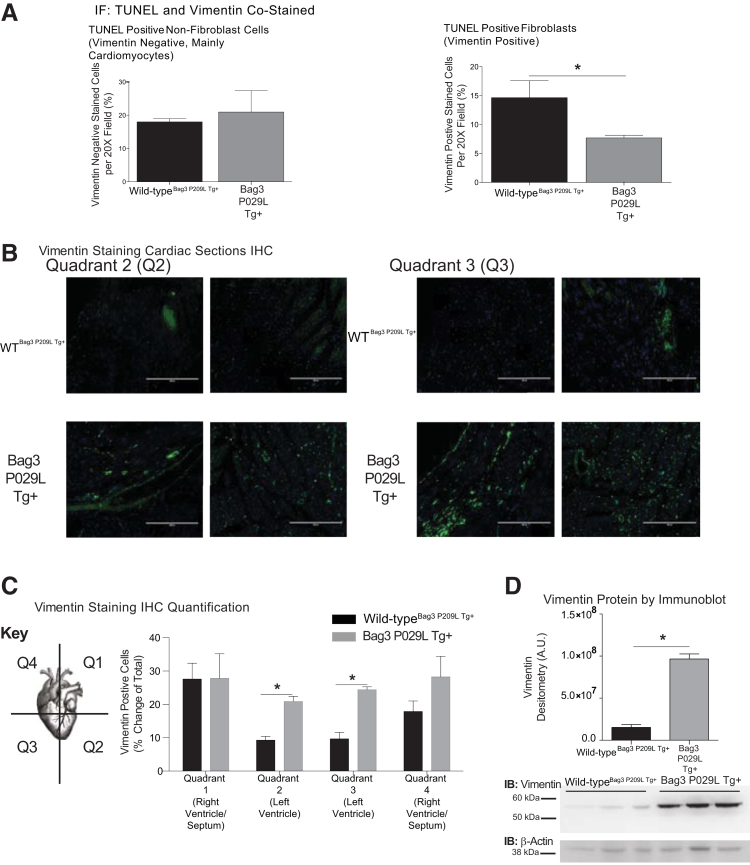
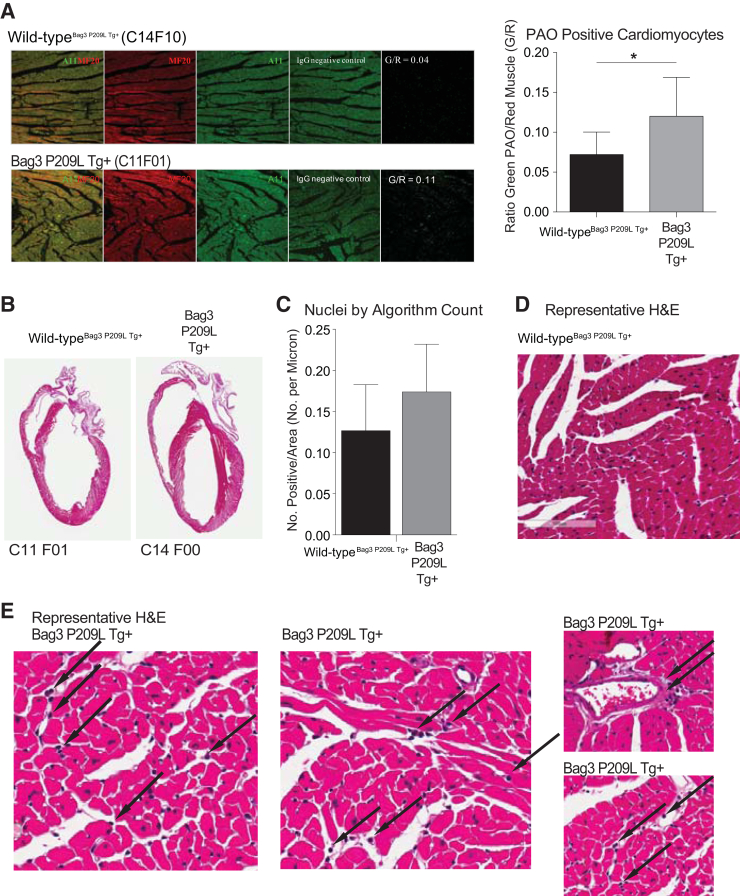
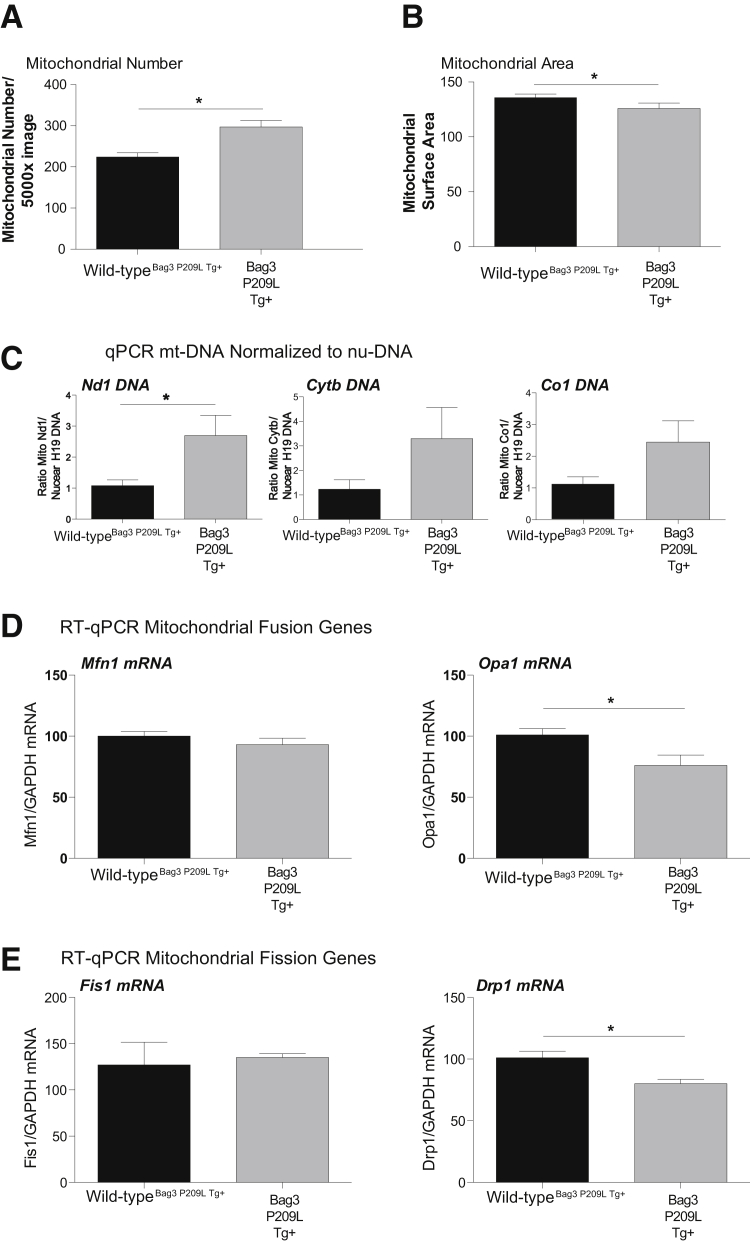
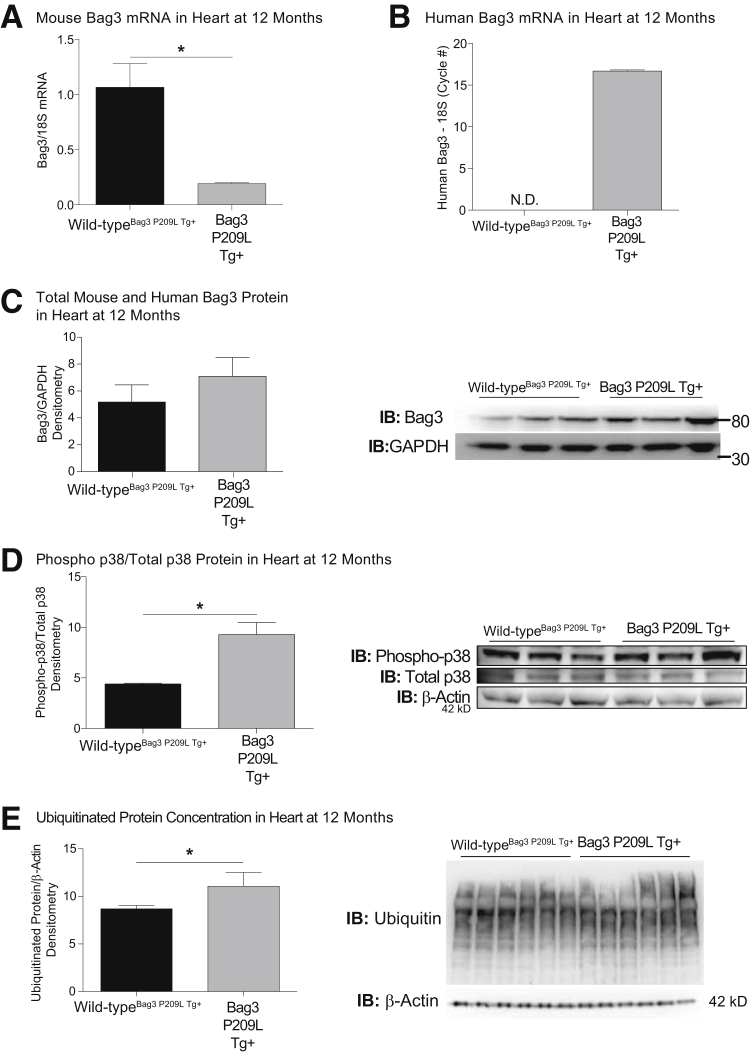
The Bcl2-associated anthanogene (BAG) 3 protein is a member of the BAG family of cochaperones, which supports multiple critical cellular processes, including critical structural roles supporting desmin and interactions with heat shock proteins and ubiquitin ligases intimately involved in protein quality control. The missense mutation P209L in exon 3 results in a primarily cardiac phenotype leading to skeletal muscle and cardiac complications. At least 10 other Bag3 mutations have been reported, nine resulting in a dilated cardiomyopathy for which no specific therapy is available. We generated αMHC-human Bag3 P209L transgenic mice and characterized the progressive cardiac phenotype in vivo to investigate its utility in modeling human disease, understand the underlying molecular mechanisms, and identify potential therapeutic targets. We identified a progressive heart failure by echocardiography and Doppler analysis and the presence of pre-amyloid oligomers at 1 year. Paralleling the pathogenesis of neurodegenerative diseases (eg, Parkinson disease), pre-amyloid oligomers-associated alterations in cardiac mitochondrial dynamics, haploinsufficiency of wild-type BAG3, and activation of p38 signaling were identified. Unexpectedly, increased numbers of activated cardiac fibroblasts were identified in Bag3 P209L Tg+ hearts without increased fibrosis. Together, these findings point to a previously undescribed therapeutic target that may have application to mutation-induced myofibrillar myopathies as well as other common causes of heart failure that commonly harbor misfolded proteins.


Figures

Supplemental Figure S1
Experimental design and analysis of mendelian ratios of αMHC-Bag3 P209L transgenic offspring. Experimental design of studies. Mendelian ratios of offspring further analyzed by sex at the time of genotyping at 14 to 21 days post-partum with χ2 analysis. N = 47 total, with 9 to 16 per group as illustrated.
Supplemental Figure S2
Quantification of Bag3 P209L apoptosis-inducing factor (AIF) expression by immunofluorescence. Representative confocal immunofluorescence images of AIF positive cells in histological cardiac cross sections of αMHC-Bag3 P209L and littermate wild-type mice at 12 months of age. N = 3 biological controls per group. Scale bar = 400 μm. AIF, apoptosis-inducing factor; IF, immunofluorescence.
Supplemental Figure S3
Immunofluorescence analysis of left ventricular fibroblasts in quadrant 1 (Q1) and quadrant 4 (Q4). Representative confocal immunofluorescence images of cardiac fibroblasts from histological sections of αMHC-Bag3 P209L and littermate wild-type mice at 12 months of age. A: Quadrant 1, B: Quadrant 4. Two representative biological replicates shown for each group. Scale bar = 200 μm (A and B).
Supplemental Figure S4
Higher-order enrichment analysis of metabolites is significantly altered in αMHC-Bag3 P209L transgenic hearts at 12 months. Enrichment analysis of t-test/variable importance in projection (VIP) significant metabolites by pathway (A), disease association (B), and subcellular location (C) using Metaboanalyst data sets.
Supplemental Figure S5
Analysis of thioredoxin reductase activity, NF-κB, and fetal gene expression in Bag3 P209L Tg+ hearts. A: Thioredoxin reductase activity of ventricular tissue from αMHC-BAG3 P209L and littermate wild-type mice at 12 months of age. Western blot analysis of the thioredoxin enzymes succinic semialdehyde dehydrogenase (SSAHD) (B) and periredoxin 1 (Prdx1) (C). D: Immunoblot analysis of activated NF-κB subunit p65 (phospho-p65 subunit) normalized to total p65. E: Quantitative RT-PCR analysis of BNP, αMHC, and skeletal muscle actin mRNA in Bag3 P209L Tg+ hearts. A t-test was used to compare genotypes at each time point. Data are expressed as means ± SEM. N = 5 mice per group (A, Bag3 P209L Tg+ and wildtypeBag3 P209L Tg+, and D, wild-typeBag3 P209L Tg+); N = 3 per group (B, C, and E, Bag3 P209L Tg+ and B and C, wild-typeBag3 P209L Tg+); N = 6 (D, Bag3 P209L Tg+ and E, wild-typeBag3 P209L Tg+). P < 0.05 versus age-matched sibling wild-type mice. GAPDH, glyceraldehyde-3-phosphate dehydrogenase; IB, immunoblot.
Figure 1
Figure 1
Cardiac function and natural history of αMHC-Bag3 P209L transgenic mouse cardiac phenotype up to 12 months of age. A: Western blot analysis of Bag3 P209L expression by anti-FLAG (FLAG-Bag3 P209L) demonstrating specificity and by anti-BAG3 (human and mouse) to compare relative levels of total BAG3 in cardiac and gastrocnemius tissue from αMHC-Bag3 P209L and littermate wild-type mice. B: Mendelian ratios of offspring at the time of genotyping at 14 to 21 days post-partum. C: Kaplan-Meier survival curves of Bag3 P209L Tg+ and sibling wild-type mice. D–G: Temporal changes in fractional shortening %, calculated as (LVEDD-LVESD)/LVEDD × 100, see Table 2 (D), left ventricular end diameter; diameter (E), anterior wall thickness in diastole (AWTD) (F), and left ventricular mass (G), corresponding to the complementary morphometrics in Table 2. H: Measured total heart weight (normalized to tibia length) at 1 year of age. I: Analysis of diastolic function made from Doppler measures of mitral valve at 1 year of age. A t-test was used to compare genotypes at each time point. Data are expressed as means ± SEM (D–I). N = 47 (B); N = 68 (C); N = 3 (D–G, baseline Bag3 P209LTg+ and 5 months Bag3 P209LTg+); N = 4 (D–G, 8 months Bag3 P209LTg+); N = 5 (D–G, baseline wild-typeBag3 P209L Tg+ and 5 months wild-typeBag3 P209L Tg+); N = 7 (D–G, 8 months wild-typeBag3 P209L Tg+); N = 10 (D–G,12 months wild-typeBag3 P209L Tg+ and BAG3 P209LTg+); N = 4 (H, Bag3 P209LTg+); N = 7 (H, wild-typeBag3 P209L Tg+); N = 3 per group (I). P < 0.05, ∗∗P < 0.005 versus age-matched sibling wild-type mice. IB, immunoblot; LV, left ventricle; LVEDD, left ventricular end-diastolic diameter.
Figure 2
Figure 2
Morphometric analysis of αMHC-Bag3 P209L transgenic hearts. A: Heart weight and lung weights at 12 months of age. B: Cross-sectional analysis of cardiomyocytes from Masson's trichrome–stained histological sections. C: Analysis of collagen in αMHC-Bag3 P209L and littermate wild-type hearts by nonbias computer logarithm analysis of collagen as a measure of fibrosis (N = 6 wild-typeBag3 P209L Tg+, N = 4 Bag3 P209L Tg+). D: Transmission electron microscopy analysis of αMHC-Bag3 P209L and littermate wild-type mice at ×5 and ×20,000 (N = 3/group). A t-test was used to compare genotypes at each time point. Measurements represent means ± SEM (AC). N = 3 per group (AC). ∗∗∗P < 0.001. Scale bars: 0.5 μm (D, top row); 1 μm (D, bottom row). Original magnification: ×20 (B); ×10 (C).
Figure 3
Figure 3
Analysis of protein aggregate and autophagic flux in αMHC-Bag3 P209L transgenic hearts at 12 months. A: Immunofluorescence detection of FLAG-Bag3 P209L in transgenic, but not wild-type, hearts. B: Colorimetric staining of protein aggregation. C: Western blot analysis of cardiac autophagic flux from αMHC-Bag3 P209L and littermate wild-type mice at 12 months of age. D: Western blot analysis demonstrating that bafilomycin induction is adequate. E: Real-time quantitative RT-PCR analysis of Atg5, Atg7, Atg12, Bnip3, LC3, and Vps34, mediating autophagy. A t-test was used to compare genotypes at each time point. Measurements represent means ± SEM (B, C, and E). N = 6 per group (B and E); N = 3 per group (C). IB, immunoblot; IF, immunofluorescence.
Figure 4
Figure 4
αMHC-Bag3 P209L transgenic hearts have increased left ventrical (LV) fibroblast areas in a perivenular distribution and decreased fibroblast apoptosis. A: Costaining of TUNEL positive nonfibroblast (left) and fibroblast (vimentin positive) cells by immunohistochemistry. B: Representative confocal immunofluorescence images of cardiac fibroblasts from histological sections of αMHC-Bag3 P209L and littermate wild-type mice at 12 months of age. Shown are quadrant 2 and quadrant 3, tracking with the LV (quadrant 1 and quadrant 1 primarily right ventricle). C: Nonbias quantitative logarithmic analysis of vimentin (+) cell staining in quadrants 1 to 4. D: Western immunoblot analysis of cardiac vimentin in Bag3 P209L hearts compared to wild-type hearts at 12 months of age. A t-test was used to compare genotypes at each time point. Measurements represent means ± SEM (A). N = 12 (A, wild-typeBag3 P209L Tg+); N = 6 (A, Bag3 P209L Tg+ cardiac sections). P < 0.05 versus age-matched sibling wild-type mice. Scale bars = 200 μm (B). IHC, immunohistochemistry; TUNEL, terminal deoxynucleotidyl transferase-mediated dUTP nick-end labelling. AU, arbitrary units; IB, immunoblot; IF, immunofluorescence.
Figure 5
Figure 5
Analysis nuclei in αMHC-Bag3 P209L transgenic hearts at 12 months. A: Immunohistochemistry analysis of preamyloid oligomers (PAO; anti-A11 antibody), cardiomyocytes (anti-MF20 antibody), and IgG controls showing representative green (PAO) as a percentage of red (cardiomyocytes) in cardiac sections. B: Gross comparison of αMHC-Bag3 P209L and littermate wild-type mice [hematoxylin and eosin (H&E) stained). C: Algorithmic analysis of nuclei quantitated per area of cross-sectional area. D: Representative Bag3 P209L Tg+ hearts and age-matched sibling wild-type hearts with cellular infiltrates. Representative histological section of wild-typeBag3 P209L Tg+ heart stained with H&E (D) and parallel representative cross sections of sibling Bag3 P209L Tg+ hearts with inflammatory cell infiltrates (arrows) at 12 months of age (E). A t-test was used to compare genotypes at each time point. N = 3 Bag3 P209L Tg+ (A); N = 4 Bag3 P209L Tg+ biological replicates, 3 cross-sectional areas each (A and B); N = 5 wild-typeBag3 P209L Tg+ (A); N = 3 wild-typeBag3 P209L Tg+ (C). P < 0.05 versus age-matched sibling wild-type mice. Original magnification: ×20 (A, D, and E); ×0.7 (B).
Figure 6
Figure 6
αMHC-Bag3 P209L transgenic hearts exhibit alterations in mitochondria number and dynamics. Quantitative analysis of mitochondrial number (A) and mitochondrial area (B) in ×5000 TEM sections. C: Quantitative analysis of the mean cytochrome c oxidase subunit 1 (CO1, aka mt-CO1)/cytochrome b (Cyt-b, aka mt-Cyb)/NADH dehydrogenase 1 (ND1, aka mt-nd1) normalized to nuclear H19 (imprinted maternally expressed transcript, non-protein coding) of αMHC-Bag3 P209L and littermate wild-type mice at 12 months of age. Real-time quantitative RT-PCR (RT-qPCR) analysis of genes regulating mitochondrial fusion (mitofusin 1/Mfn1 and optic atrophy1/opa1) (D) and mitochondrial fission (mitochondrial fission 1 protein/Fis1 and dynamic-related protein 1/Drp1) (E). A t-test was used to compare genotypes at each time point. Data are expressed as means ± SEM. N = 4 (A and B, Bag3 P209L Tg+); N = 5 per group (C); N = 6 per group (A and B, wild-typeBag3 P209L Tg+, and D and E). P < 0.05 versus age-matched sibling wild-type mice. nu-DNA, nuclear DNA; qPCR, real-time quantitative PCR.
Figure 7
Figure 7
Nontargeted metabolomics analysis of αMHC-Bag3 P209L transgenic hearts at 12 months of age. A: Heat map representation of metabolites identified in αMHC-Bag3 P209L and littermate wild-type hearts at 12 months of age. B: Principal components (PC) analysis of αMHC-Bag3 P209L and littermate wild-type hearts. C:t-Test analysis of metabolites, including significant metabolites (above horizontal line), listed below with P-value and false discovery rate (FDR) estimate. D: Partial least squares discriminant analysis (PLS-DA) score plot demonstrating significant separation between groups. E: The variable influence on the projection (VIP) parameter to select variables that have the most significant contribution in discriminating between metabolomics profiles in a PLS-DA model. Statistical analyses were performed as described in Materials and Methods. Double asterisks denote fold-change inaccurate because of imputing a non-zero value resulting from the metabolite not being detected in one group. N = 3 biological replicates per group (A–E). WT, wild-type.
Figure 8
Figure 8
αMHC-Bag3 P209L down-regulates wild-type BAG3 and activates P38 at 12 months of age. Cardiac expression of endogenous mouse Bag3 (A) and human Bag3 (B) mRNA expression analysis by real-time quantitative RT-PCR. Western blot analysis of total (mouse and human) Bag3 protein (C), phospho-p38/p38 (D), and ubiquitinated proteins from αMHC-BAG3 P209L and littermate wild-type mice (E) at 12 months of age. A t-test was used to compare genotypes at each time point. Measurements represent means ± SEM (A–E). N = 4 (A, wild-typeBag3 P209L Tg+); N = 5 (A and B, Bag3 P209L Tg+); N = 3 per group (C and D); N = 6 per group (B, wild-typeBag3 P209L Tg+, and E). P < 0.05 versus age-matched sibling wild-type mice. IB, immunoblot; ND, not detected.

Similar articles

Cited by

References

    1. Rosati A., Graziano V., De Laurenzi V., Pascale M., Turco M.C. BAG3: a multifaceted protein that regulates major cell pathways. Cell Death Dis. 2011;2:e141. - PMC - PubMed
    1. Hishiya A., Kitazawa T., Takayama S. BAG3 and Hsc70 interact with actin capping protein CapZ to maintain myofibrillar integrity under mechanical stress. Circ Res. 2010;107:1220–1231. - PMC - PubMed
    1. Sanoudou D., Corbett M.A., Han M., Ghoddusi M., Nguyen M.A., Vlahovich N., Hardeman E.C., Beggs A.H. Skeletal muscle repair in a mouse model of nemaline myopathy. Hum Mol Genet. 2006;15:2603–2612. - PMC - PubMed
    1. Warren G.L., Summan M., Gao X., Chapman R., Hulderman T., Simeonova P.P. Mechanisms of skeletal muscle injury and repair revealed by gene expression studies in mouse models. J Physiol. 2007;582:825–841. - PMC - PubMed
    1. Olive M., Kley R.A., Goldfarb L.G. Myofibrillar myopathies: new developments. Curr Opin Neurol. 2013;26:527–535. - PMC - PubMed

Publication types

MeSH terms

Substances