. 2016 Jun 20:6:27864.
doi: 10.1038/srep27864.

Effect of Cocaine on HIV Infection and Inflammasome Gene Expression Profile in HIV Infected Macrophages

Affiliations

Effect of Cocaine on HIV Infection and Inflammasome Gene Expression Profile in HIV Infected Macrophages

Venkata Subba Rao Atluri et al. Sci Rep. .

Abstract

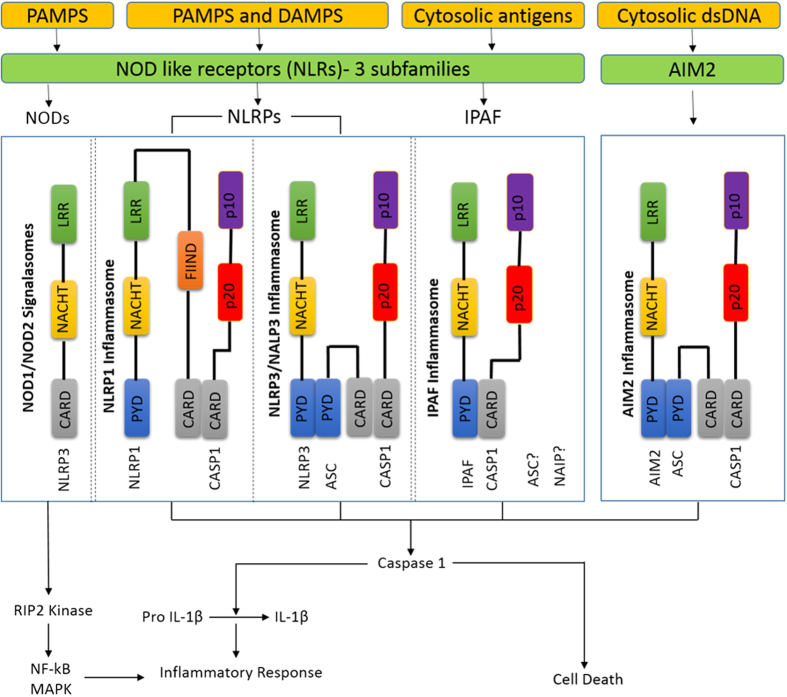
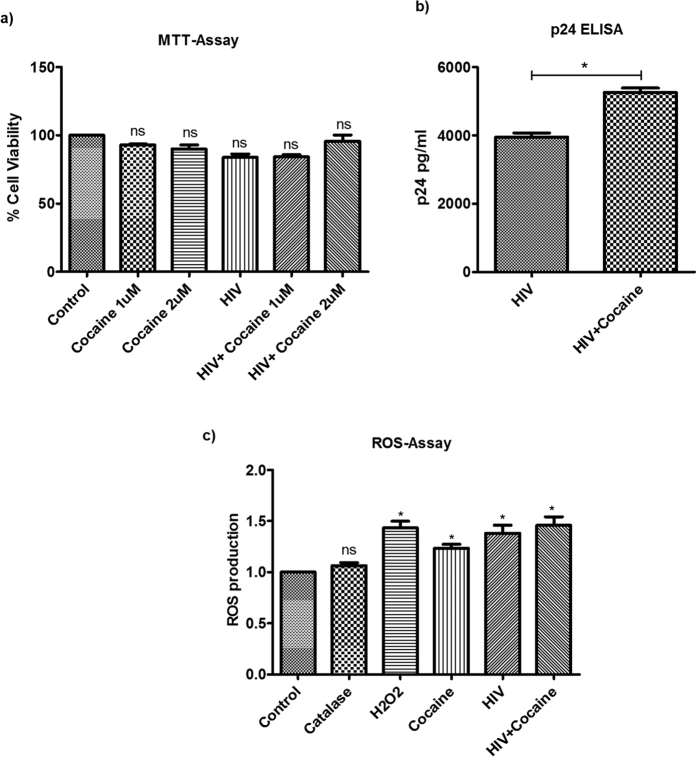
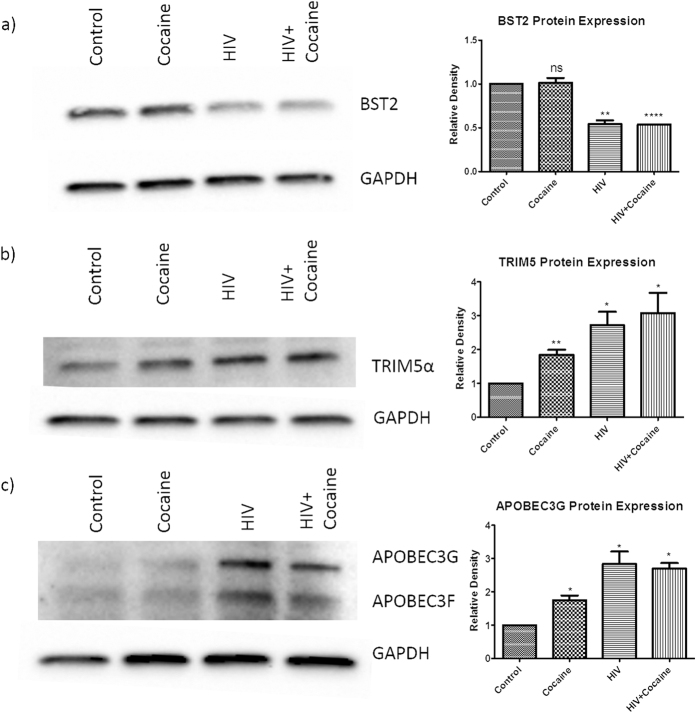
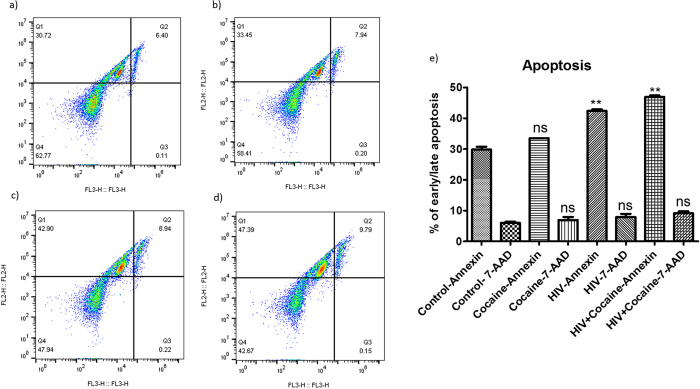
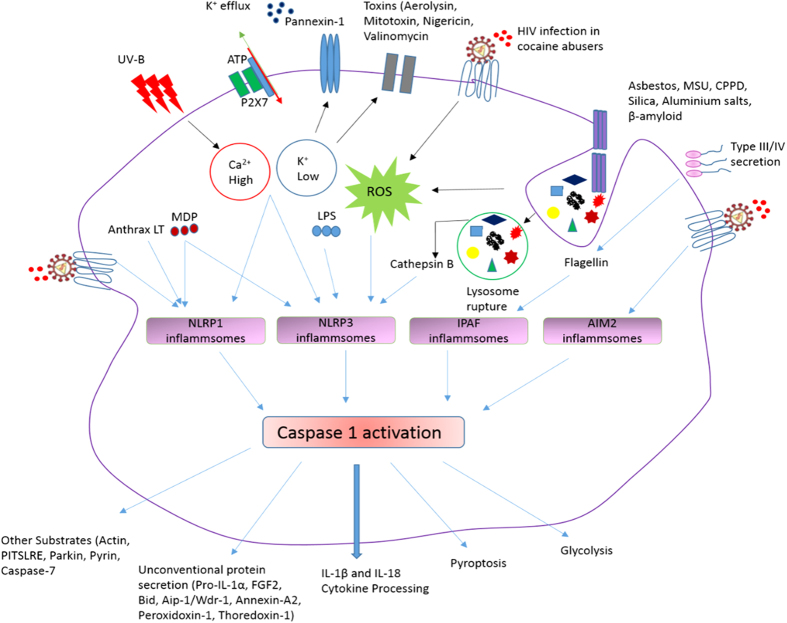
We have observed significantly increased HIV infection in HIV infected macrophages in the presence of cocaine that could be due to the downregulation of BST2 restriction factor in these cells. In human inflammasome PCR array, among different involved in inflammasome formation, in HIV infected macrophages in the presence of cocaine, we have observed significant upregulation of NLRP3, AIM2 genes and downstream genes IL-1β and PTGS2. Whereas negative regulatory gene MEFV was upregulated, CD40LG and PYDC1 were significantly downregulated. Among various NOD like receptors, NOD2 was significantly upregulated in both HIV alone and HIV plus cocaine treated cells. In the downstream genes, chemokine (C-C motif) ligand 2 (CCL2), CCL7 and IL-6 were significantly up regulated in HIV plus cocaine treated macrophages. We have also observed significant ROS production (in HIV and/or cocaine treated cells) which is one of the indirect-activators of inflammasomes formation. Further, we have observed early apoptosis in HIV alone and HIV plus cocaine treated macrophages which may be resultant of inflammasome formation and cspase-1 activation. These results indicate that in case of HIV infected macrophages exposed to cocaine, increased ROS production and IL-1β transcription serve as an activators for the formation of NLRP3 and AIM2 mediated inflammasomes that leads to caspase 1 mediated apoptosis.


Figures

Figure 1
Figure 1. Danger signals or bacterial compounds as activators of inflammasomes and NODs.
Schematic representation is showing different types and the components of inflammasomes and NOD like receptors. Courtesy of AdipoGen Life Sciences (www.adipogen.com).
Figure 2
Figure 2
(a) MTT Assay. Monocyte derived macrophages were infected with HIV and/or treated with cocaine for 10 days and the cell viability was measured using the MTT assay. We have found no significant cytotoxicity in the macrophages at the concentration of cocaine or HIV used in the study. (NS-Not Significant). (b) Increased HIV infectivity of MDMs in the presence of cocaine. Monocyte derived macrophages were infected with HIV in the presence/absence of cocaine for 10 days and the HIV infectivity was measured by measuring the p24 antigen production in the culture supernatant using the p24 antigen ELISA Kit. We have found significantly increased HIV infectivity in macrophages exposed to cocaine than the HIV infected cells alone. (*p ≤ 0.05). (c) ROS Assay. Monocyte derived macrophages were infected with HIV and/or treated with cocaine for 10 days and oxidative stress was analyzed by ROS assay. We have found significant ROS production in cocaine alone treated, HIV only infected and HIV plus cocaine treated macrophages. (*p ≤ 0.05; NS-Not Significant).
Figure 3
Figure 3. Expression of HIV restriction factors in HIV infected MDMs in the presence of cocaine.
Monocyte derived macrophages were infected with HIV and/or treated with cocaine for 10 days and the protein expression of different HIV restriction factors (BST2, TRIM5α and APOBEC3G) was analyzed by western blot assay. We have found significant downregulation of BST2 restriction factor in cocaine alone treated, HIV only infected and HIV plus cocaine treated macrophages (a). We have also observed significant upregulation of TRIM5α (b) and APOBEC3G (c) protein expression in cocaine alone treated, HIV only infected and HIV plus cocaine treated macrophages. Figure 3 is the representative figure of three independent biological experiments. Relative density of the detected protein band was measured by using the Image J software and the values obtained were averaged. (*p ≤ 0.05; **p ≤ 0.01; ***p ≤ 0.001; NS-Not Significant).
Figure 4
Figure 4. Apoptosis in HIV infected macrophages grown in the presence/absence of cocaine.
Monocyte derived macrophages were infected with HIV in the presence/absence of cocaine for 10 days and apoptosis was measured by using FITC Annexin V Apoptosis Detection Kit I and the results were analyzed by Flow-cytometer. We have observed significant early apoptosis in HIV only infected macrophages (c) as well as in HIV infected macrophages grown in the presence of cocaine (d) when compared to the control cells (a). We did not see significant apoptosis in cocaine only exposed cells (b) when compared to the control cells. Although there is an increase but there is no statistically significantly increased early apoptosis in HIV infected cells grown in the presence of cocaine (d) in comparison with the HIV alone infected cells (c). No significant late apoptosis was observed in any of the test group cells when compared to the control cells (e). Figure 4 is the representative figure of three independent biological experiments and the values obtained were averaged. (**p ≤ 0.01; NS-Not Significant).
Figure 5
Figure 5. Inflammasome signaling cascade.
This schematic representation is showing the cascade of different types of activators and inflammasome complexes and their mechanism of action in inducing inflammatory response and cell death. This figure shows that HIV infection and/or cocaine exposure induce the expression of NLRP1, NLRP3 (by ROS production), and AIM2 inflammasome genes which further activates the production of pro-inflammatory cytokines leading to the apoptosis of the infected cells and/or surrounding cell population. This figure also shows other activators of NLRP1 (K+ efflux, Ca2+ influx), NLRP3 (K+ efflux, cathepsin B, ROS production), IPAF (flagellin from certain gram negative bacteria), AIM2 (cytosolic bacterial, viral and host dsDNA). Courtesy of AdipoGen Life Sciences (www.adipogen.com).

References

    1. Wu D. T. et al. Berman. Mechanisms of leukocyte trafficking into the CNS. Journal of NeuroVirology 6 (Suppl. 1), S82–S85 (2000). - PubMed
    1. Nath A., Conant K., Chen P., Scott C. & Major E. O. Transient exposure to HIV-1 Tat protein results in cytokine production in macrophages and astrocytes. A hit and run phenomenon. J Biol Chem 274, 17098–17102, 10.1074/jbc.274.24.17098 (1999). - DOI - PubMed
    1. Gannon P., Khan M. Z. & Kolson D. L. Current understanding of HIV-associated neurocognitive disorders pathogenesis. Curr Opin Neurol 24, 275–283, 10.1097/WCO.0b013e32834695fb (2011). - DOI - PMC - PubMed
    1. Buch S. et al. Cocaine and HIV-1 interplay in CNS: cellular and molecular mechanisms. Curr HIV Res 10, 425–428, 10.2174/157016212802138823 (2012). - DOI - PMC - PubMed
    1. Kawai T. & Akira S. TLR signaling. Seminars in immunology 19, 24–32, 10.1016/j.smim.2006.12.004 (2007). - DOI - PubMed

Publication types

MeSH terms