

Trans-ethnic Meta-analysis and Functional Annotation Illuminates the Genetic Architecture of Fasting Glucose and Insulin
- PMID: 27321945
- PMCID: PMC5005440
- DOI: 10.1016/j.ajhg.2016.05.006
Trans-ethnic Meta-analysis and Functional Annotation Illuminates the Genetic Architecture of Fasting Glucose and Insulin
Abstract
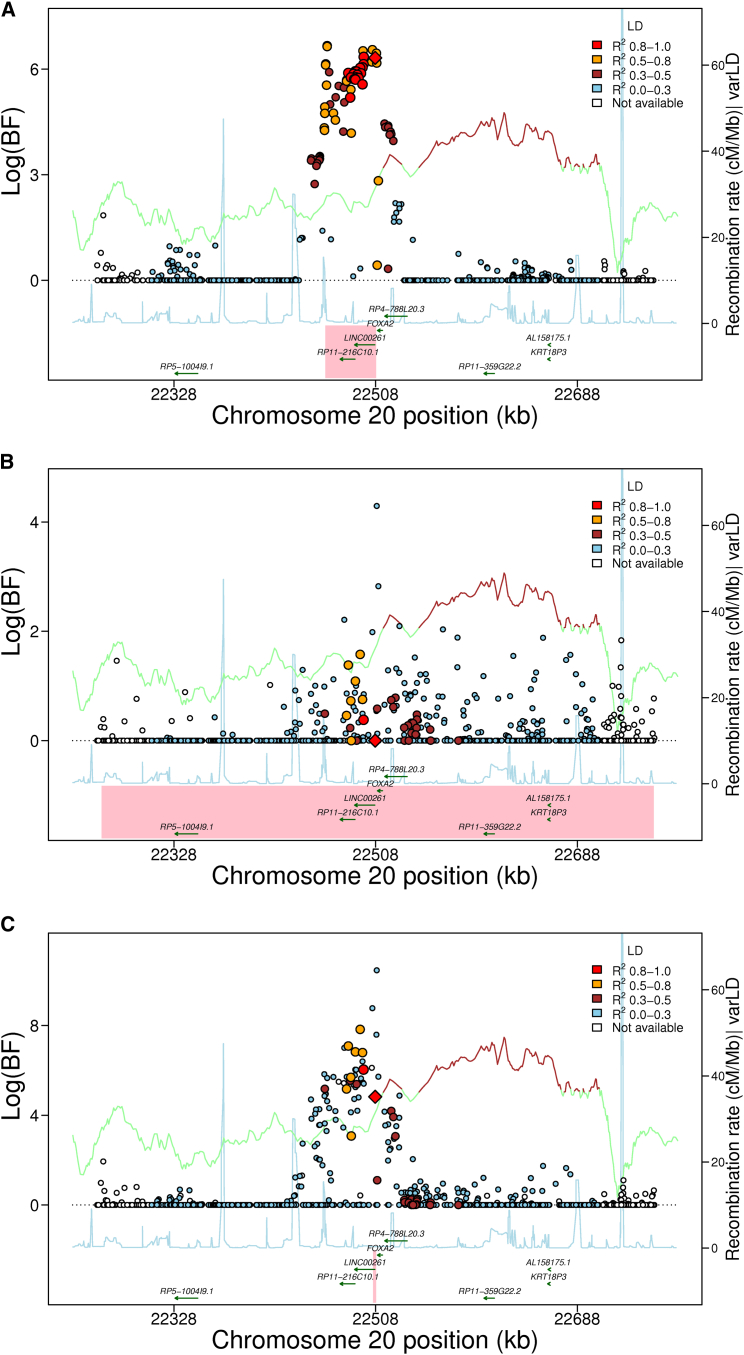
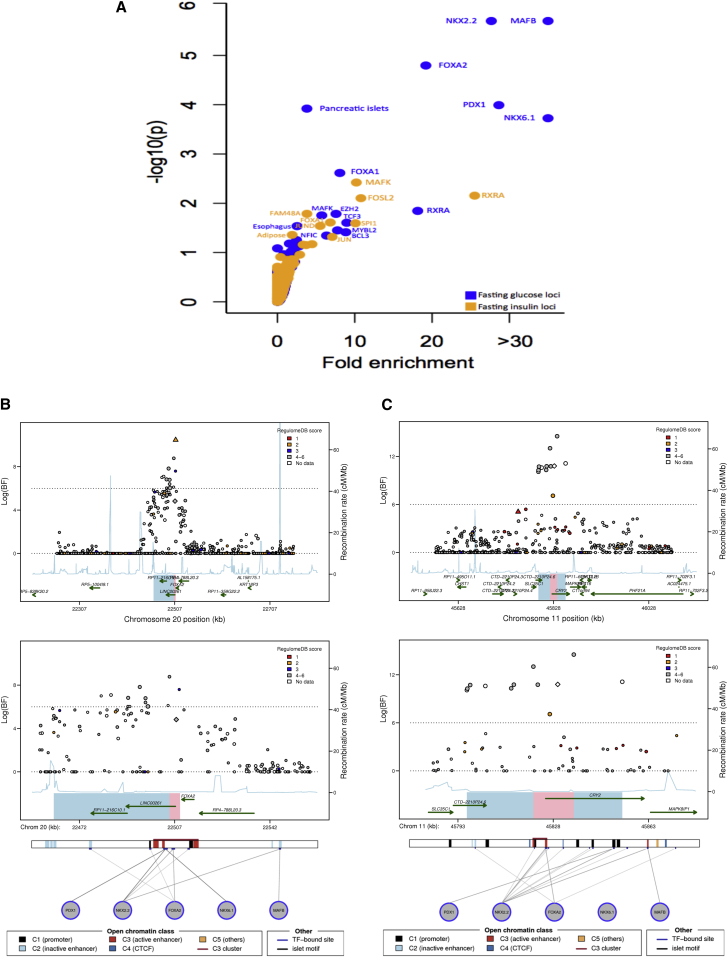
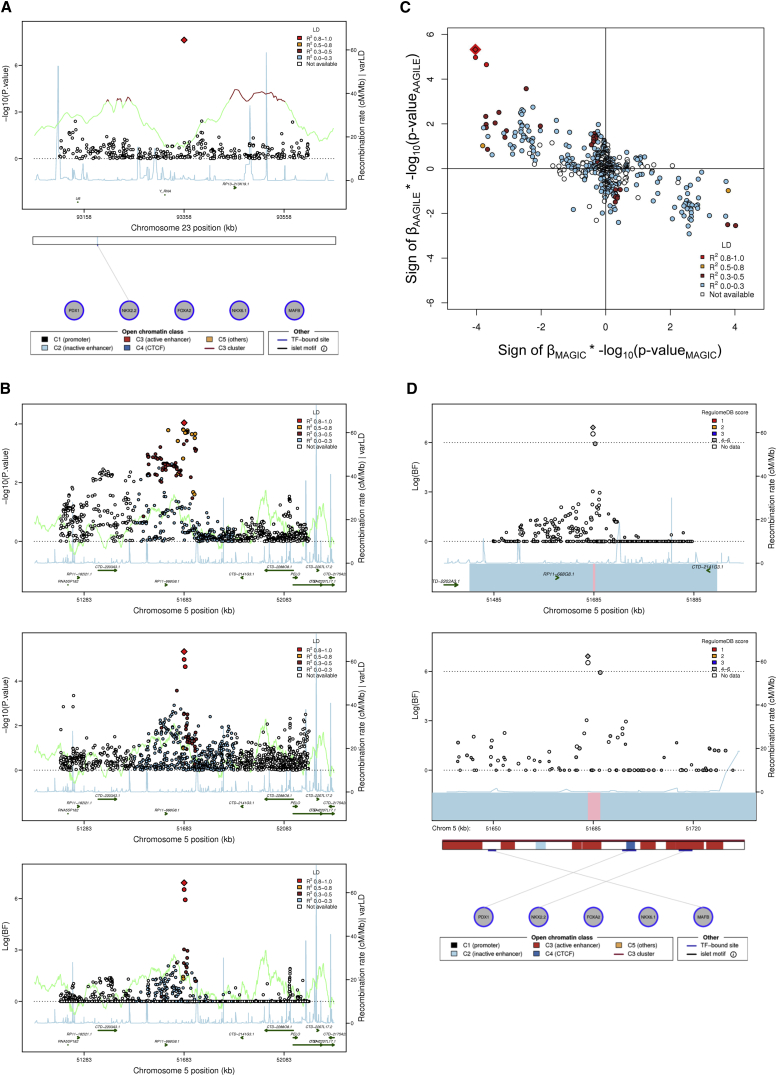
Knowledge of the genetic basis of the type 2 diabetes (T2D)-related quantitative traits fasting glucose (FG) and insulin (FI) in African ancestry (AA) individuals has been limited. In non-diabetic subjects of AA (n = 20,209) and European ancestry (EA; n = 57,292), we performed trans-ethnic (AA+EA) fine-mapping of 54 established EA FG or FI loci with detailed functional annotation, assessed their relevance in AA individuals, and sought previously undescribed loci through trans-ethnic (AA+EA) meta-analysis. We narrowed credible sets of variants driving association signals for 22/54 EA-associated loci; 18/22 credible sets overlapped with active islet-specific enhancers or transcription factor (TF) binding sites, and 21/22 contained at least one TF motif. Of the 54 EA-associated loci, 23 were shared between EA and AA. Replication with an additional 10,096 AA individuals identified two previously undescribed FI loci, chrX FAM133A (rs213676) and chr5 PELO (rs6450057). Trans-ethnic analyses with regulatory annotation illuminate the genetic architecture of glycemic traits and suggest gene regulation as a target to advance precision medicine for T2D. Our approach to utilize state-of-the-art functional annotation and implement trans-ethnic association analysis for discovery and fine-mapping offers a framework for further follow-up and characterization of GWAS signals of complex trait loci.
Copyright © 2016 American Society of Human Genetics. All rights reserved.
Figures
References
-
- Danaei G., Finucane M.M., Lu Y., Singh G.M., Cowan M.J., Paciorek C.J., Lin J.K., Farzadfar F., Khang Y.H., Stevens G.A., Global Burden of Metabolic Risk Factors of Chronic Diseases Collaborating Group (Blood Glucose) National, regional, and global trends in fasting plasma glucose and diabetes prevalence since 1980: systematic analysis of health examination surveys and epidemiological studies with 370 country-years and 2·7 million participants. Lancet. 2011;378:31–40. - PubMed
-
- Cheng C.Y., Reich D., Haiman C.A., Tandon A., Patterson N., Selvin E., Akylbekova E.L., Brancati F.L., Coresh J., Boerwinkle E. African ancestry and its correlation to type 2 diabetes in African Americans: a genetic admixture analysis in three U.S. population cohorts. PLoS ONE. 2012;7:e32840. - PMC - PubMed
-
- Fesinmeyer M.D., Meigs J.B., North K.E., Schumacher F.R., Bůžková P., Franceschini N., Haessler J., Goodloe R., Spencer K.L., Voruganti V.S. Genetic variants associated with fasting glucose and insulin concentrations in an ethnically diverse population: results from the Population Architecture using Genomics and Epidemiology (PAGE) study. BMC Med. Genet. 2013;14:98. - PMC - PubMed
Publication types
MeSH terms
Substances
Grants and funding
- N01 HC085082/HL/NHLBI NIH HHS/United States
- N01 HC095163/HC/NHLBI NIH HHS/United States
- N01 HC095159/HC/NHLBI NIH HHS/United States
- R01 DK078616/DK/NIDDK NIH HHS/United States
- HHSN268201100012C/HL/NHLBI NIH HHS/United States
- U01 HL054472/HL/NHLBI NIH HHS/United States
- R01 HL071025/HL/NHLBI NIH HHS/United States
- N01 HC085086/HC/NHLBI NIH HHS/United States
- U01 HL054471/HL/NHLBI NIH HHS/United States
- R01 HL103612/HL/NHLBI NIH HHS/United States
- HHSN268201300026C/HL/NHLBI NIH HHS/United States
- R01 HG003054/HG/NHGRI NIH HHS/United States
- U01 HG004446/HG/NHGRI NIH HHS/United States
- R01 HL120393/HL/NHLBI NIH HHS/United States
- R01 HL087698/HL/NHLBI NIH HHS/United States
- R01 HL046380/HL/NHLBI NIH HHS/United States
- R00 DK081350/DK/NIDDK NIH HHS/United States
- N01 HC085081/HC/NHLBI NIH HHS/United States
- HHSN268201100010C/HL/NHLBI NIH HHS/United States
- UL1 RR025005/RR/NCRR NIH HHS/United States
- N01 AG062101/AG/NIA NIH HHS/United States
- N01 HC095167/HC/NHLBI NIH HHS/United States
- HHSN268201100008C/HL/NHLBI NIH HHS/United States
- U01 HL080295/HL/NHLBI NIH HHS/United States
- R01 DK089174/DK/NIDDK NIH HHS/United States
- R01 HL059367/HL/NHLBI NIH HHS/United States
- R01 HL087660/HL/NHLBI NIH HHS/United States
- HHSN268201100007C/HL/NHLBI NIH HHS/United States
- HHSN268200800007C/HL/NHLBI NIH HHS/United States
- U01 HL120393/HL/NHLBI NIH HHS/United States
- N01 HC025195/HC/NHLBI NIH HHS/United States
- N01 HC095161/HC/NHLBI NIH HHS/United States
- T32 HL007901/HL/NHLBI NIH HHS/United States
- HHSN268201100011C/HL/NHLBI NIH HHS/United States
- R01 HL086694/HL/NHLBI NIH HHS/United States
- U01 HG004603/HG/NHGRI NIH HHS/United States
- Z01 HG200362/ImNIH/Intramural NIH HHS/United States
- N01 HC095164/HC/NHLBI NIH HHS/United States
- HHSN268201300048C/HL/NHLBI NIH HHS/United States
- UL1 RR025741/RR/NCRR NIH HHS/United States
- N01 HC095166/HC/NHLBI NIH HHS/United States
- U01 HG004402/HG/NHGRI NIH HHS/United States
- U01 HG004424/HG/NHGRI NIH HHS/United States
- UL1 TR000124/TR/NCATS NIH HHS/United States
- N01 AG062106/AG/NIA NIH HHS/United States
- N01 HC095160/HC/NHLBI NIH HHS/United States
- R01 HL060944/HL/NHLBI NIH HHS/United States
- S10 OD018522/OD/NIH HHS/United States
- U01 HL054464/HL/NHLBI NIH HHS/United States
- U54 HD083211/HD/NICHD NIH HHS/United States
- R01 HL119443/HL/NHLBI NIH HHS/United States
- R01 AG032098/AG/NIA NIH HHS/United States
- K01 DK083029/DK/NIDDK NIH HHS/United States
- R01 HL105756/HL/NHLBI NIH HHS/United States
- U01 HG004609/HG/NHGRI NIH HHS/United States
- U01 HG008672/HG/NHGRI NIH HHS/United States
- UL1 TR001422/TR/NCATS NIH HHS/United States
- U01 HG004729/HG/NHGRI NIH HHS/United States
- U01 HL047902/HL/NHLBI NIH HHS/United States
- P30 DK063491/DK/NIDDK NIH HHS/United States
- HHSN268201100006C/HL/NHLBI NIH HHS/United States
- HHSN268201300049C/HL/NHLBI NIH HHS/United States
- HHSN268200782096C/HG/NHGRI NIH HHS/United States
- K99 DK081350/DK/NIDDK NIH HHS/United States
- HHSN268201200036C/HL/NHLBI NIH HHS/United States
- P30 DK098722/DK/NIDDK NIH HHS/United States
- HHSN268200900041C/HL/NHLBI NIH HHS/United States
- HHSN268201300028C/HL/NHLBI NIH HHS/United States
- N01 AG062103/AG/NIA NIH HHS/United States
- K24 DK106414/DK/NIDDK NIH HHS/United States
- K24 DK080140/DK/NIDDK NIH HHS/United States
- DP2 CA196375/CA/NCI NIH HHS/United States
- N01 HC085079/HL/NHLBI NIH HHS/United States
- HHSN268201300050C/HL/NHLBI NIH HHS/United States
- N01 HC095169/HC/NHLBI NIH HHS/United States
- HHSN268201300047C/HL/NHLBI NIH HHS/United States
- P30 DK020541/DK/NIDDK NIH HHS/United States
- T37 TW000041/TW/FIC NIH HHS/United States
- R01 AR049747/AR/NIAMS NIH HHS/United States
- U01 HL072518/HL/NHLBI NIH HHS/United States
- U01 DK078616/DK/NIDDK NIH HHS/United States
- U24 AG051129/AG/NIA NIH HHS/United States
- R01 HL088215/HL/NHLBI NIH HHS/United States
- M01 RR010284/RR/NCRR NIH HHS/United States
- N01 HC095165/HC/NHLBI NIH HHS/United States
- R01 HL059684/HL/NHLBI NIH HHS/United States
- R21 HL123677/HL/NHLBI NIH HHS/United States
- R01 DK089256/DK/NIDDK NIH HHS/United States
- U01 HG006378/HG/NHGRI NIH HHS/United States
- U19 HL069757/HL/NHLBI NIH HHS/United States
- HHSN268201100009C/HL/NHLBI NIH HHS/United States
- HHSN268201100005C/HL/NHLBI NIH HHS/United States
- N01 HC095168/HC/NHLBI NIH HHS/United States
- U01 HL054481/HL/NHLBI NIH HHS/United States
- UL1 TR000040/TR/NCATS NIH HHS/United States
- HHSN268201300046C/HL/NHLBI NIH HHS/United States
- S06 GM008016/GM/NIGMS NIH HHS/United States
- U01 HG008673/HG/NHGRI NIH HHS/United States
- R01 HL117078/HL/NHLBI NIH HHS/United States
- R01 AG023629/AG/NIA NIH HHS/United States
- R01 HL087641/HL/NHLBI NIH HHS/United States
- UL1 TR001881/TR/NCATS NIH HHS/United States
- N01 HC095162/HC/NHLBI NIH HHS/United States
- R01 DK079888/DK/NIDDK NIH HHS/United States
- M01 RR000080/RR/NCRR NIH HHS/United States
- R01 HL087700/HL/NHLBI NIH HHS/United States
- R01 HL055673/HL/NHLBI NIH HHS/United States
- R01 DK097084/DK/NIDDK NIH HHS/United States
LinkOut - more resources
Full Text Sources
Other Literature Sources
Medical
Molecular Biology Databases
Miscellaneous
