. 2016 Jul 25;26(14):1902-10.
doi: 10.1016/j.cub.2016.05.039. Epub 2016 Jun 16.

Patients with Parkinson's Disease Show Impaired Use of Priors in Conditions of Sensory Uncertainty

Affiliations

Patients with Parkinson's Disease Show Impaired Use of Priors in Conditions of Sensory Uncertainty

Alessandra Perugini et al. Curr Biol. .

Abstract

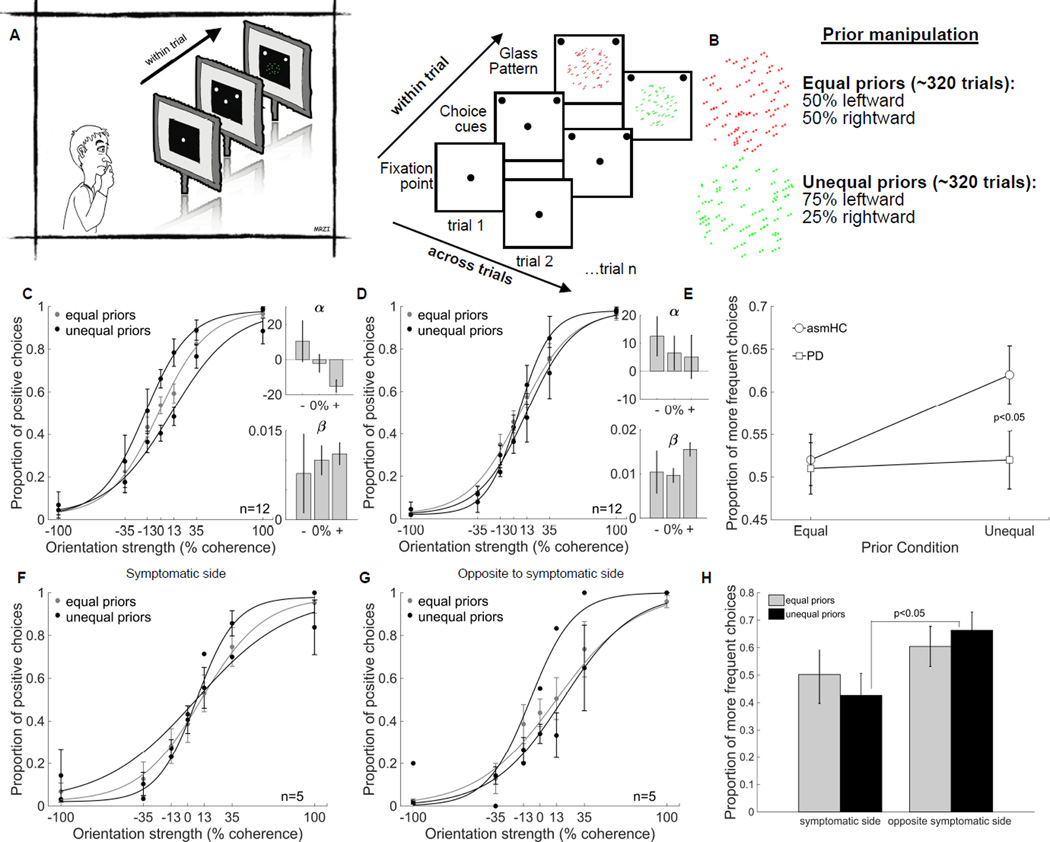
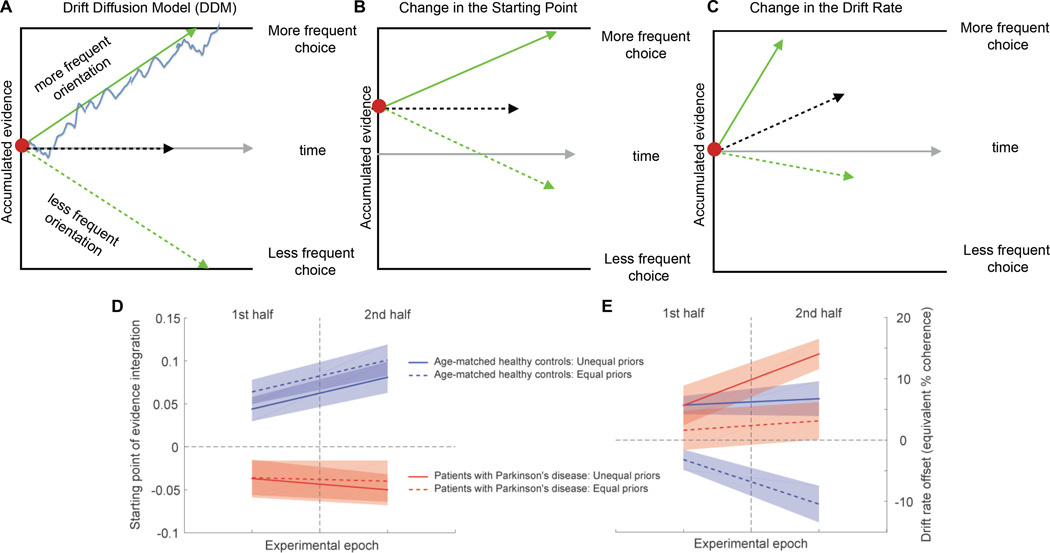
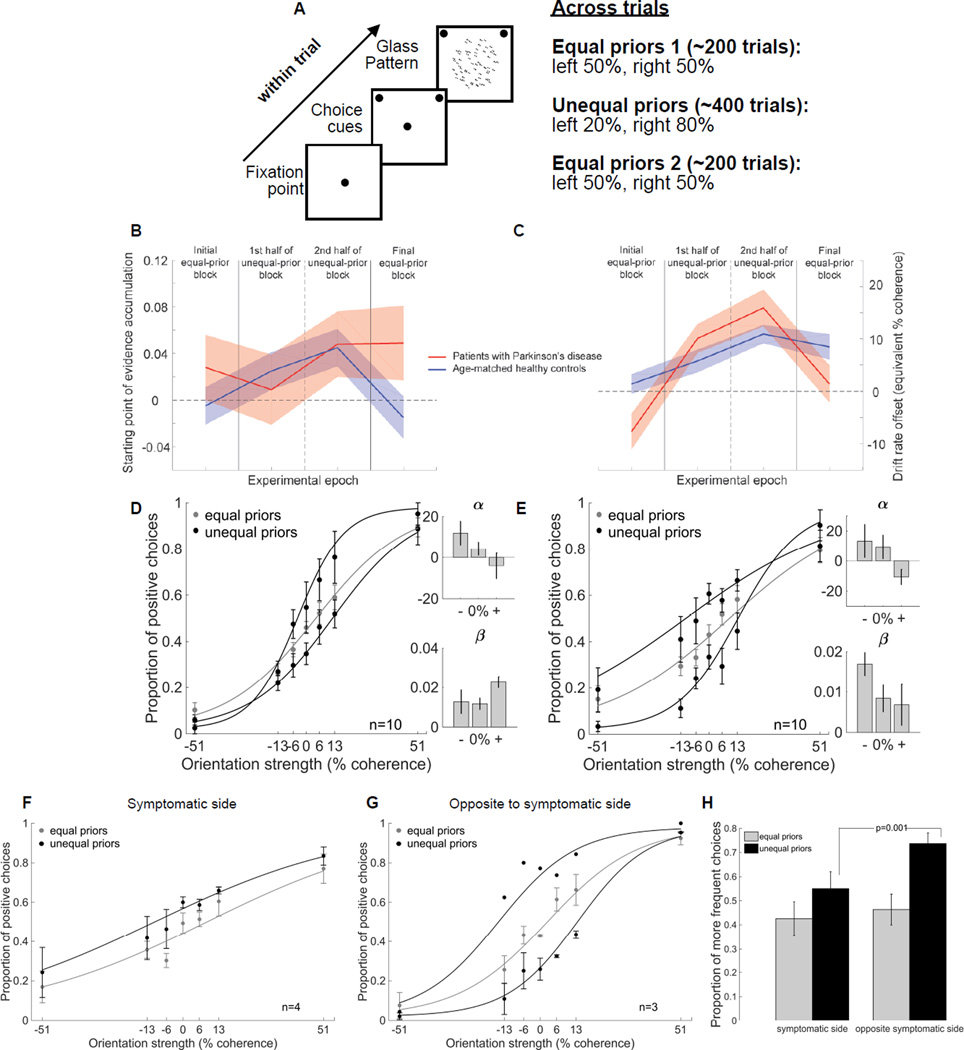
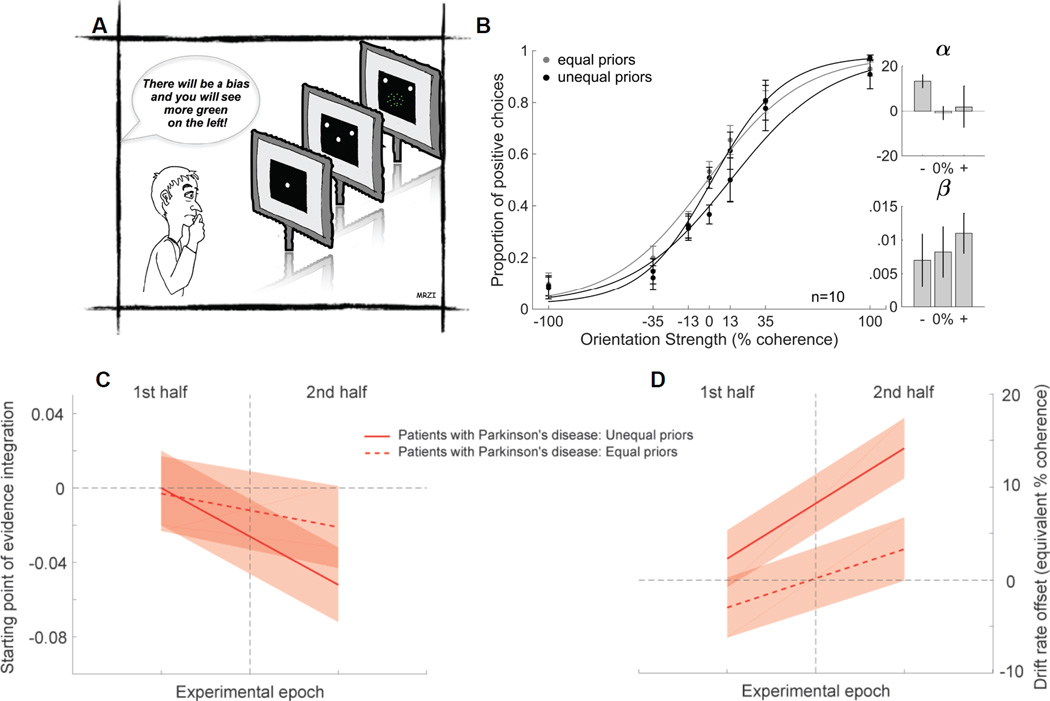
Perceptual decisions arise after considering the available sensory evidence [1]. When sensory information is unreliable, a good strategy is to rely on previous experience in similar situations to guide decisions [2-6]. It is well known that patients with Parkinson's disease (PD) are impaired at value-based decision-making [7-11]. How patients combine past experience and sensory information to make perceptual decisions is unknown. We developed a novel, perceptual decision-making task and manipulated the statistics of the sensory stimuli presented to patients with PD and healthy participants to determine the influence of past experience on decision-making. We show that patients with PD are impaired at combining previously learned information with current sensory information to guide decisions. We modeled the results using the drift-diffusion model (DDM) and found that the impairment corresponds to a failure in adjusting the amount of sensory evidence needed to make a decision. Our modeling results also show that two complementary mechanisms operate to implement a bias when two sets of priors are learned concurrently. Asymmetric decision threshold adjustments, as reflected by changes in the starting point of evidence accumulation, are responsible for a general choice bias, whereas the adjustment of a dynamic bias that develops over the course of a trial, as reflected by a drift-rate offset, provides the stimulus-specific component of the prior. A proper interplay between these two processes is required to implement a bias based on concurrent, stimulus-specific priors in decision-making. We show here that patients with PD are impaired in these across-trial decision threshold adjustments.

Keywords: Glass patterns; basal ganglia; bias; cognition; decision-making; drift-diffusion model; expectancy; implicit learning; memory; perception.


Figures

Figure 1
Figure 1. Patients with PD are impaired in using priors to guide decisions
(A) Participants performed a two-alternative forced choice task in which they discriminated between two possible stimulus orientations (rightward or leftward). Initially, a centrally-located fixation spot appeared and then one choice target appeared in each hemifield. On randomly interleaved trials, either a red or a green Glass pattern appeared replacing the fixation point and varying in dot pair coherence, making the orientation discrimination more or less difficult. The coherence of the Glass pattern was also randomly chosen on every trial. Participants indicated what direction they perceived by making an eye movement to one of the two choice targets (left or right) or by pressing the “O” (leftward) or the ‘P” (rightward) key on a computer keyboard using one hand. Participants heard a beep for every correct trial and received no feedback for incorrect trials. No explicit reward was provided. (B) The certainty of the sensory information contained in the Glass pattern was manipulated by varying the dot pair coherence (orientation strength), which ranged from 0% (no information about orientation) to 100% (all pairs sharing same orientation). To assess the influence of past experience on decision-making performance we manipulated the statistics of the task. The two directions of orientation of the Glass patterns occurred with unequal frequencies for stimuli of one color (75:25) and occurred with the same frequency for stimuli of the other color (50:50) counterbalanced across participants. (C) Proportion of leftward (positive) choices is plotted against orientation strength for n = 12 asmHC (5 males, 7 females, mean age 63yrs). These data are fitted with a logistic function of the form, p(P) = λ + (1–2* λ)/(1+exp(-β (C-α))); where p(P) is the proportion of positive choices and C is dot pair coherence. α and β are free parameters determined using maximum likelihood methods, and provide a measure of the response bias (α) and the slope or sensitivity of the psychometric function (β). The lapse rate λ is the difference between the asymptote of the function and perfect performance. It is assumed to arise from transient lapses in attention during task performance. A description of the fit and parameters is provided in Figure S1A. The grey points and lines show the data and the logistic fits in the equal prior trials (50:50) whereas the black points and lines show the data for unequal prior trials (75:25). The direction and color of the stimulus with different priors were counterbalanced across participants so that all participants contributed to the grey data and different subsets of participants contributed to the two black curves. The insets show the α and β parameters for the fits in the negative, equal and positive prior trials. Error bars are ±SEM. Since this task has not been used before, we validated performance and use of the stimulus-specific priors in young healthy control participants (yHC). These results are shown in Figure S1B-D. We further showed that trial-by-trial feedback is required to learn the priors to perform this task correctly (Figure S1E). (D) Proportion of positive choices is plotted against orientation strength for patients with PD. N = 12 (7 males, 5 females, mean age 66yrs). (E) Proportion of more frequent choices for the most difficult stimuli (0% and 13% coherence) is plotted for asmHC (circles) and patients with Parkinson’s (squares) in the Equal and Unequal prior condition. Error bars are ±SEM. (F) Proportion of positive choices is plotted against orientation strength for patients who experienced the prior on their symptomatic side (n=5, 2 males 3 females). Grey points and lines show data and fits for all 5 patients whereas the black lines show the data and fits for 4 patients for the leftward prior and 1 patient for the rightward prior. (G) Proportion of positive choices is plotted against orientation strength for patients who experienced the prior on the side opposite their symptoms (n=5, 4 males 1 female). Grey points and lines show data and fits for all 5 patients whereas the black lines show the data and fits for 1 patient for the leftward prior and 4 patients for the rightward prior. (H) Proportion of more frequent choices for the most difficult stimuli is plotted for the equal (grey) and unequal prior (black) conditions for the symptomatic and opposite sides. Error bars are ±SEM. See also Figure S1 and Table S1.
Figure 2
Figure 2. Patients with Parkinson’s fail to adjust the starting point of evidence accumulation
(A) The drift diffusion model (DDM) explains choice performance and reaction times (RTs) in 2-alternative forced choice decision tasks. Noisy sensory evidence is accumulated (blue line) until one of two decision bounds (black lines) is reached, terminating the decision process. The distance between the starting point (red dot) and the bound is the amount of evidence required for a decision and is referred to as the decision threshold. Each bound corresponds to one of the two choice alternatives. The average rate at which evidence accumulates, referred to as the drift rate, is determined by the strength of the sensory stimulus. The green arrows reflect situations with strong stimuli, in which case decisions tend to be fast and accurate. The black dashed arrow reflects a situation with a very weak stimulus, in which case uncertainty is high and decisions tend to be slow and inaccurate. The grey arrow indicates advancing time. Trial-to-trial variability in the accumulation process leads to variability in choice and reaction time. (B) Prior information leading to a decision bias can be implemented in two possible ways in the DDM framework. In one, the sensory evidence accumulation process starts closer to the bound that is associated with the choice that should be more frequent according to the priors. An initial value of +1 on the accumulated evidence axis indicates that the process starts right at this decision bound, and a negative value indicates that the process starts closer to the opposite bound, leading to a decision bias that would be inconsistent with the priors. A starting point offset of zero indicates that the accumulation process starts at an equal distance from both decision bounds. Shifting the starting point of evidence accumulation closer to one of the bounds leads to the corresponding option being chosen more frequently. (C) Prior information leading to a decision bias can also be implemented by adding an offset to the drift rate such that, even in the absence of sensory evidence, the process drifts towards one of the decision bounds (and away from the opposite bound), which also results in one of the options being chosen more frequently. Although both mechanisms have similar effects on biasing choices, they have different effects on RTs, which provides the basis for computational modeling being able to estimate the contributions of both mechanisms to the decision behavior [13, 17, 38]. Note that the schematics shown are idealized model representations. Our model included an urgency component in the form of collapsing decision bounds to capture the RT distributions in our data set. See Supplemental Information for model details. (D) We modeled the data from the dichromatic task and allowed the starting point of evidence accumulation and the drift rate offset to be stimulus-specific and to change over time. We estimated the parameters for two different task epochs: first half and second half of the trials, reasoning that it requires time for the influence of the priors to appear (see Figure S1E). All other model parameters remained fixed. Blue lines show parameter estimates for the starting point of evidence accumulation (mechanism shown in B) in the two epochs for the group of 12 asmHC of Figure 1C, red lines for the group of 12 patients of Figure 1D. Dashed lines are for the equal prior stimuli, solid lines for the stimuli with unequal priors. Shaded areas indicate 95% confidence intervals. (E) Parameter estimates for the drift rate offset (mechanism shown in C), otherwise as in D. A positive value of the drift rate offset indicates that the process drifts towards the bound associated with the more frequent choice according to the priors. The size of the offset is provided in terms of equivalent coherence. For example, a value of 10% means that, in the absence of any sensory evidence, the decision process drifts towards one of the bounds with a rate equivalent to what would normally be observed in the presence of a stimulus with 10% coherence. See also Figure S2, Table S1, Table S2 and Table S5.
Figure 3
Figure 3. Drift rate offsets can compensate for impaired starting point adjustments in patients with PD
(A) To determine whether the patients showed impairments in starting point adjustments even in an easier version of the task, we designed a simpler task that did not require tracking multiple sets of priors and that also had an initial, equal prior condition, before introducing unequal priors. This allowed us to determine the baseline starting point of evidence accumulation in patients. Participants performed three blocks of trials. During the first block we presented 200 randomly interleaved stimuli, half of the stimuli were leftward oriented Glass patterns and half were rightward oriented Glass Patterns. The next block consisted of 400 stimuli unevenly distributed between leftward and rightward Glass patterns (unequal priors): either 80% leftward and 20% rightward (80:20) or vice versa. The orientation associated with the higher probability of occurrence was counterbalanced across participants. The last block was the same as the first having an equal number of leftward and rightward Glass patterns (50:50). We made this task simpler by using only a monochromatic Glass pattern and therefore refer to this task as the monochromatic task. We validated the performance and the use of priors in this task in yHC (Figure S1F) and also the requirement of feedback for learning the priors (Figure S1G). (B) Using the DDM, we estimated the starting point of evidence accumulation for four different task epochs: the initial control block with equal priors, the first half of the block with unequal priors, the second half of this block (reasoning that it would take time for the influence of the priors to develop - see Figure S1G), and the final block of trials with equal priors. The four epochs are demarcated by the vertical lines. The blue line shows parameter estimates for asmHC. The red line shows parameter estimates for patients with PD. Shaded areas indicate 95% confidence intervals. (C) Parameter estimates for drift rate offset, otherwise like B. (D) Proportion of positive choices is plotted against orientation strength for 10 patients with PD (5 males and 5 females, mean age 63yrs). The grey points and lines show the data and the logistic fits in the equal prior trials (50:50) whereas the black points and lines show the data for unequal prior trials (80:20). The direction and color of the stimulus with different priors were counterbalanced across participants so that all participants contributed to the grey data and different subsets of participants contributed to the black data. (E) Same as in (D) for 10 asmHC (4 males, 6 females, mean age 56yrs). (F) Proportion of positive choices is plotted against orientation strength for patients who experienced the prior on their symptomatic side (n=4, 1 male 3 females). Grey points and lines as well as black points and lines show data and fits for all 4 patients who experienced a leftward bias. (G) Proportion of positive choices is plotted against orientation strength for patients who experienced the prior on their symptomatic side (n=3, 2 males 1 females). Grey points and lines show data and fits for all 3 patients whereas black points and lines show the data and fits for 1 patient who experienced the leftward bias and 2 patients who experienced the rightward bias. (H) Proportion of more frequent choices for the most difficult stimuli (0% and 13% coherence) is plotted for the equal (grey) and unequal prior (black) conditions for the symptomatic and opposite sides. Error bars in panels D-H are ±SEM. See also Figure S1, Figure S3, Table S1, Table S3 and Table S5
Figure 4
Figure 4. Patients with PD do not benefit from explicit knowledge of prior probabilities
(A) Schematic of the dichromatic Glass pattern task showing that participants were informed of the priors explicitly (75:25) by instruction (“explicit task”). This eliminates the need for learning. We first verified the validity of this manipulation by testing a group of 16 naïve yHCs performing the dichromatic task without feedback but with explicit, verbal instructions and we concluded that providing explicit instructions about the priors is a valid way to induce a decision bias in the absence of feedback learning (Figure S1H). (B) Proportion of positive choices is plotted against the orientation strength from 10 patients with PD (4 females, 6 males, mean age 62 yrs) as in Figure 1C. The grey points and lines show the data and logistic fits from the equal prior conditions whereas the black points and lines show the data and fits for the unequal prior conditions. The prior direction was counterbalanced across participants so different subsets of patients contribute to the two prior direction conditions. All patient data contribute to the equal prior condition. Six of the 10 patients also performed the original version of the dichromatic task ~5 months before performing the explicit task. Only 2 of the patients experienced opposite priors in the two tasks, minimizing the likelihood of learning conflicting priors and maximizing the chances that if patients could use the prior they would. After completing this task, 8 patients reported following the instructions and all 10 reported being aware of the unequal priors even though they failed to use them. This observation rules out an interpretation based on faulty working or short-term memory for the priors. (C) Starting point of evidence accumulation from the drift-diffusion model during the two experimental epochs (separated by the vertical line) of the explicit task for patients. The solid red line is for the stimuli with unequal priors, the dashed red line for the stimuli with equal priors. Shaded areas indicate 95% confidence intervals. (D) Parameter estimates for drift rate offset, otherwise like C. See also Figure S1, Table S1 and Table S4.

Comment in

References

    1. Gold JI, Shadlen MN. The neural basis of decision making. Annual Review of Neuroscience. 2007;30:535–574. - PubMed
    1. Mulder MJ, Wagenmakers EJ, Ratcliff R, Boekel W, Forstmann BU. Bias in the brain: a diffusion model analysis of prior probability and potential payoff. J Neurosci. 2012;32:2335–2343. - PMC - PubMed
    1. Leite F, Ratcliff R. What cognitive processes drive response biases? A diffusion model analysis. Judgement and Decision Making. 2011;6:651–687.
    1. Summerfield C, Egner T. Expectation (and attention) in visual cognition. Trends in Cognitive Sciences. 2009;13:403–409. - PubMed
    1. Hanks TD, Mazurek ME, Kiani R, Hopp E, Shadlen MN. Elapsed Decision Time Affects the Weighting of Prior Probability in a Perceptual Decision Task. The Journal of Neuroscience. 2011;31:6339–6352. - PMC - PubMed

Publication types