. 2016 Jul 1;126(7):2757-72.
doi: 10.1172/JCI86114. Epub 2016 Jun 20.

RBPJ maintains brain tumor-initiating cells through CDK9-mediated transcriptional elongation

RBPJ maintains brain tumor-initiating cells through CDK9-mediated transcriptional elongation

Qi Xie et al. J Clin Invest. .

Abstract

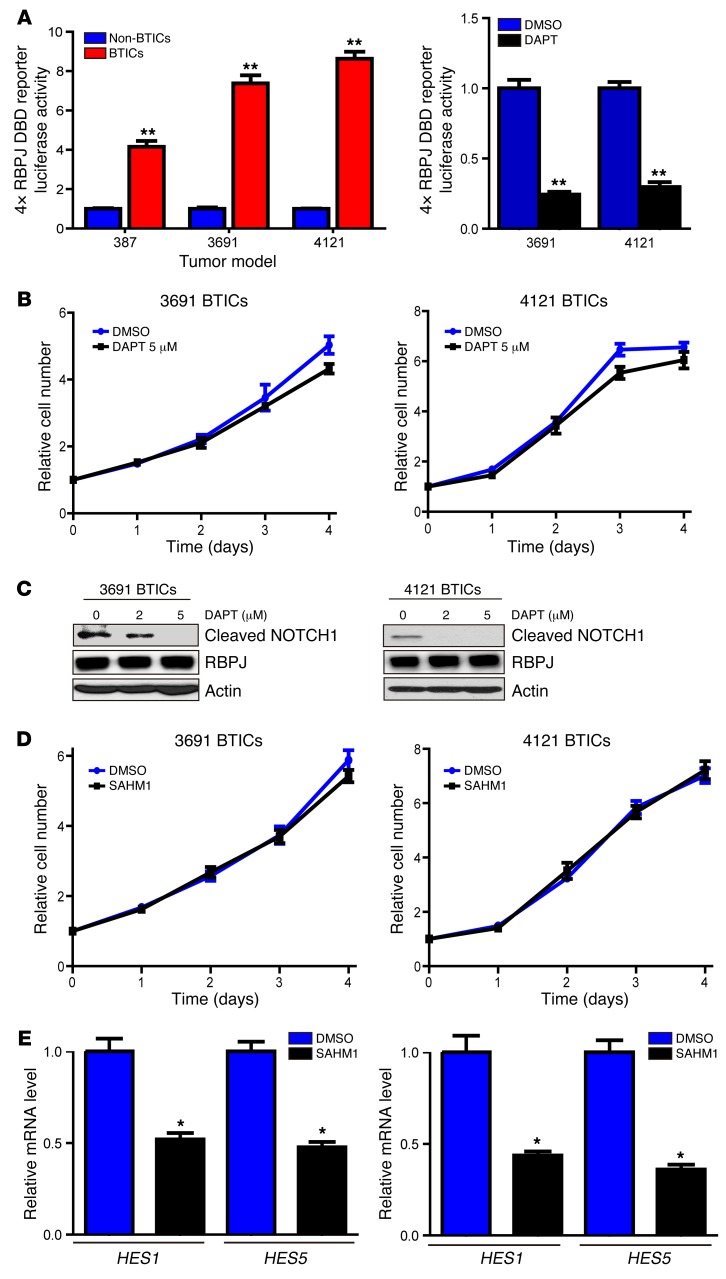
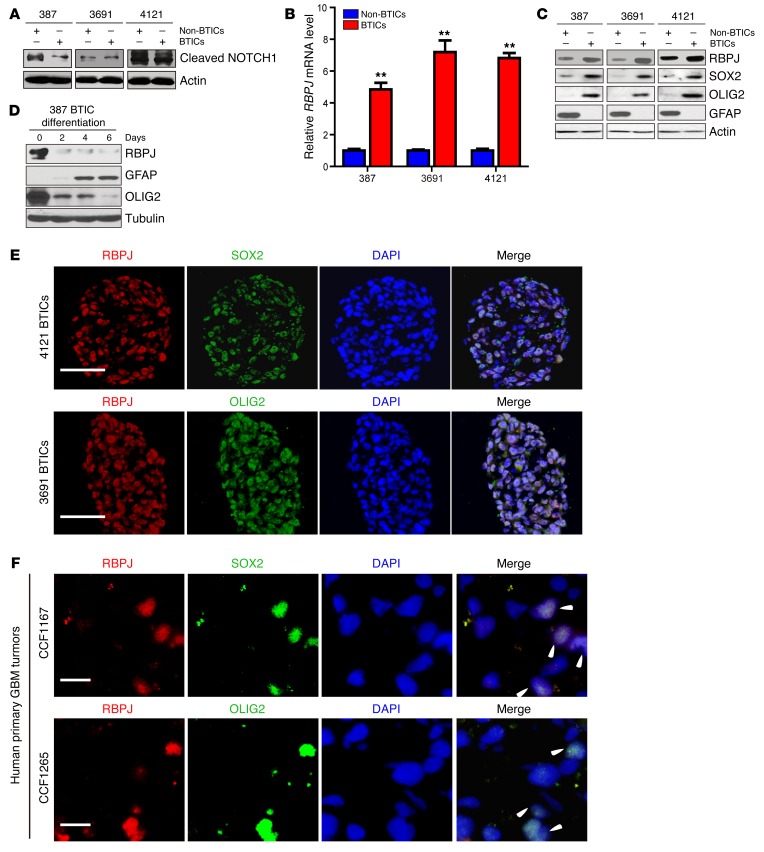
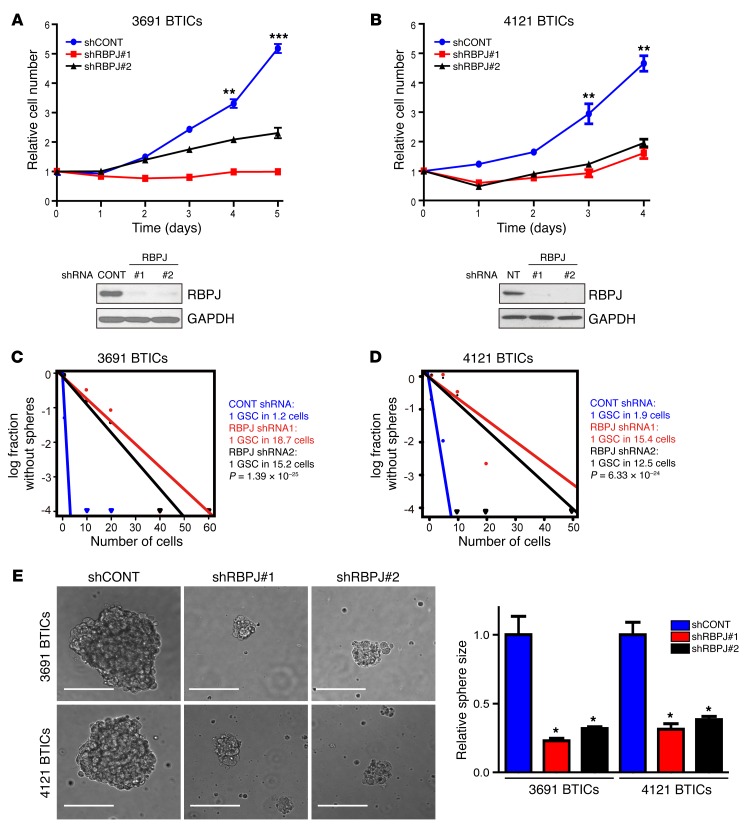
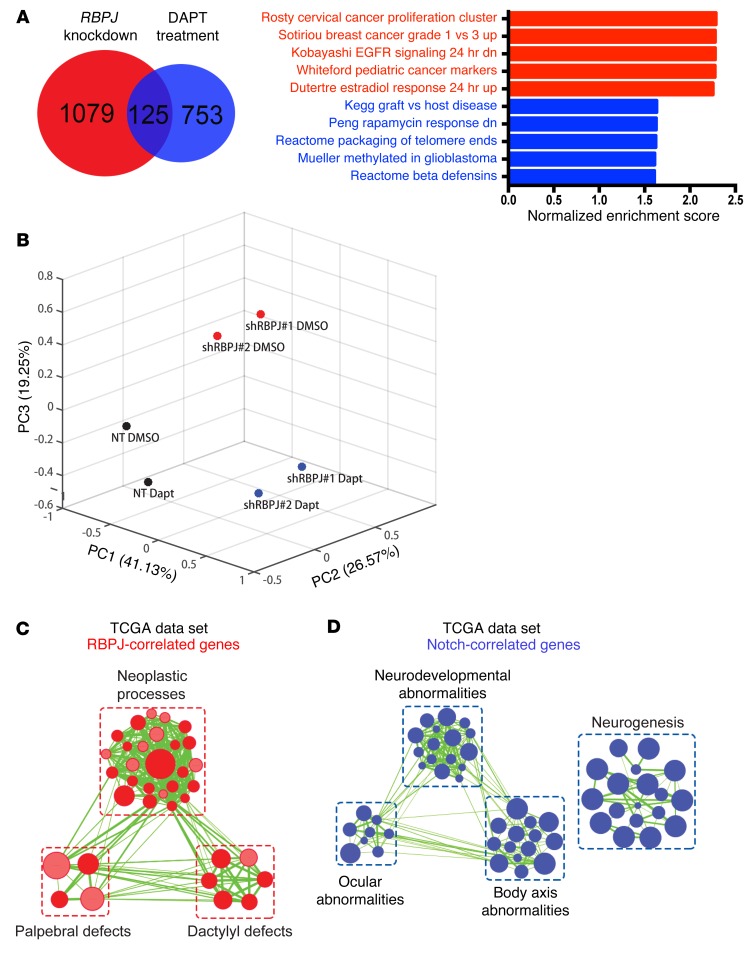
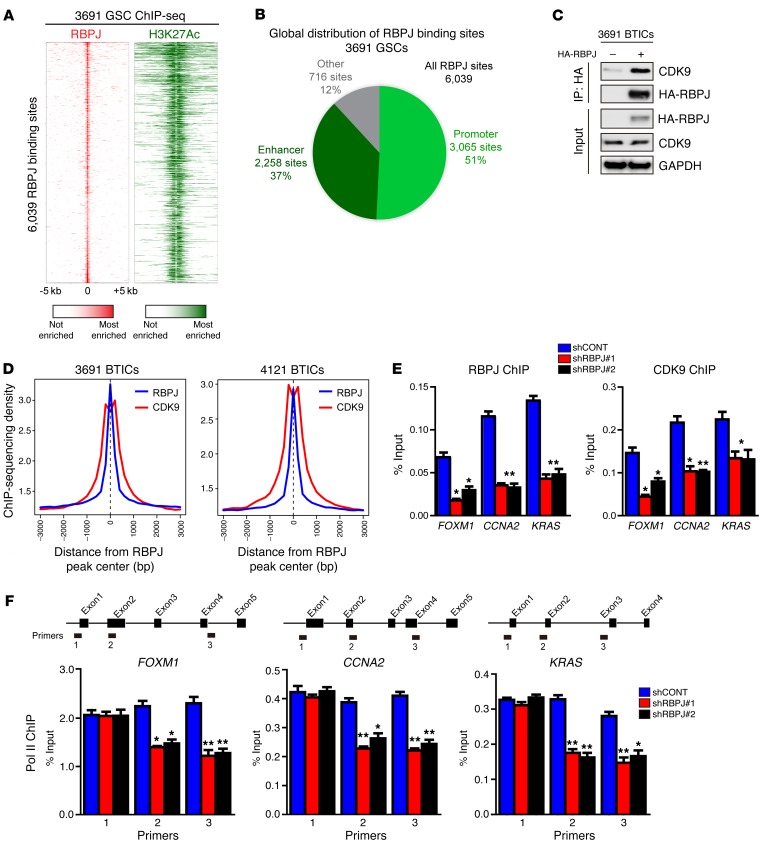
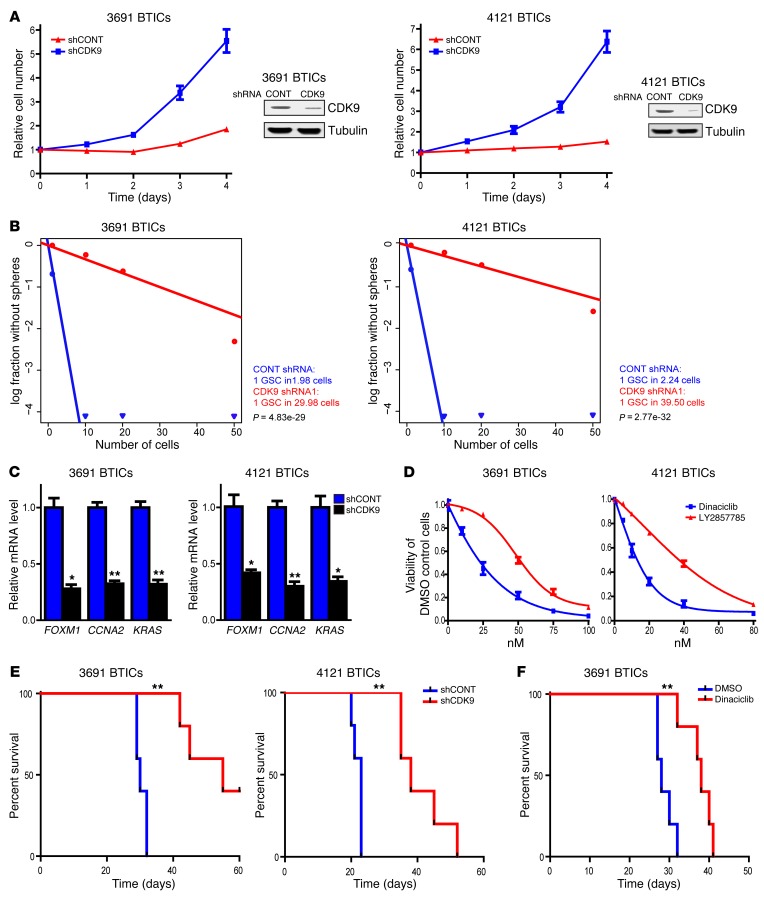
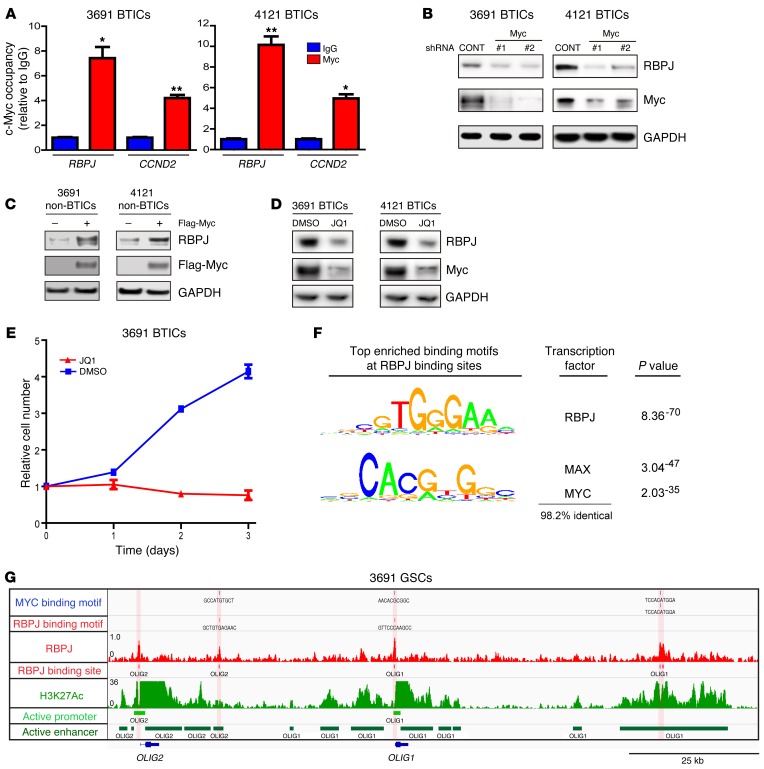
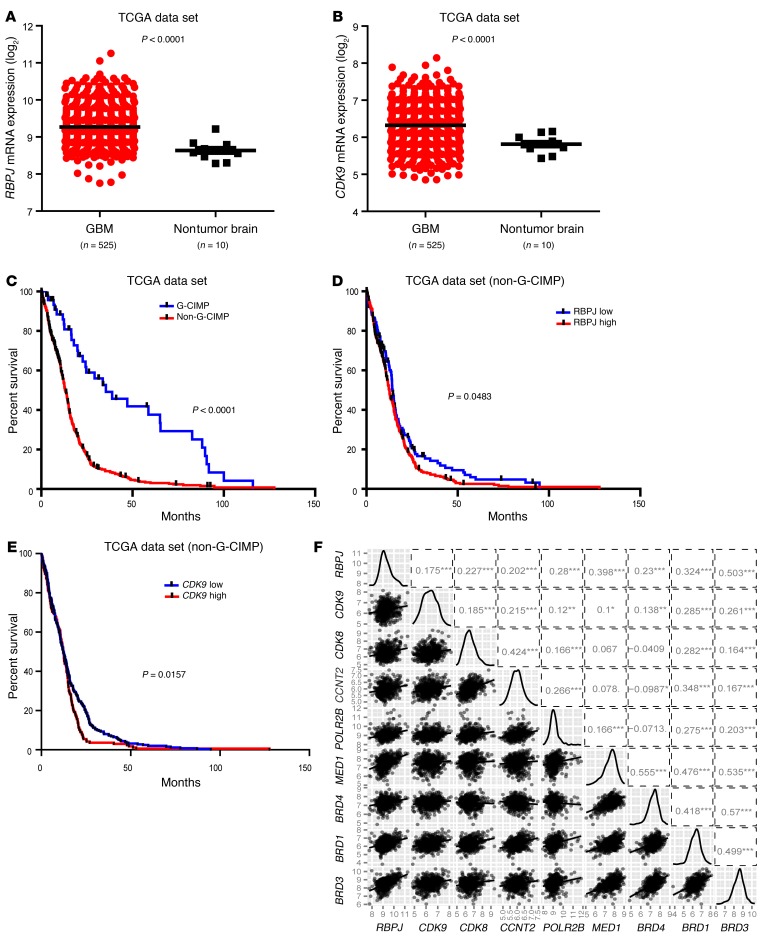
Glioblastomas co-opt stem cell regulatory pathways to maintain brain tumor-initiating cells (BTICs), also known as cancer stem cells. NOTCH signaling has been a molecular target in BTICs, but NOTCH antagonists have demonstrated limited efficacy in clinical trials. Recombining binding protein suppressor of hairless (RBPJ) is considered a central transcriptional mediator of NOTCH activity. Here, we report that pharmacologic NOTCH inhibitors were less effective than targeting RBPJ in suppressing tumor growth. While NOTCH inhibitors decreased canonical NOTCH gene expression, RBPJ regulated a distinct profile of genes critical to BTIC stemness and cell cycle progression. RBPJ was preferentially expressed by BTICs and required for BTIC self-renewal and tumor growth. MYC, a key BTIC regulator, bound the RBPJ promoter and treatment with a bromodomain and extraterminal domain (BET) family bromodomain inhibitor decreased MYC and RBPJ expression. Proteomic studies demonstrated that RBPJ binds CDK9, a component of positive transcription elongation factor b (P-TEFb), to target gene promoters, enhancing transcriptional elongation. Collectively, RBPJ links MYC and transcriptional control through CDK9, providing potential nodes of fragility for therapeutic intervention, potentially distinct from NOTCH.


Figures

Figure 1
Figure 1. NOTCH inhibition does not attenuate cell autonomous BTIC growth.
(A) Left: Matched sets of BTICs and non-BTICs (387, 3691, and 4121) were transfected with a 4× RBPJ luciferase reporter together with a tk-renilla reporter. Data are displayed as mean ± SEM for the ratio of firefly-to-renilla luciferase (t test, **P < 0.01, n = 3). Right: 3691 and 4121 BTICs were transfected with a 4× RBPJ luciferase reporter together with a tk-renilla reporter, and then treated with the NOTCH antagonist, DAPT (5 μM), or vehicle control (DMSO). Data are displayed as mean ± SEM for the ratio of firefly-to-renilla luciferase (Student’s t test, **P < 0.01, n = 3). (B) Effects of DAPT or vehicle control (DMSO) on cell proliferation were tested in two BTIC models (3691 and 4121). Data are displayed as the mean values for each time point. (C) Cleaved NOTCH1 (NOTCH intracellular domain [NICD]) levels were analyzed by immunoblot after treatment with vehicle control or DAPT in two BTIC models (3691 and 4121). (D) Effects of the stapled peptide NOTCH inhibitor, SAHM1, or vehicle control (DMSO) on cell proliferation were tested in two BTIC models (3691 and 4121). Data are displayed as the mean values for each time point. (E) Effects of SAHM1 treatment on downstream NOTCH target gene expression (HES1 and HES5) were tested in two BTIC models (3691 and 4121). Cells were treated with SAHM1 for two days. Total RNA was isolated and cDNA was synthesized by reverse transcription. The mRNA levels of indicated genes were detected by qPCR (t test, *P < 0.05, n = 3).
Figure 2
Figure 2. RBPJ is highly expressed in BTICs.
(A) Cleaved NOTCH1 levels were assayed by immunoblot in matched BTICs and non-BTICs isolated from patient-derived xenografts (387, 3691, and 4121). (B) RBPJ mRNA levels in BTICs and non-BTICs were detected by qPCR. Data are displayed as mean ± SEM (t test, **P < 0.01, n = 3). (C) RBPJ protein levels were assayed in matched BTICs and non-BTICs isolated from patient-derived xenografts (387, 3691, and 4121). (D) RBPJ protein levels were assayed by immunoblotting during a time course of BTIC differentiation induced by 10% serum. (E) Coexpression of RBPJ and BTIC markers, SOX2 and OLIG2, was assayed by immunofluorescence in tumorspheres isolated from patient-derived xenografts (3691 and 4121). Nuclei were visualized by DAPI staining. Scale bars: 50 μm. (F) Coexpression of RBPJ and BTIC markers, SOX2 and OLIG2, was assayed by immunofluorescence in two primary human glioblastoma (GBM) specimens (CCF1167 and CCF1265). Nuclei were visualized by DAPI staining. Scale bars: 10 μm.
Figure 3
Figure 3. Targeting RBPJ decreases BTIC growth and self-renewal.
(A and B) Effects of shRNA against RBPJ were tested in two BTIC models (3691 and 4121). Top: BTICs were transduced with a control, nontargeting shRNA sequence (shCONT) or one of two nonoverlapping shRBPJ sequences. Proliferation was measured by CellTiter-Glo (2-way ANOVA: **P < 0.01, ***P < 0.001, n = 4). Bottom: RBPJ protein levels were assayed by immunoblot following transduction with shCONT or shRBPJ. (C and D) Tumorsphere formation efficiency was measured by extreme in vitro limiting dilution assays in two BTIC models (3691 and 4121) after transduction with shCONT or shRBPJ. (E) Left: Representative images of tumorspheres derived from two BTIC lines transduced with shCONT or shRBPJ are shown. Scale bars: 100 μm. Right: Quantification of tumorsphere size is displayed as mean ± SEM (2-way ANOVA, *P < 0.05, n = 3).
Figure 4
Figure 4. Targeting RBPJ decreases BTIC tumor formation.
(A) Tumor size of orthotopic glioblastoma xenografts derived from luciferase-expressing BTICs transduced with shCONT or shRBPJ was tracked by bioluminescence over a time course. (B) Survival of immunocompromised mice bearing intracranial 3691 or 4121 BTICs transduced with shCONT or shRBPJ is displayed by the Kaplan-Meier method (log-rank analysis, **P < 0.01, n = 5).
Figure 5
Figure 5. RBPJ induces transcriptional profiles in BTICs distinct from NOTCH activation.
(A) GSEA results from ranked genes in 3691 BTICs in which RBPJ was knocked down or treated with DAPT alone. Genes that exhibited at least a 1.5-fold decrease upon RBPJ knockdown or DAPT treatment compared to respective controls (nontargeting vs. DMSO). (B) The first three principal components and their loadings for 4121 BTICs based on RNA sequencing after transduction with either shCONT or shRBPJ and treatment with either vehicle control (DMSO) or DAPT treatment (5 μM). (C and D) Gene signature enrichment was analyzed using gProfiler (34) with genes whose RNA expression was most significantly correlated with (P < 0.001, r > 0.3) and mutually exclusive for (C) RBPJ or (D) NOTCH1 in the TCGA data set. Enriched gene sets for either gene were visualized via Enrichment Map on Cytoscape (35) for signatures with FDR < 0.001 and P < 0.005.
Figure 6
Figure 6. RBPJ binds to CDK9 to promote target gene transcription elongation.
(A) Global analysis of the RBPJ landscape reveals that RBPJ binds nearly exclusively to active promoters and enhancers. ChIP-seq was conducted in 3691 GSCs for both RBPJ and H3K27Ac, a histone mark of active promoters and enhancers. Binding heatmaps of RBPJ (red) and H3K27Ac (green) centered on the center of RBPJ binding sites. Nearly all RBPJ sites are surrounded by H3K27Ac. (B) RBPJ global localization. Active promoters and enhancers were called using H3K27Ac sites. H3K27Ac peaks within 1 kb upstream or downstream of a transcription start site of an expressed gene were considered active promoter sites. All other H3K27Ac sites were considered active enhancer sites. (C) 3691 BTICs cells were transfected with HA-RBPJ plasmid or control vector. Anti-HA immunoprecipitates were immunoblotted with either an anti-CDK9 or anti-HA antibody. Input controls were immunoblotted with indicated antibodies. (D) Aggregate plots of RBPJ and CDK9 ChIP-seq peak intensity centered on RBPJ-bound loci in BTICs. CDK9 ChIP-seq data from GSE51633. (E) Cross-linked chromatin was prepared from 3691 BTICs expressing shCONT, shRBPJ-1, and shRBPJ-2, and then immunoprecipitated with an anti-CDK9 antibody or IgG control, followed by qPCR using primers specific for FOXM1, CCNA2, and KRAS promoters. Knockdown of RBPJ significantly decreased CDK9 recruitment to relevant promoters (2-way ANOVA, *P < 0.05, **P < 0.01, n = 3). (F) Cross-linked chromatin was prepared from 3691 BTICs transduced with shCONT, shRBPJ-1, and shRBPJ-2, and then immunoprecipitated with an anti-POL2 antibody or IgG control followed by qPCR using primers specific for the indicated regions of FOXM1, CCNA2, and KRAS (2-way ANOVA, *P < 0.05, **P < 0.01, n = 3).
Figure 7
Figure 7. Targeting CDK9 decreases BTIC growth and self-renewal.
(A) Two BTIC models (3691, 4121) were transduced with shCONT or shCDK9 by lentivirus. Right: Decreased CDK9 levels were measured after shRNA transduction by immunoblotting. Left: Cellular proliferation was measured by CellTiter-Glo after shRNA transduction over a time course. (B) In vitro extreme limiting dilution assays demonstrated that shRNA-mediated knockdown of CDK9 in 2 BTIC models (3691 and 4121) decreased the frequency of tumorsphere formation. (C) 3691 and 4121 BTICs were transduced with shCONT or shCDK9 for 2 days. Total RNA was isolated and cDNA was synthesized by reverse transcription. mRNA levels of indicated genes were detected by qPCR (t test, *P < 0.05, **P < 0.01, n = 3). (D) 3691 and 4121 BTICs were treated with DMSO or two different CDK9 inhibitors, dinaciclib and LY2857785, over a concentration range. Cellular viability was tested at 48 hours. (E) Survival of immunocompromised mice bearing intracranial 3691 or 4121 BTICs transduced with shCONT or shCDK9 is displayed by the Kaplan-Meier method (log-rank analysis, **P < 0.01, n = 5). (F) Kaplan–Meier survival curves of immunocompromised mice bearing orthotopic 3691 BTICs. Seven days after tumor implantation, mice were treated with dinaciclib (30 mg/kg) or DMSO vehicle control for 2 weeks (3 times per week, **P < 0.01, n = 5).
Figure 8
Figure 8. c-MYC is an upstream inducer of RBPJ expression in BTICs.
(A) Cross-linked chromatin was prepared from 2 BTIC models (3691 and 4121) and then immunoprecipitated with an anti-MYC antibody or IgG control, followed by qPCR using primers specific for the RBPJ promoter. CCND2 was used as a positive control (t test, *P < 0.05, **P < 0.01, n = 3). (B) Lysates of 3691 and 4121 BTICs expressing shCONT, shMYC-1, or shMYC-2 were immunoblotted with the indicated antibodies. shRNA-mediated knockdown of MYC decreased RBPJ levels. (C) 3691 and 4121 non-BTICs were transduced with either MYC or vector control, and then lysates were prepared and immunoblotted with the indicated antibodies. MYC expression in non-BTICs induced increased RBPJ levels. (D) 3691 and 4121 BTICs were treated with the BET domain inhibitor, JQ1 (1 μM), or vehicle control (DMSO). Lysates were immunoblotted with the indicated antibodies. JQ1 treatment decreased MYC and RBPJ levels. (E) 3691 BTICs were treated with JQ1 (1 μM) or DMSO and cellular proliferation was measured sequentially with CellTiter-Glo. (F) Global analysis of the RBPJ landscape reveals that RBPJ binds nearly exclusively to active promoters and enhancers. Transcription factor motif enrichment analysis found that RBPJ binding sites were the most enriched transcription factor–binding motif found under RBPJ ChIP-seq peaks, followed by MYC binding motifs, suggesting an interaction between these two transcription factors. (G) An example of RBPJ binding at enhancers and promoters of OLIG2 and OLIG1. The bottom two rows demonstrate called promoters and enhancers.
Figure 9
Figure 9. RBPJ and CDK9 regulation informs patient prognosis.
(A and B) Relative mRNA expression levels of (A) RBPJ and (B) CDK9 in nontumor brain and glioblastoma were determined in TCGA data set. (C) Analysis of TCGA data indicates that non–G-CIMP glioblastoma (GBM) patients have much poorer survival (P < 0.0001 by log-rank analysis). (D) Analysis of TCGA data indicates that higher RBPJ mRNA expression informs poor prognosis of non–G-CIMP patients (P = 0.0483 by log-rank analysis). (E) Analysis of TCGA data indicates that higher CDK9 mRNA expression informs poor prognosis of non–G-CIMP patients (P = 0.0157 by log-rank analysis). (F) Pairwise correlation analysis of RBPJ and transcriptional elongation–related genes was performed in the TCGA glioblastoma data set. Plots indicate expression data from TCGA patients for indicated genes, and numbers represent correlation coefficient (r) values.

Comment in

References

    1. Stupp R, et al. Effects of radiotherapy with concomitant and adjuvant temozolomide versus radiotherapy alone on survival in glioblastoma in a randomised phase III study: 5-year analysis of the EORTC-NCIC trial. Lancet Oncol. 2009;10(5):459–466. doi: 10.1016/S1470-2045(09)70025-7. - DOI - PubMed
    1. Bao S, et al. Glioma stem cells promote radioresistance by preferential activation of the DNA damage response. Nature. 2006;444(7120):756–760. doi: 10.1038/nature05236. - DOI - PubMed
    1. Chen J, et al. A restricted cell population propagates glioblastoma growth after chemotherapy. Nature. 2012;488(7412):522–526. doi: 10.1038/nature11287. - DOI - PMC - PubMed
    1. Singh SK, et al. Identification of human brain tumour initiating cells. Nature. 2004;432(7015):396–401. doi: 10.1038/nature03128. - DOI - PubMed
    1. Doetsch F, Caille I, Lim DA, Garcia-Verdugo JM, Alvarez-Buylla A. Subventricular zone astrocytes are neural stem cells in the adult mammalian brain. Cell. 1999;97(6):703–716. doi: 10.1016/S0092-8674(00)80783-7. - DOI - PubMed

Publication types

MeSH terms

Substances