. 2016 Aug;19(8):1100-14.
doi: 10.1038/nn.4332. Epub 2016 Jun 20.

The mouse cortico-striatal projectome

Affiliations

The mouse cortico-striatal projectome

Houri Hintiryan et al. Nat Neurosci. 2016 Aug.

Abstract

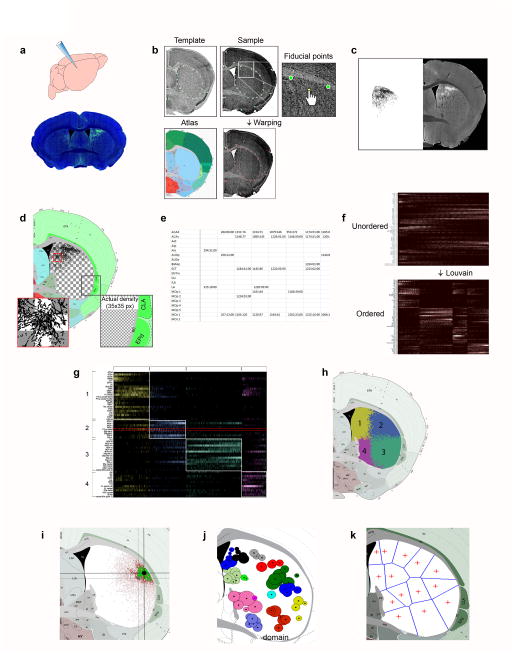
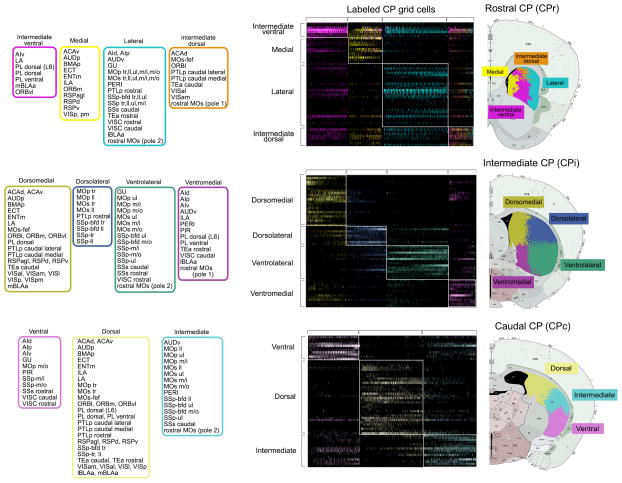
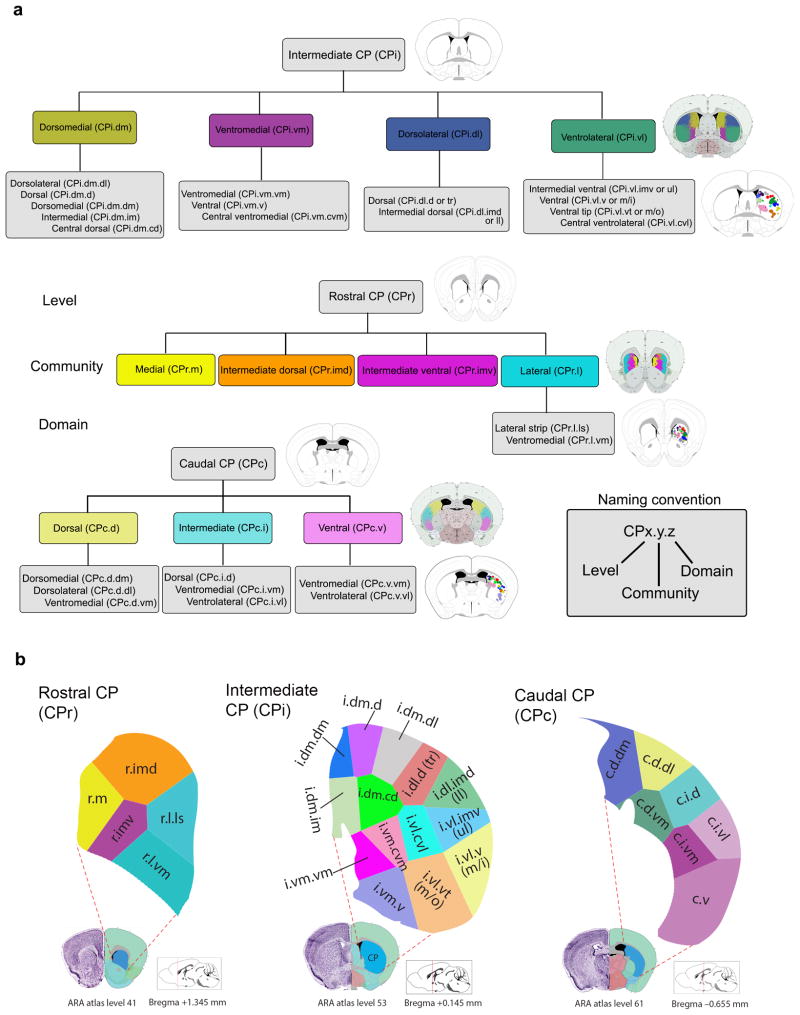
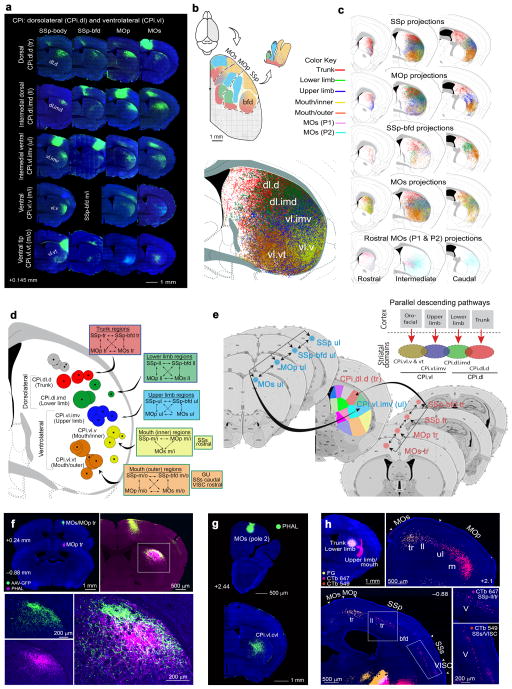
Different cortical areas are organized into distinct intracortical subnetworks. The manner in which descending pathways from the entire cortex interact subcortically as a network remains unclear. We developed an open-access comprehensive mesoscale mouse cortico-striatal projectome: a detailed connectivity projection map from the entire cerebral cortex to the dorsal striatum or caudoputamen (CP) in rodents. On the basis of these projections, we used new computational neuroanatomical tools to identify 29 distinct functional striatal domains. Furthermore, we characterized different cortico-striatal networks and how they reconfigure across the rostral-caudal extent of the CP. The workflow was also applied to select cortico-striatal connections in two different mouse models of disconnection syndromes to demonstrate its utility for characterizing circuitry-specific connectopathies. Together, our results provide the structural basis for studying the functional diversity of the dorsal striatum and disruptions of cortico-basal ganglia networks across a broad range of disorders.


Conflict of interest statement

COMPETING FINANCIAL INTERESTS

The authors declare no competing financial interests.

Figures

Fig. 1
Fig. 1. Data production and informatics workflow
Discrete anterograde tracer injections were made (a) and photomicrographs of the Nissl and tracer-labeled pathways were acquired. (b) Images were imported into an in-house software for warping. Fiducial markers were placed on the Nissl image of the sample to be warped, such that they matched the marker pattern of the corresponding atlas Nissl image. The sample was then deformably warped. (c) The warped PHAL channel was segmented and binarized, yielding a monochromatic image of axonal labeling. (d) The segmented image was superimposed onto its corresponding atlas level, within which the CP was divided into grid cells. Superimposed axons within each grid cell were quantified. (e) The quantified labeling for each injection was compiled into a spreadsheet and (f, top) the data expressed in a matrix with cortical areas along the y-axis and cells of the grid along the x-axis. (f, bottom) A community detection algorithm was utilized to group cortical areas projecting to a common set of cells. The matrix was reordered and color-coded (g) according to community structure. Cells boxed in red depict quantification of segmented image in c. (h) The grid cells were recolored to visualize, within the CP, the spatial arrangement of the communities to which they belong. (i) Communities were subdivided into domains using the centroid, or center of gravity, of each terminal field. The original labeling is shown in red and labeling after 95% cutoff, which was used for centroid generation, is shown in green. (j) Axonal fields within a community whose centroids were closely spaced defined a domain. (k) Using intensity weighted centroids as seed points, the CP was parcellated into Voronoi cells demonstrating the relative domain boundaries.
Fig. 2
Fig. 2. Visualization of CP communities and domains
Matrices that visualize the CP communities across the CPr (top), CPi (middle), and CPc (bottom). Matrices show cortical injections along the y-axis and labeled CP cells along the x-axis. For visualization, matrices were reordered and color coded according to community structure. Corresponding color-coded CP illustrates the spatial arrangement of communities within dorsal striatum. Community color assignments across the CP were coordinated to reflect general projection trends of communities across the structure. For example, projections terminating in the dorsomedial community of the CPi (represented in mustard yellow) generally terminate in the medial community of the CPr (bright yellow) and the dorsal community of the CPc (pastel yellow). Constituents of each community are listed to the left in corresponding color-coded boxes. Cortical area abbreviations: ACAd, Anterior cingulate area, dorsal; ACAv, Anterior cingulate area, ventral; AId, Agranular insular area, dorsal; AIp, Agranular insular area, posterior; AIv, Agranular insular area, ventral; AUDd, Auditory area, dorsal; AUDp, Primary auditory area; AUDv, Primary auditory area, ventral; ECT, Ectorhinal area; ENTl, Entorhinal area, lateral; ENTm, Entorhinal area, medial; GU, Gustatory area; ILA, Infralimbic area; MOp, Primary motor area; MOp tr, MOp trunk; MOp ll, MOp lower limb; MOp ul, MOp upper limb; MOp m/i, MOp inner mouth; MOp m/o, MOp outer mouth; MOs, Secondary motor area; MOs tr, MOs trunk; MOs ll, MOs lower limb; MOs ul, MOs upper limb; MOs m/i, MOs inner mouth; MOs m/o, MOs outer mouth; MOs-fef, MOs frontal eye field; ORBl, Orbitofrontal area, lateral; ORBm, Orbitofrontal area, medial; ORBvl, Orbitofrontal area, ventrolateral; PERI, Perirhinal area; PIR, Piriform cortex; PL, Prelimbic area; PL dorsal (L6), Layer 6 of dorsal PL; PTLp, Posterior parietal association area; Rostral MOs (P1), rostral MOs pole 1; Rostral MOs (P2), rostral MOs pole 2; RSPagl, Retrosplenial area, agranular; RSPd, Retrosplenial area, dorsal; RSPv, Retrosplenial area, ventral; SUBd, Subiculum, dorsal; SSp, Primary somatosensory area; SSp-tr, SSp trunk; SSp-ll, SSp lower limb; SSp-ul, SSp upper limb; SSp-m/i, SSp inner mouth; SSp-m/o, SSp outer mouth; SSp-bfd, SSp barrel field; SSp-bfd tr, SSp-bfd trunk; SSp-bfd ll, SSp-bfd lower limb; SSp-bfd ul, SSp-bfd upper limb; SSp-bfd m/o, SSp-bfd outer mouth; TEa, Temporal association area; VISal, Visual area, anterolateral; VISam, Visual area, anteromedial; VISl, Visual area, lateral; VISp, Primary visual area; VISpl, Visual area, posterior lateral; VISpm, Visual area, posterior medial; VISC, Visceral area.
Fig. 3
Fig. 3. Summary of community and domain nomenclature and CP domain parcellations
(a) Summary of communities and domains for the rostral, intermediate, and caudal CP are presented in a hierarchical tree. The nomenclature follows the CPx.y.z convention where x denotes the level (rostral, intermediate, or caudal), y the community, and z the domain. (b) Overview of connectivity-based CP domains defined with Voronoi parcellation. A total of 29 functional domains were identified in the rostral (CPr, left), intermediate (CPi, middle), and caudal (CPc, right) levels of the CP. Three domains that were identified based primarily from manual inspection of the data are not shown: the CPc.vl and CPc.v.vm, which are part of the CPc.v and the CPc.ext located at the tail end of the CP.
Fig. 4
Fig. 4. Somatotopic map of cortico-striatal projections to the CPi
(a) Raw data showing somatic sensorimotor areas topographically projecting to different domains within the CPi.dl and CPi.vl communities. Each sensorimotor cortical area representing a unique body region sends converging input to their corresponding CP domain. (b) Dorsal view of the somatic sensorimotor cortical map color coded according to their domains (modified from ) and maximum projection of their CP termination fields (bottom) showing distinct, partially overlapping domains. (c) Map depicting connections from body specific regions within SSp (row 1), MOp (row 2), SSp-bfd (row 3), and MOs (row 4) to CP, illustrating dorsal-ventral representation of trunk, lower limb, upper limb, inner mouth, and outer mouth observed in a. The map also demonstrates general trend of projections across the rostrocaudal CP. (d) Centroids of cortical areas grouped into CPi.dl and CPi.vl communities. Centroids of body specific SSp, SSp-bfd, MOp, and MOs topographically arrange and subdivide communities into domains. Importantly, centroids align with the raw data in a and reconstructions in c. PTLp rostral was grouped into the CPi.dl community. However, according to its centroid (denoted with *) and raw data (Supplementary Fig. 6d), it more appropriately grouped with structures in a dorsomedial domain. Cortical areas projecting to each domain are listed in boxes color coordinated with centroids (box stroke color denotes community). (e) Illustration of 5 parallel, relatively segregated somatic sensorimotor striatal networks. All SS and MO nodes within each subnetwork dedicated to a specific body region reciprocally connect (Supplementary Fig. 5e and ) and send converging projections to CPi domain representing their corresponding body region. (f) Interdigitation of projection terminals within CPi trunk domain (CPi.dl.d) demonstrated by double anterograde injections MOs/MOp trunk regions. (g) Projections from rostral MOs (pole 2) arborize in the central CP, avoiding the periphery. (h) FG, CTb 647 and 549 injected in trunk, lower limb, and upper limb/mouth CP domains retrogradely label layer V CP-projecting cortical neurons in their corresponding SSp and MOp body subregions as well as SSs and VISC.
Fig. 5
Fig. 5. Cortical projections to the dorsomedial and ventromedial CPi communities
(a) Dorsal and lateral views of cortical regions within the medial and lateral cortical subnetworks, respectively (modified from). Areas within the medial cortical subnetwork project to domains within dorsomedial CPi (CPi.dm), while those in the lateral cortical subnetwork project to ventromedial CPi (CPi.vm) domains. Colors of cortical areas denote domain assignments. Overlap of reconstructed pathways of areas projecting CPi.dm and CPi.vm highlights unique domains. (b) Triple anterograde tracer injections in VISam (AAV-RFP), ORBvl (PHAL), and PL (AAV-GFP) show relative boundaries of CPi.dm.d, CPi.dm.im, and CPi.dm.cd. (c) Double injections of BDA and PHAL in VISl and TEa show segregation of CPi.dm.dm and CPi.dm.im. (d) Raw data from representative cases of cortical areas projecting to CPi.vm illustrates the CPi.vm.vm and CPi.vm.v domains. ic, internal capsule. (e) Double injections of AAV-GFP (PTLp caudal medial) and PHAL (ACAd) highlight interdigitating boundary between CPi.dm.d and CPi.dm.dl. (f) Centroids of cortical areas projecting to CPi.dm and CPi.vm display high topography and identify domains. Cortical areas projecting to each domain are listed in a box that is color coordinated with the centroids (stroke color of box denotes community). The algorithm grouped LA with cortical structures projecting to the CPi.dm; however, its centroid (denoted with an *) placed it outside of the 5 domains of this community and into CPi.vm.vm. (g) Wiring schema depicts connections among cortical areas within the medial cortical subnetwork dedicated to transferring visual, auditory, and some somatosensory (trunk/lower limb) information to the ORBvl through interconnected nodes involving the VIS, ACA, RSP, PTLp, and AUD. Nodes within this subnetwork project to domains in the CPi.dm, forming a medial cortical-dorsomedial striatal network. Diagram also depicts the anterolateral cortical-ventromedial striatal subnetwork. The anterolateral cortical subnetwork (i.e., AI, GU, VISC, PIR) is heavily connected with PL and ILA. Downstream projections of each of these nodes generally target the domains of the CPi.vm.
Fig. 6
Fig. 6. Convergence and reconfiguration of cortico-striatal projections in CPr and CPc
(a) Map showing reconstructions of projections populated according to CPr domains (i.e., row 1 shows projections from all cortical areas that send input to CPr.l.ls; row 2 depicts projections from cortical areas to CPr.l.vm). Reconstructions demonstrate CPr domains (column 1) and show general trend of projections through CPi and CPc. For example, projections to lateral CPi tend to terminate in lateral CPr, while projections terminating in the medial CPi terminate in the medial CPr. (b) Map showing reconstructions of projections according to CPc communities and delineating the dorsal, intermediate, and ventral regions of CPc (column 3). The termination pattern of cortical areas clustered into these caudal communities across CPi and CPr are also depicted (i.e., projections terminating in dorsal CPi terminate in dorsal CPc, while those terminating in lateral CPi terminate in intermediate parts of CPc. (c) Raw data from representative cases showing projections to CPr.l.ls and CPr.l.vm. (d) FG and CTb 647 injections into the lateral strip (CPr.l.ls) and medial/intermediate ventral CP (CPr.m/CPr.imv), respectively validate cortical projections to those domains and communities. FG retrogradely labeled neurons in PL, ORBvl, LA, mBLAa, while CTb labeled neurons in MOs, SSp, SSs. Right panels show magnification of retrograde labeling. (e) Representative cases demonstrating raw labeling to domains within CPc.d. (f) GU injection reveals the ventrolateral domain of CPc.v (CPc.v.vl). Labeling in boxed region magnified at right. CEA, central amygdalar nucleus; GPe, globus pallidus external part; BLA, basolateral amygdalar nucleus, anterior part. (g) Injections in VISC caudal produce unique labeling in CPc.v.vm (magnified on right). An injection in the thalamus validates this CPc.v.vm domain. Thalamic injection validates the general projection trends observed across the rostral-caudal extent of the CP for ventral domains (i.e., tendency of projections to CPi.vm.v to terminate in ventral domains of CPr and CPc). Labeling in inset magnified at right.
Fig. 7
Fig. 7. Network reconfiguration across the CP
(a) A hypothetical functional model of the CP domains based on all cortical afference to specific domains identified across the CP. (b) Double anterograde injections of AAV-GFP in SSp-bfd mouth/SSs and PHAL in MOp ul show segregation of somatic sensorimotor projection terminals in their corresponding domains in the CPi and CPc and intermixing of their axons in CPr, demonstrating reconfiguration of these subnetworks across the CP. (c) Schematic representation of subnetwork reorganization across the CP. Although relatively segregated in CPi, all sensorimotor subnetworks representing unique body information send converging inputs to a single domain in the CPr. At the CPc, inputs from the somatic sensorimotor nodes terminate in the same community as inputs from the medial (dorsal CPc) and lateral (ventral CPc) subnetworks providing greater opportunity for interaction across different subnetworks. (d) AUDp projections produce a unique dense terminal field in caudal parts of the CP, where projections from most cortical areas is absent (top panel, left). AUD projections to this domain, termed the caudal extreme (CPc.ext), were validated with a CTb injection, which retrogradely labeled neurons in AUDv (top panel, right). Bottom panels are magnified images of boxed region showing dense topographic projections from AUDp and TEa in the CPc.ext. CEA, central amygdalar nucleus; BLAa, basolateral amygdalar nucleus, anterior part. (e) FG and CTb 647 tracer injections in the dorsal and ventral CPc substantiate the cortical projections from ACA, MOs-fef, RSP, VIS, and ECT to CPc.d and from SSp-m to CPc.v. Right panels show magnified images of labeling. (f) Projections from ENTl to CPr, CPi, and CPc. Note the broad projections spanning across all CPi.dm and CPi.vm domains in CPi.
Fig. 8
Fig. 8. Domain-specific pathological connections in zQ175 and MAO A/B KO mice
(a) Boxplot showing domain specific loss of signal intensity from the MOs upper limb in zQ175 mice compared to wild type (WT) littermates in ipsilateral CP (zQ175, n=13; WT, n=15). Boxes depict the range between the upper and lower quartiles, whiskers depict the maximum and minimum values, and the bar indicates the median value. Red denotes domains within which connections were affected. [Domain, Mean/SEM zQ175 or MAO group, Mean/SEM WT group, P value, t value, degrees of freedom: i.vl.imv (ul), 12740/1926, 20560/2822, 0.031, 2.289, 24; i.dl.imd (ll), 1205/379, 2269/653, 0.173, 1.410, 22; i.dl.d (tr), 2370/453, 4494/1067, 0.084, 1.832, 18; i.dm.d, 65.16/38.17, 181.7/98.30, 0.2846, 1.103, 18; i.dm.im, 156.9/79.37, 147.5/93.66, 0.940, 0.0767, 25; i.dm.cd, 6427/1087, 10990/1700, 0.034, 2.260, 23; i.dm.dm, 46.73,/42.48, 79.25/56.45, 0.649, 0.460, 24; i.vm.vm, 538.4/227.4, 889.1/225.8, 0.284, 1.094, 25; i.vm.v, 1114/336, 10990/1700, 0.048, 2.122, 18; i.vm.cvm, 1804/671.4, 4036/869.8, 0.0504, 2.056, 25; i.vl.v, 9269/1850, 14390/2295, 0.095, 1.738, 25; i.vl.vt (m/o), 6964/1192, 14890/2787, 0.018, 2.615, 18; i.vl.cvl, 6770/1216, 13890/2376, 0.015, 2.668, 20]. (b,e) Pixelgrams illustrating differences in signal intensity detected between zQ175 and MAO A/B KO mice and their WT littermates within each 35x35 pixel cell. Red denotes a reduction in signal compared to WT, while blue indicates an increase. Saturation of color scales with percent change. (c) Visualization of the bar graphs showing domain-specific signal intensity reductions from MOs upper limb and ORBvl in zQ175 (left) and MAO A/B KO (right) mice, respectively. (d) Boxplots showing domain specific loss of signal intensity from the ORBvl in MAO A/B KO mice compared to WT in ipsilateral (left) and contralateral (right) CP (MAO A/B, n=10; WT, n=6). Only domains within which significant changes were detected are shown. [Ipsilateral CPi: i.vl.imv (ul), 22.11,/10.43, 164.2/37.29, 0.014, 3.670, 5; i.dl.imd (ll), 730.9/182.6, 3771/1576, 0.114, 1.916, 5; i.dl.d (tr), 149/35.35, 649.9/190.5, 0.049, 2.585, 5; i.dm.d, 3460/1297, 7171/2416, 0.218, 1.353, 7; i.dm.dl, 199.6/50.78, 652.6/154.6, 0.032, 2.780, 6; i.dm.im, 10650/2879, 23640/13100, 0.377, 0.9683, 5; i.dm.cd, 736.3/175.3, 1953/313.6, 0.010, 3.386, 8; i.dm.dm, 1336/551.3, 3036/1590, 0.351, 1.011, 6; i.vm.vm, 17010/5028, 30220/11120, 0.315, 1.083, 7; i.vm.v, 10400/2930, 24090/6629, 0.108, 1.888, 6; i.vm.cvm, 513.4/144.1, 1425/285.6, 0.025, 2.848, 7; i.vl.v (m/i), 1933/728, 3535/1214, 0.290, 1.132, 8; i.vl.vt (m/o), 4556/1233, 8541/1663, 0.083, 1.925, 10; i.vl.cvl, 158.7/42.76, 935.6/255.8, 0.030, 2.996, 5; Contralateral CPi: i.vl.imv (ul), 9.934/4.762, 66.22/14.83, 0.011, 3.614, 6; i.dl.imd (ll), 9.880/4.902, 98.34/24.94, 0.018, 3.481, 5; i.dl.d (tr), 79.11/26.30, 617.5/175.1, 0.029, 2.935, 7; i.dm.dl, 68.73/25.66, 520.9/109.8, 0.010, 4.012, 5; i.dm.im, 9358/4310, 19100/7382, 0.287, 1.140, 8; i.dm.cd, 502.6/148.4, 2242/587.3, 0.035, 2.871, 5; i.dm.dm, 271.7/184.3, 1686/890.8, 0.181, 1.555, 5; i.vm.vm, 11210/3949, 26130/5758, 0.061, 2.138, 9; i.vm.v, 7857/2429, 9863/2260, 0.556, 0.6049, 13; i.vm.cvm, 444.8/94.5, 1549/429.5, 0.049, 2.512, 5; i.vl.v (m/i), 272.2/145.1, 1145/371, 0.071, 2.192, 6; i.vl.vt (m/o), 2499/944.1, 3170/759.2, 0.589, 0.5539, 13; i.vl.cvl, 110.6/29.52, 782.3/246.2, 0.042, 2.708, 5]. (f) Boxplots of differences in the span of MOs upper limb and ORBvl projection fields within the CP in zQ175 and MAO A/B KO mice compared to WT. [MOs ul: 5348/288.9, 5654/250.8, 0.432, 0.7991, 24; ORBvl: 1425/177.1, 2715/494, 0.049, 2.459, 6]. (g) Boxplots showing the reduction in signal intensity in the entire ipsilateral CP from the MOs upper limb (left) and ORBvl (right) in zQ175 and MAO A/B mice, respectively. [MOs ul: 57120/9124, 90420/12830, 0.045, 2.115, 24; ORBvl: 3799/842.1, 9372/1764, 0.006, 3.221, 14]. * denotes significant difference (P<0.05) detected by two-tailed t test with Welch’s correction. Intensity is measured as total number of labeled pixels. Span is measured as total number of labeled cells.

Similar articles

Cited by

References

    1. Zingg B, et al. Neural networks of the mouse neocortex. Cell. 2014;156:1096–1111. - PMC - PubMed
    1. Oh SW, et al. A mesoscale connectome of the mouse brain. Nature. 2014;508:207–214. - PMC - PubMed
    1. Bota M, Sporns O, Swanson LW. Architecture of the cerebral cortical association connectome underlying cognition. Proc Natl Acad Sci U S A. 2015;112:E2093–2101. - PMC - PubMed
    1. Song HF, Kennedy H, Wang XJ. Spatial embedding of structural similarity in the cerebral cortex. Proc Natl Acad Sci U S A. 2014;111:16580–16585. - PMC - PubMed
    1. Alexander GE, DeLong MR, Strick PL. Parallel organization of functionally segregated circuits linking basal ganglia and cortex. Annu Rev Neurosci. 1986;9:357–381. - PubMed

Publication types

LinkOut - more resources