. 2016 Aug;19(8):1085-92.
doi: 10.1038/nn.4328. Epub 2016 Jun 20.

Neuronal activity enhances tau propagation and tau pathology in vivo

Affiliations

Neuronal activity enhances tau propagation and tau pathology in vivo

Jessica W Wu et al. Nat Neurosci. 2016 Aug.

Abstract

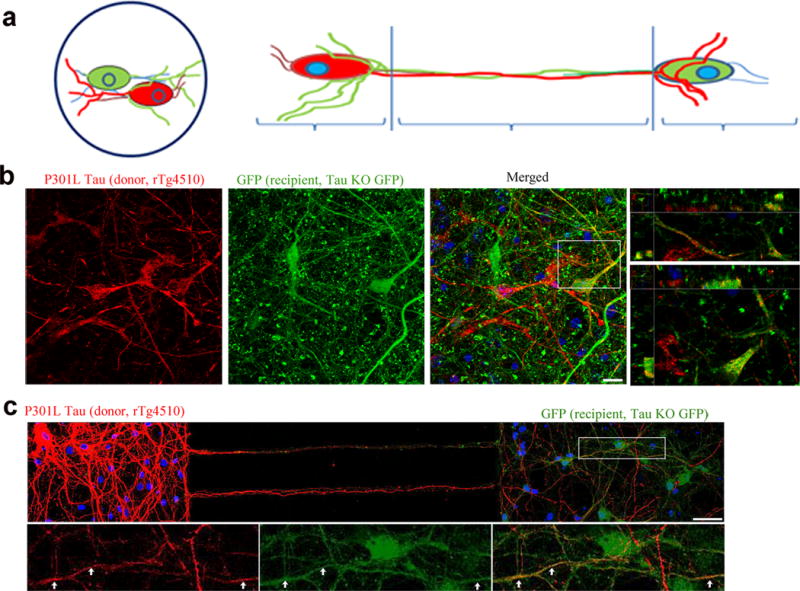
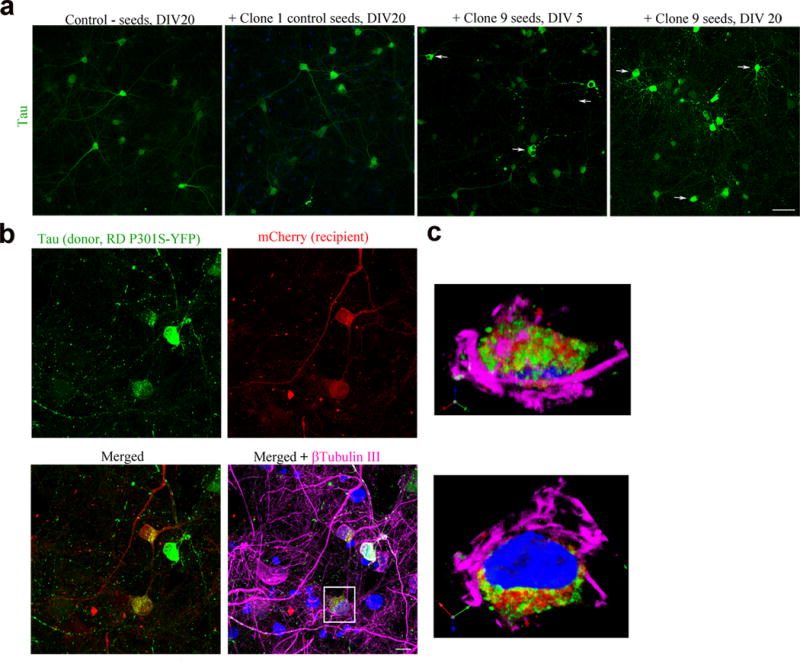
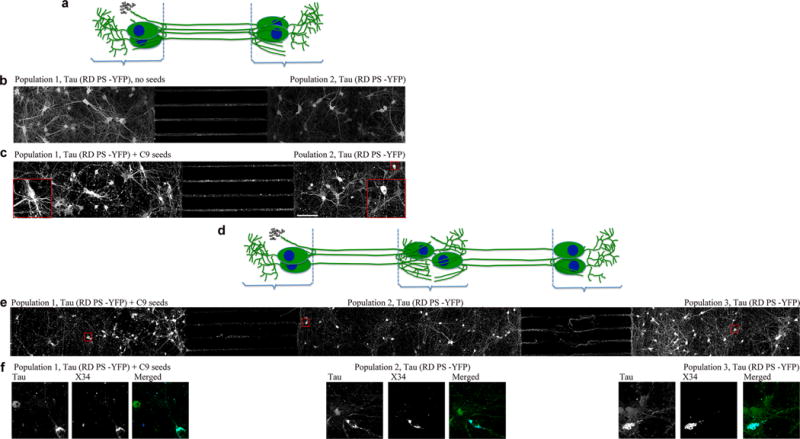
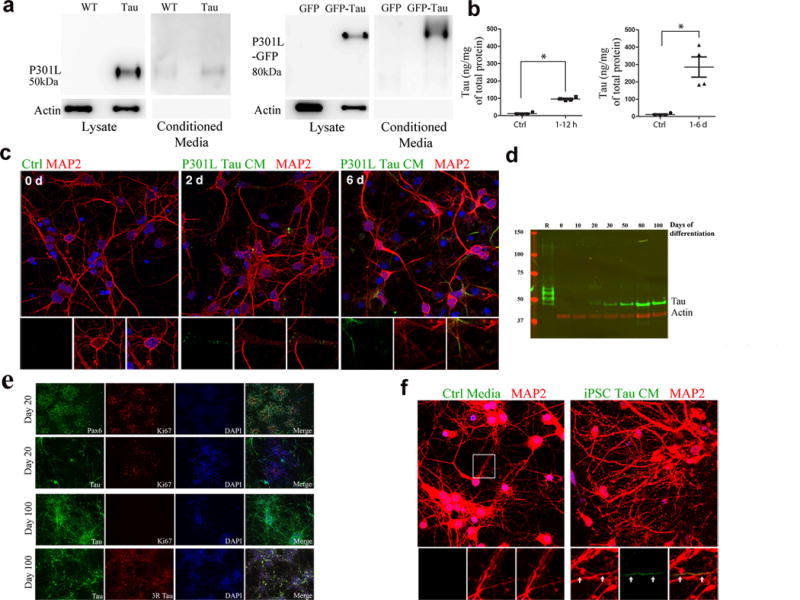
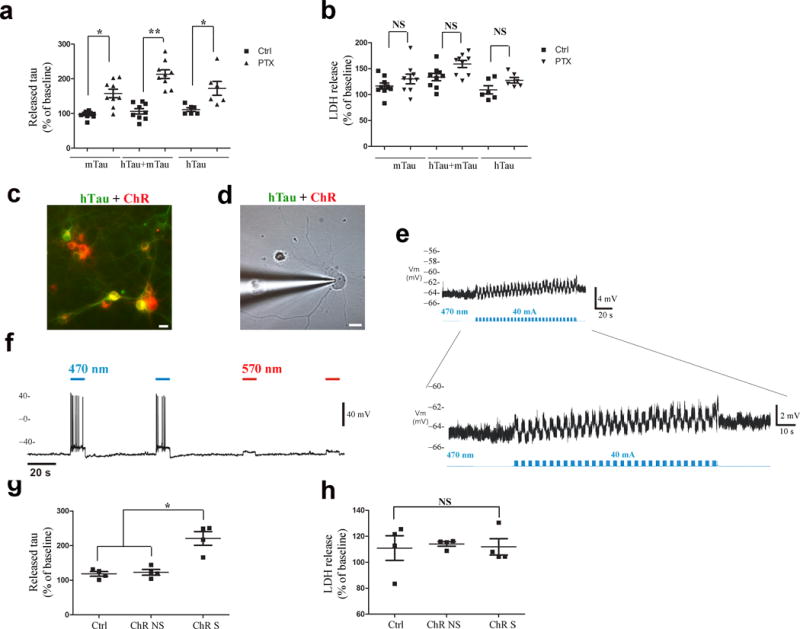
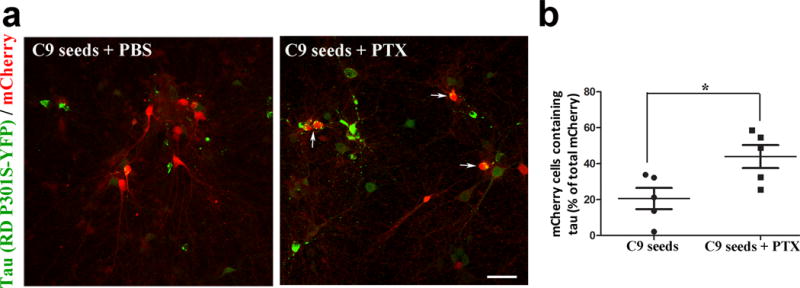
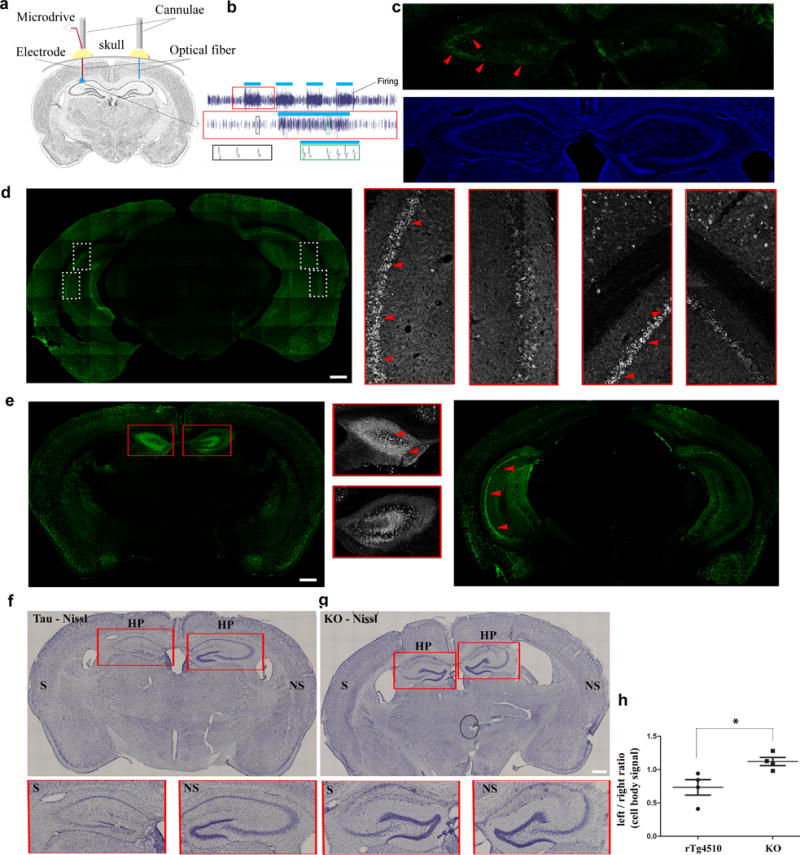
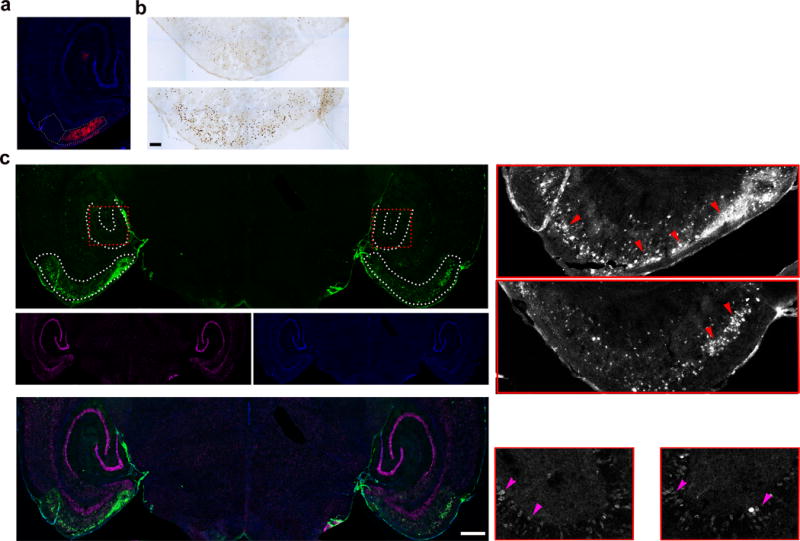
Tau protein can transfer between neurons transneuronally and trans-synaptically, which is thought to explain the progressive spread of tauopathy observed in the brain of patients with Alzheimer's disease. Here we show that physiological tau released from donor cells can transfer to recipient cells via the medium, suggesting that at least one mechanism by which tau can transfer is via the extracellular space. Neuronal activity has been shown to regulate tau secretion, but its effect on tau pathology is unknown. Using optogenetic and chemogenetic approaches, we found that increased neuronal activity stimulates the release of tau in vitro and enhances tau pathology in vivo. These data have implications for disease pathogenesis and therapeutic strategies for Alzheimer's disease and other tauopathies.


Conflict of interest statement

Competing Financial Interests

The authors declare no competing financial interests.

Figures

Figure 1
Figure 1
Endogenously generated human tau can transfer from cell to cell. (a) Cartoon model showing co-cultures of neurons on coverslips and in microfluidic chamber devices. Co-cultures of mutant hTau-expressing (red, from rTg4510 line, cell A) and recipient KO neurons (green, from KO line, cells B, C). (b) hTau in recipient KO cell (cell C, yellow) on coverslip and (c) in MFs (yellow, arrows). Scale bars, 10 and 50 μm, respectively. Images are representative of four neuronal cultures.
Figure 2
Figure 2
Endogenously generated human tau aggregates can transfer from cell to cell. (a) Tau repeat domain-expressing neurons (hTau RD P301S-YFP, green) do not readily form aggregates when exposed to PBS or clone 1 lysate after 20 DIV. Clone 9 lysate seeded tau cells start forming aggregates (arrow) at 5 DIV and increase after 20 DIV. Scale bar, 50 μm. (b) Seeded tau RD aggregates (green) transferred to recipient cells (mCherry, red) (cell A, B, yellow). Scale bar, 10 μm. (c) Enlarged orthogonal view of cell A showing transferred tau in the cytoplasm of the cell. Images are representative of four neuronal cultures.
Figure 3
Figure 3
Seed-induced tau pathology propagates from cell to cell. (a) Cartoon model showing co-cultures in microfluidic devices with two chambers. (b) Unseeded tau-expressing cells (population 1, 2) grown in bipartite chamber device do not form visible aggregates. (c) Seeding population 1 with clone 9 lysate triggered endogenous tau to form aggregates in population 1 and population 2. Images are representative of three cultures. (d) Cartoon model showing co-cultures in microfluidic devices with three chambers. (e) Pathology propagated from population 1 cells to population 3 cells grown in tripartite chambers. Scale bars, 100 μm. Enlarged images show tau aggregate-containing neurons in population 1, 2 and 3. Images are representative of two cultures. (f) Tau aggregate-containing neurons from populations 1, 2, and 3 stained with X-34.
Figure 4
Figure 4
Tau from mouse primary neurons and human iPSCs can transfer via the extracellular medium (a) Lysate from rTg4510 primary neurons and P301L-GFP transduced neurons, and conditioned media from the same cells, labeled with TauC (full-length blots shown in Supplementary Figure 4). Actin shows equal amounts of protein loaded. (Full-length blots shown in Supplementary Figure 4.) (b) ELISA using tau-specific antibodies showing uptake of tau from media by tau-KO cells. Compared to controls (n = 4 cultures), tau was significantly higher in neurons after 1–6 hours of incubation with tau-conditioned media (n = 6, z = −2.558, adjusted P = 0.021) (left), and also after 1–6 days of incubation (n = 4, z = −2.309, adjusted P = 0.042). (c) Neurons (wild-type), incubated with rTg4510 conditioned media for 2 and 6 days (d), labeled with anti-tau antibody (green) and anti-MAP2 (red). Insets show tau in cell bodies and neurites. (d) Total tau in human iPSC neuron lysates. Recombinant tau ladder (R) separates in the following order of decreasing molecular weight: 2N4R, 2N3R, 1N4R, 1N3R, 0N4R, 0N3R. The single tau band corresponds to the 0N3R isoform. (e) iPSC cultures immunolabeled with the early forebrain marker Pax6 and tau, which was only expressed in post-mitotic neurons. By day 100 of differentiation, the majority of the cells in culture were immunoreactive for total and 3R tau. Scale bar, 100. (f) Neurons (wild-type) treated for 6 d with tau conditioned media collected from iPSC neurons, stained with antibodies (anti-tau, green, anti-MAP2, red) and DAPI (blue). Enlarged insets show tau (green) accumulating inside neurites (yellow). Scale bar, 10 μm.
Figure 5
Figure 5
Tau release is enhanced by stimulating neuronal activity. (a) Sandwich ELISA showed that tau is released into the media from cultured cells (mTau, n = 9 cultures per treatment group; hTau + mTau, n = 9 cultures per treatment group; hTau, human and iPSC neurons, n = 6 cultures per treatment group), when treated with picrotoxin for 30 min. Raw data was normalized to baseline levels for each cell population, and plotted as the percent change. A significant difference was observed between treated and untreated groups for each model: mTau t(9.167) = −4.75, Bonferroni adjusted P =0.003; hTau + mTau t(16) = −7.25, adjusted P < 0.0001; hTau t(10) = −2.95, adjusted P = 0.044. (b) No significant difference was observed between treated and untreated groups in LDH release. Group n’s were as above. P values from adjusted t-tests = 0.73, 0.061, and 0.233. (c) Transduced neurons co-express both tau (green) and ChR2 (red). (d) Tau and ChR2-expressing neuron was patch-recorded and (e) exhibited ~5 mV depolarization of membrane potential (RMP) with light stimulation at 30 Hz. (f) Light at 470 nm, but not 570 nm caused a 12mV depolarization in ChR2-cells. (g) Significant difference in tau released after stimulation (30 min) (n = 4 cultures per condition) (Kruskal-Wallis χ2(2) = 7.42, P = 0.024) with significantly higher tau in stimulated cells compared to non-stimulated (adjusted P = 0.036) and control neurons (adjusted P = 0.021). (h) LDH release measured before and after treatment did not differ significantly χ2(2) = 0.731, P = 0.694 (n = 4 cultures per condition).
Figure 6
Figure 6
Transfer of tau from cell to cell is enhanced by stimulating neuronal activity. (a) Images showing tau protein (green) from tau-expressing donor cells in recipient mCherry cells (red) (merged in yellow) seeded with clone 9 lysate. Data shows cells without, and with picrotoxin (+PTX) stimulation. Scale bar, 50 μm. (b) Tau transfer, as determined by the number of mCherry cells containing tau, as a percentage of the total number of mCherry cells, was significantly higher in the stimulated group (n = 5) compared to the unstimulated group (n = 5); t(8)= −2.68, P = 0.028.
Figure 7
Figure 7
Increased neuronal activity induced optogenetically exacerbates tau pathology in the hippocampus. (a) In vivo optogenetic stimulation: Cartoon shows the experimental setup. Tau expressing mice (rTg4510) were injected with ChR2 expressing vector and implanted with optical fibers in both hemispheres; in some mice a recording electrode was also inserted in one or both hemispheres. (b) Extracellular recordings show that pulses of blue light (blue bars) increased the firing activity consistently. The same neurons could be recorded longitudinally demonstrating that chronic, repetitive stimulation did not impact cell viability. Red boxed inset: zoom-in of stimulation #15. Bottom row: example waveforms from stimulated (green inset) vs. unstimulated (black inset) neurons. (c) Representative image of c-Fos immunostaining (d) Brain tissues of stimulated mice labeled with anti-tau antibody (TauY9, green) Scale bar, 500 μm. n = 2 mice. White boxed inset: enlargements of CA1 and 3. (e) Posterior and anterior tissues labeled with anti-tau antibody (CP27, green) shows more tau pathology (arrows, red) in the stimulated side. Red boxed inset: enlargements of anterior hippocampus. (f, g) Nissl stain of brain tissues of stimulated tau mouse and tau-KO (KO-GFP line) shows reduced cell body staining, especially in the hippocampus. Scale bar, 500 μm. n = 4 mice for each line. (h) Assessment of Nissl stain signal of hippocampal pyramidal cell layers shows significant reduction in the stimulated hemisphere of the tau mice (n = 4) but not the tau-KO mice (n = 4 mice, z = 2.31, P = 0.021). S = stimulated hemisphere, NS = non-stimulated hemisphere.
Figure 8
Figure 8
Increased neuronal activity induced chemogenetically accelerates tau pathology in the EC. (a) CaMKIIa-hM3D(Gq)-mCherry (red) was injected and expressed in the MEC of the left hemisphere of EC-Tau mice. (b) Representative image of c-Fos immunostaining. Scale bar, 100 μm. (c) Representative image of brain tissues of mice stimulated for six weeks labeled with an antibody against pathological human tau (MC1, green), anti-NeuN (magenta) and DAPI (blue). Inset: Enlarged images from the entorhinal cortex (EC) and the dentate gyrus (DG) of stimulated and non-stimulated hemispheres. Red arrows, somatodendritic tau in neurons of the EC. Magenta arrows, tau in granule cells of the DG. DAPI (blue). Scale bar, 500 μm, n = 3 mice. S = stimulated hemisphere. NS = non-stimulated hemisphere.

References

    1. Braak H, Braak E. Neuropathological stageing of Alzheimer-related changes. Acta Neuropathol. 1991;82:239–259. - PubMed
    1. Liu L, et al. Trans-synaptic spread of tau pathology in vivo. PLoS One. 2012;7:e31302. doi: 10.1371/journal.pone.0031302. - DOI - PMC - PubMed
    1. de Calignon A, et al. Propagation of tau pathology in a model of early Alzheimer’s disease. Neuron. 2012;73:685–697. doi: 10.1016/j.neuron.2011.11.033. - DOI - PMC - PubMed
    1. Harris JA, et al. Human P301L-mutant tau expression in mouse entorhinal-hippocampal network causes tau aggregation and presynaptic pathology but no cognitive deficits. PLoS One. 2012;7:e45881. doi: 10.1371/journal.pone.0045881. - DOI - PMC - PubMed
    1. Clavaguera F, et al. Brain homogenates from human tauopathies induce tau inclusions in mouse brain. Proc Natl Acad Sci U S A. 2013;110:9535–9540. doi: 10.1073/pnas.1301175110. - DOI - PMC - PubMed

Publication types