. 2016 May:7:121-34.
doi: 10.1016/j.ebiom.2016.03.033. Epub 2016 Mar 28.

Mass Spectrometry Imaging Reveals Elevated Glomerular ATP/AMP in Diabetes/obesity and Identifies Sphingomyelin as a Possible Mediator

Affiliations

Mass Spectrometry Imaging Reveals Elevated Glomerular ATP/AMP in Diabetes/obesity and Identifies Sphingomyelin as a Possible Mediator

Satoshi Miyamoto et al. EBioMedicine. 2016 May.

Abstract

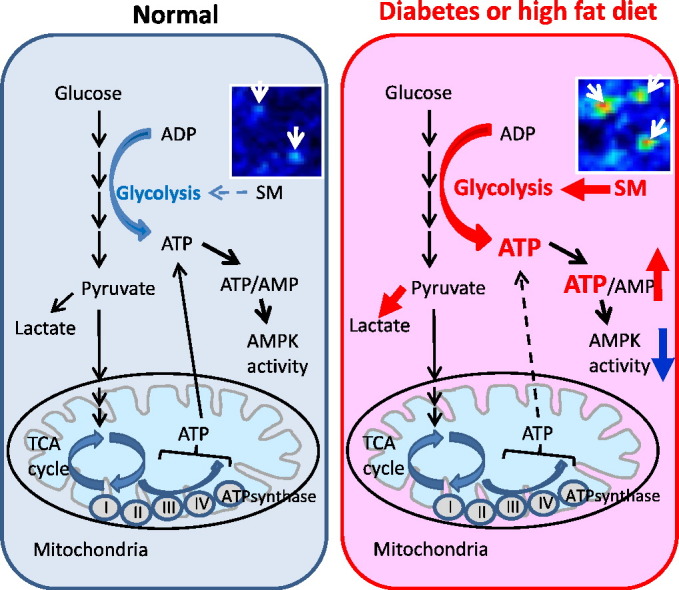
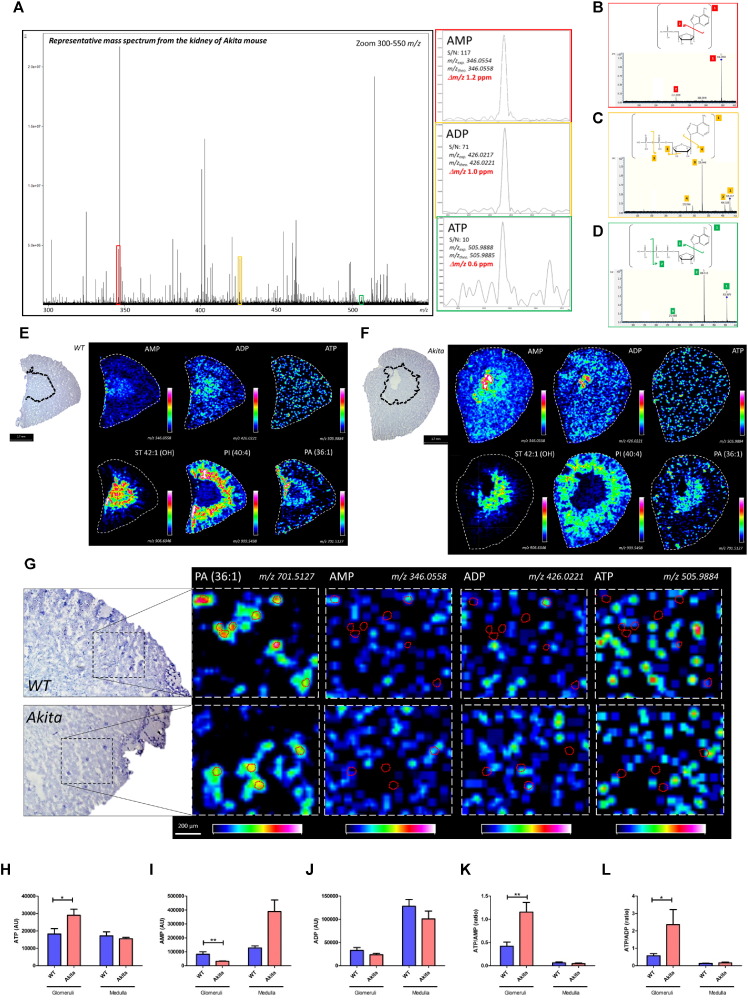
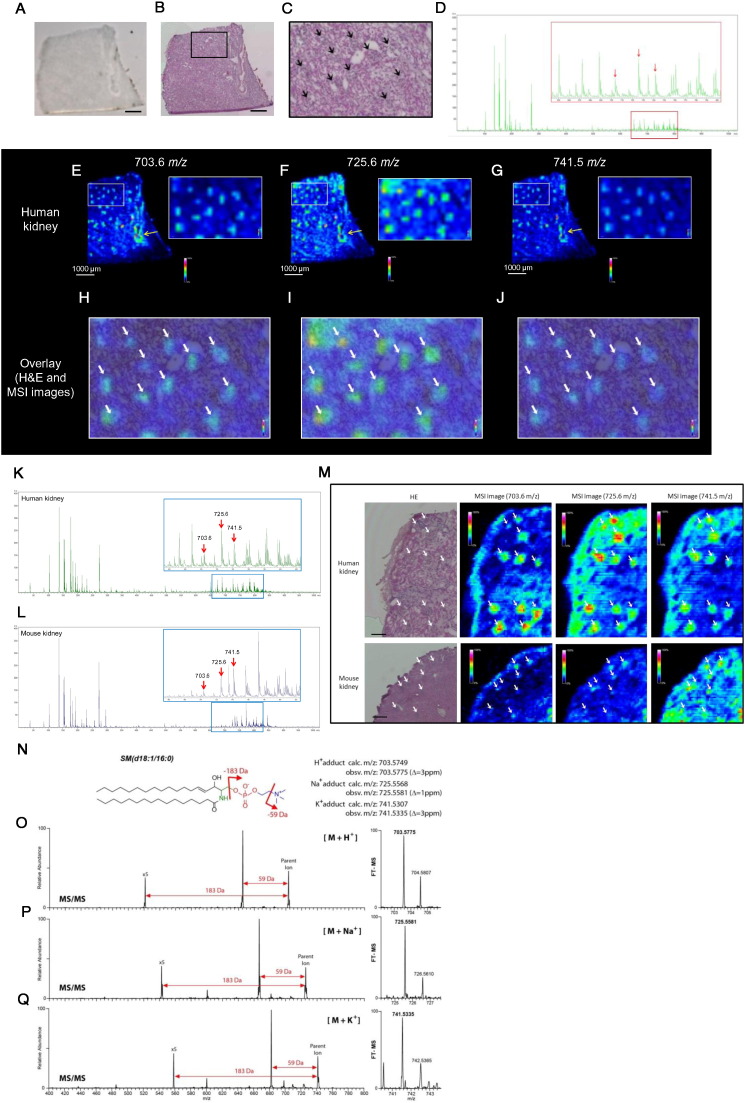
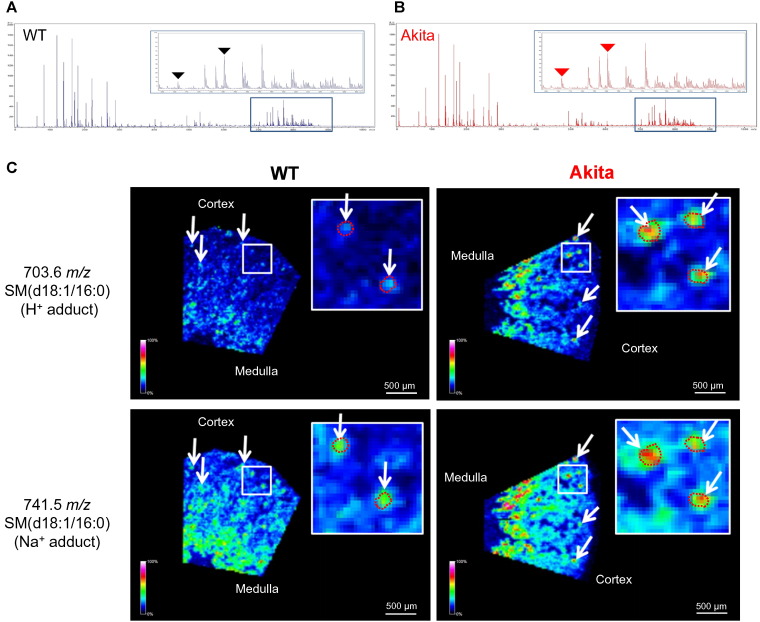
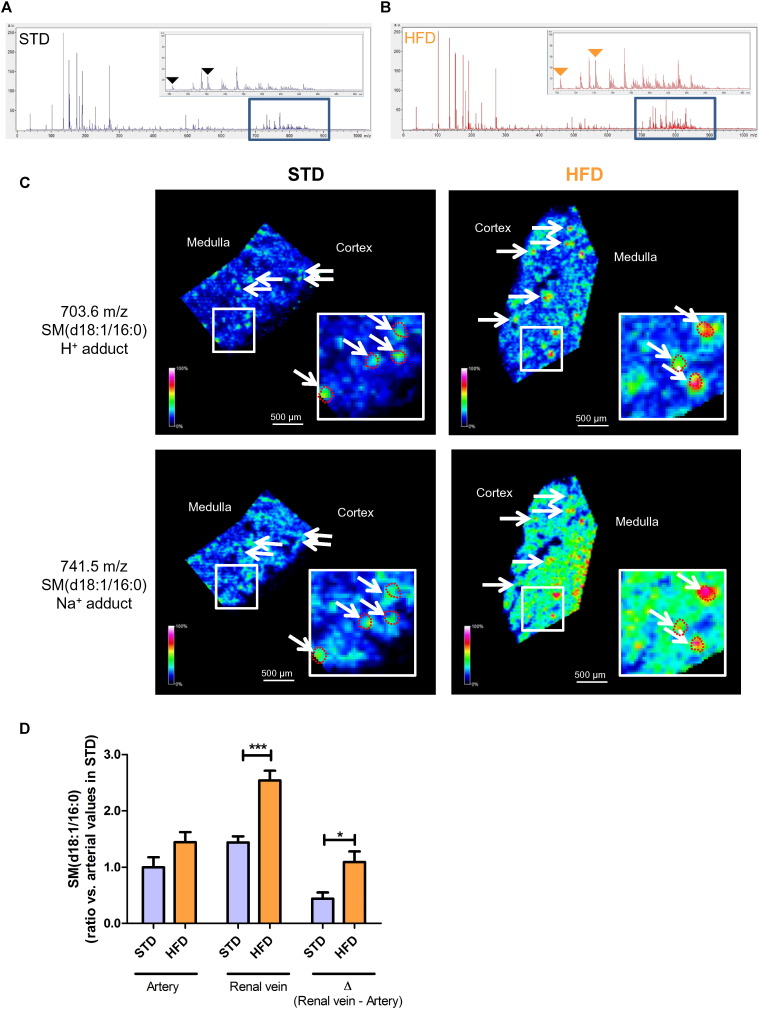
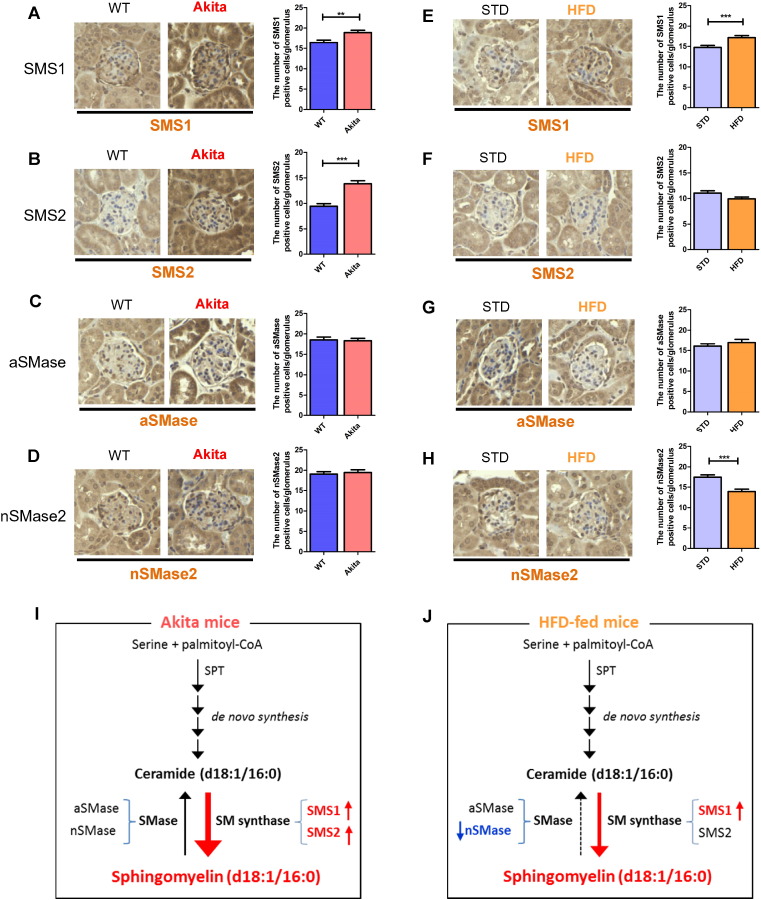
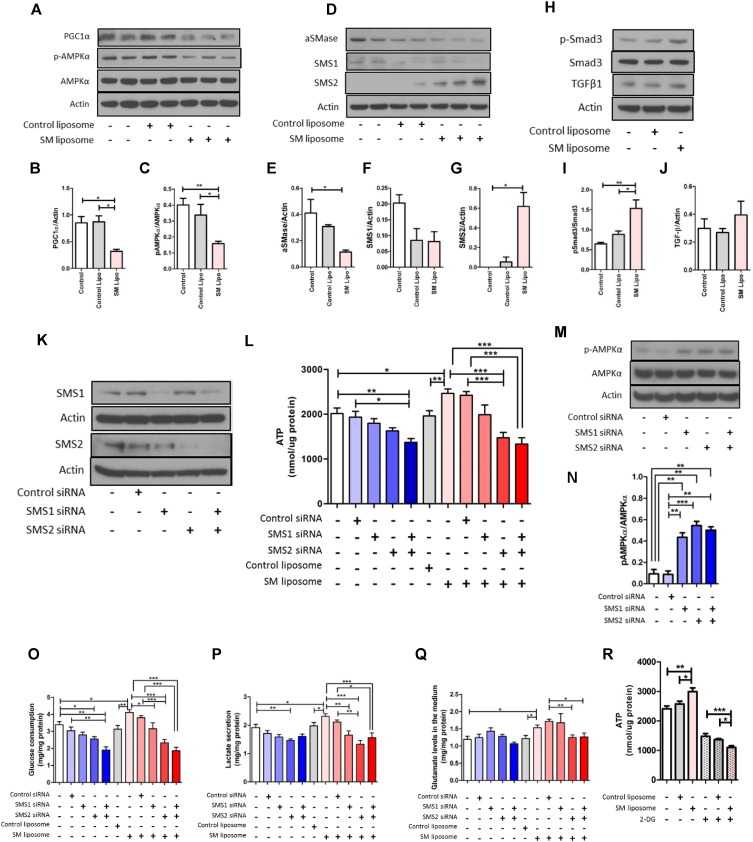
AMP-activated protein kinase (AMPK) is suppressed in diabetes and may be due to a high ATP/AMP ratio, however the quantitation of nucleotides in vivo has been extremely difficult. Via matrix-assisted laser desorption/ionization mass spectrometry imaging (MALDI-MSI) to localize renal nucleotides we found that the diabetic kidney had a significant increase in glomerular ATP/AMP ratio. Untargeted MALDI-MSI analysis revealed that a specific sphingomyelin species (SM(d18:1/16:0)) accumulated in the glomeruli of diabetic and high-fat diet-fed mice compared with wild-type controls. In vitro studies in mesangial cells revealed that exogenous addition of SM(d18:1/16:0) significantly elevated ATP via increased glucose consumption and lactate production with a consequent reduction of AMPK and PGC1α. Furthermore, inhibition of sphingomyelin synthases reversed these effects. Our findings suggest that AMPK is reduced in the diabetic kidney due to an increase in the ATP/AMP ratio and that SM(d18:1/16:0) could be responsible for the enhanced ATP production via activation of the glycolytic pathway.

Keywords: AMPK; ATP; Chronic kidney disease; Glycolysis; Matrix-assisted laser desorption/ionization mass spectrometry imaging; Sphingomyelin.


Figures

Image 1
Graphical abstract
Fig. 1
Fig. 1
Targeted FTICR-MALDI-MSI analysis reveals the increased ATP, ATP/AMP and ATP/ADP in the glomeruli of Akita mice. (A) Representative overall average MS1 spectrum of the kidney and AMP (red rectangle), ADP (yellow rectangle) and ATP (green rectangle)-related peaks. (B–D) Representative MS/MS spectra and chemical structures of AMP (B), ADP (C) and ATP (D). (E and F) Representative FTICR-MALDI-MSI images for AMP, ADP and ATP of WT (E) and Akita (F) mice at a spatial resolution of 70 μm. The distribution of sulfatide (ST 42:1(OH)), phosphatidylinositol (PI (40:4)) and phosphatidic acid (PA (36:1)) were used as contrast ions for medullary, cortical tubular and glomerular regions, respectively. Images on the left side shows representative images of PAS-stained kidney sections and the border between cortex and medulla is shown by dotted lines.(G) Representative FTICR-MALDI-MSI images for PA (36:1), AMP, ADP and ATP at a spatial resolution of 30 μm. Glomerular area was guided by PA (36:1) content and the outlines of glomeruli were shown by red dotted circles. Rainbow color scales was used. The white color represents the highest signal intensity (100%) and the black color represents the lowest signal (0%) of the particular ion. (H–L) Quantitative results for ATP (H), AMP (I), ADP (J), and ATP/AMP (K) and ATP/ADP (L) ratio. Fifteen randomly selected glomeruli per mouse were examined (n = 3/per group). Values are the means ± SE. **P < 0.01 and *P < 0.05.
Fig. 2
Fig. 2
High-spatial-resolution (HSR)-MALDI-MSI and AMM enables to identify SM as a glomerular-localized lipid in mouse and human kidney. (A) Representative DHB-coated human kidney section. Bar; 1 mm. (B and C) Representative H&E image of human kidney section (B) and magnified H&E image (C). Black arrows indicate glomeruli. Bar; 1 mm. (D) Representative overall average spectrum of human kidney obtained by MALDI-MSI analysis. Red arrows show peaks (analytes) which are mainly distributed in the human glomeruli. (E–G) MALD-MSI images of human kidney at m/z 703.6, 725.6 and 741.5, respectively. (H–J) Overlay images of H&E and MSI images. White arrows indicate glomeruli. Spatial resolution for MALDI-MSI images (E–J); 90 μm. (K and L), Representative overall average spectra of human kidney (K) and mouse kidney (L) obtained by high-spatial-resolution (HSR)-MALDI-MSI analysis. Red arrows indicate the peaks (analytes) which are mainly distributed in the glomeruli of both mouse and human kidney. (M) Representative H&E-stained images and correspondent HSR-MALDI-MSI images (at m/z 703.6, 725.6 and 741.5) of human and mouse kidneys. Scale bars; 200 μm. White arrows indicate glomeruli. Spatial resolution for HSR-MALDI-MSI images; 25 μm. (N) Chemical structure of SM(d18:1/16:0). (O–Q) MS/MS (left) and FT-MS (right) spectra of H+ adduct (O), Na+ adduct (P) and K+ adduct (Q) of SM(d18:1/16:0). Samples were directly collected from the glomeruli in the kidney sections by the AMM instrument equipped with the light microscopy.
Fig. 3
Fig. 3
Accumulation of SM(d18:1/16:0) in the glomeruli of Akita mice. (A and B) Representative overall average spectra obtained from the kidney sections of WT (A) and Akita (B) mice by HSR-MALDI-MSI analysis. Black or red triangles indicate the SM(d18:1/16:0) related peaks (m/z 703.6 and 741.5). (C) Representative SM(d18:1/16:0) HSR-MALD-MSI images of the kidney cortex of WT and Akita mice. White arrows indicate glomeruli. Glomerular area was guided by H&E staining and the outlines of glomeruli in the enlarged images were shown by red dotted circles. Spatial resolution for HSR-MALDI-MSI images; 25 μm.
Fig. 4
Fig. 4
Accumulation of SM(d18:1/16:0) in the glomeruli of HFD-fed mice. (A and B) Representative overall average spectra obtained from the kidney sections of standard diet (STD) (A) and high-fat diet (HFD)-fed (B) mice by HSR-MALDI-MSI analysis. Duration of HFD feeding; one week. Black or orange triangles indicate the SM(d18:1/16:0) related peaks (703.6 and 741.5 m/z).(C) Representative SM(d18:1/16:0) HSR-MALD-MSI images of the kidney cortex of STD- and HFD-fed mice. White arrows indicate glomeruli. Glomerular area was guided by H&E staining and the outlines of glomeruli in the enlarged images were shown by red dotted circles. Spatial resolution for HSR-MALDI-MSI images; 25 μm. (D) Arterial and renal venous plasma SM(d18:1/16:0) ratios in STD and HFD-fed mice. Duration of HFD feeding; 14 weeks. n = 5 per group. ***P < 0.001 and *P < 0.05.
Fig. 5
Fig. 5
Expression of sphingomyelin synthases (SMSs) and sphingomyelinases (SMases) in the glomeruli of Akita and HFD-fed mice. (A–H) Representative, SMS1 (A and E) and SMS2 (B and F) aSMase (C and G), nSMase2 (D and H)-stained glomerular pictures (400 × magnification). (A–D) WT vs. Akita mice. (E–H) STD vs. HFD-fed mice. Duration of HFD feeding; one week. (I and J) Schematic diagram of accumulation of SM and role of SM-related enzymes in the kidney of Akita (I) and HFD-fed (J) mice. Fifteen randomly selected glomeruli per mouse were examined (n = 3/per group). Values are the means ± SE. ***P < 0.001 and **P < 0.01.
Fig. 6
Fig. 6
SM(d18:1/16:0) regulates ATP production via glycolysis in murine mesangial cells (MMCs). (A–C) Representative western blot images (A) and quantitative results of PGC1α (B) and p-AMPKα (C). (D–G) Representative western blot images (D) and quantitative results of aSMase (E), SMS1 (F), and SMS2 (G). (H–J) Representative western blot images (H) and quantitative results of p-Smad3 (I) and TGFβ1 (J). MMCs were treated with different liposomes for 15 min, and then cultured for 24 h before harvest. Whole cell lysates were used for analysis. n = 4/per group. (K) Representative western blot images of SMS1, SMS2 and actin. (L) ATP levels in MMCs. MMCs were transfected with SMS1 and/or SMS2 siRNA and treated with different liposomes. (M and N) Representative western blot images (M) and quantitative results of p-AMPKα (N). (O) Glucose consumption (per 24 h) in MMCs. (P) Lactate secretion (per 24 h) in MMCs. (Q) Glutamine levels in the medium of MMCs. (R) ATP levels in MMCs. MMCs were treated with or without 2-DG (10 mM) for 1 h before ATP measurement. L, O–R; n = 6–12 per group. Representative results from three independent experiments are shown. Values are means ± SE. ***P < 0.001. **P < 0.01 and *P < 0.05.

References

    1. Baranowski M., Blachnio A., Zabielski P., Gorski J. PPARalpha agonist induces the accumulation of ceramide in the heart of rats fed high-fat diet. J. Physiol. Pharmacol. 2007;58:57–72. - PubMed
    1. Boini K.M., Zhang C., Xia M., Poklis J.L., Li P.L. Role of sphingolipid mediator ceramide in obesity and renal injury in mice fed a high-fat diet. J. Pharmacol. Exp. Ther. 2010;334:839–846. - PMC - PubMed
    1. Cauwels A., Rogge E., Vandendriessche B., Shiva S., Brouckaert P. Extracellular ATP drives systemic inflammation, tissue damage and mortality. Cell Death Dis. 2014;5 - PMC - PubMed
    1. Chakraborty M., Lou C., Huan C., Kuo M.S., Park T.S., Cao G., Jiang X.C. Myeloid cell-specific serine palmitoyltransferase subunit 2 haploinsufficiency reduces murine atherosclerosis. J. Clin. Invest. 2013;123:1784–1797. - PMC - PubMed
    1. Chida J., Kido H. Extraction and quantification of adenosine triphosphate in mammalian tissues and cells. Methods Mol. Biol. 2014;1098:21–32. - PubMed

MeSH terms