. 2016 May:7:157-66.
doi: 10.1016/j.ebiom.2016.04.008. Epub 2016 Apr 13.

Systems Nutrigenomics Reveals Brain Gene Networks Linking Metabolic and Brain Disorders

Affiliations

Systems Nutrigenomics Reveals Brain Gene Networks Linking Metabolic and Brain Disorders

Qingying Meng et al. EBioMedicine. 2016 May.

Abstract

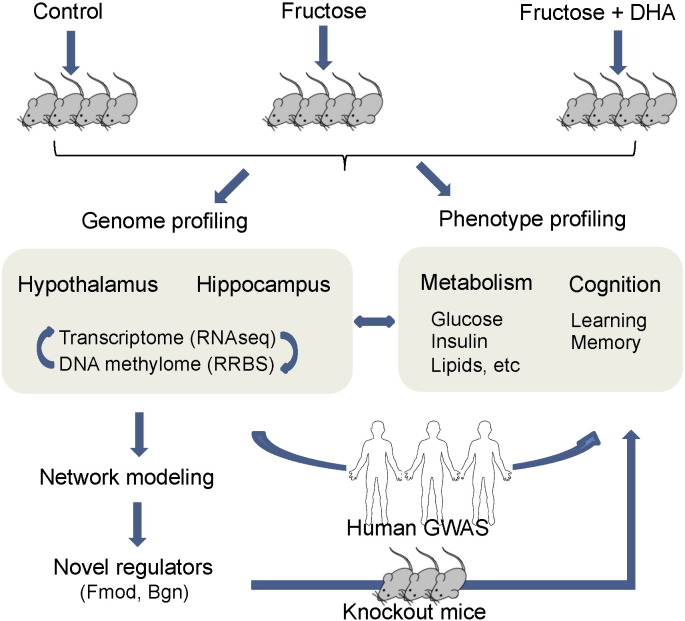
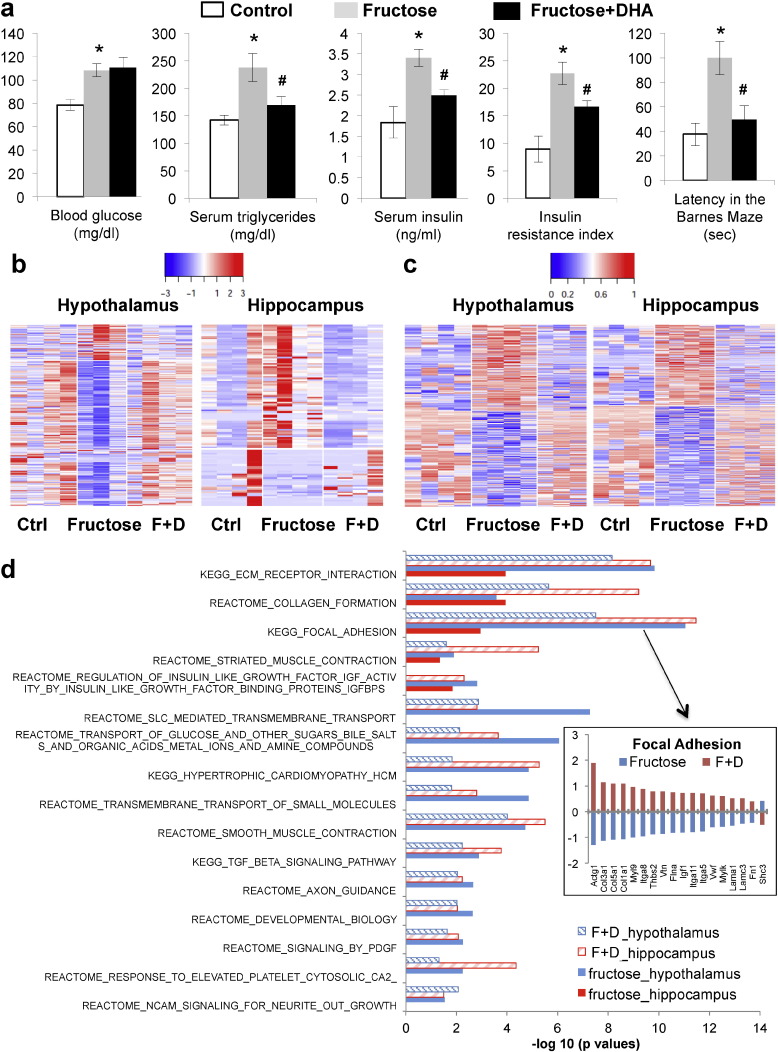
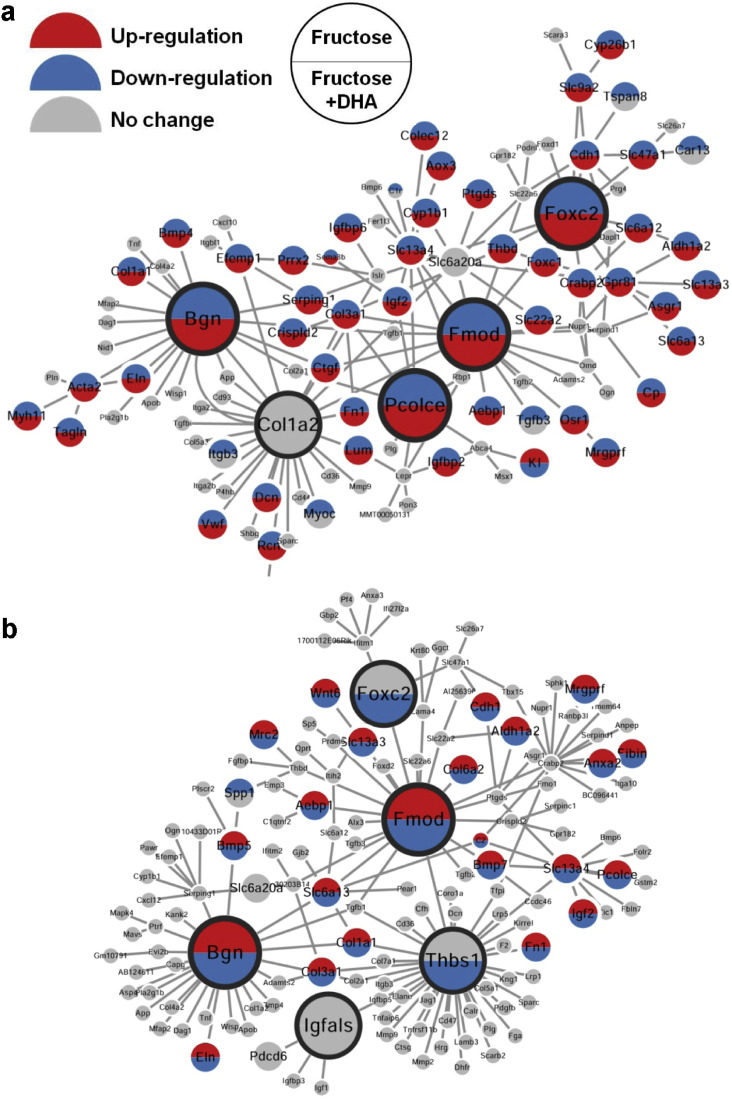
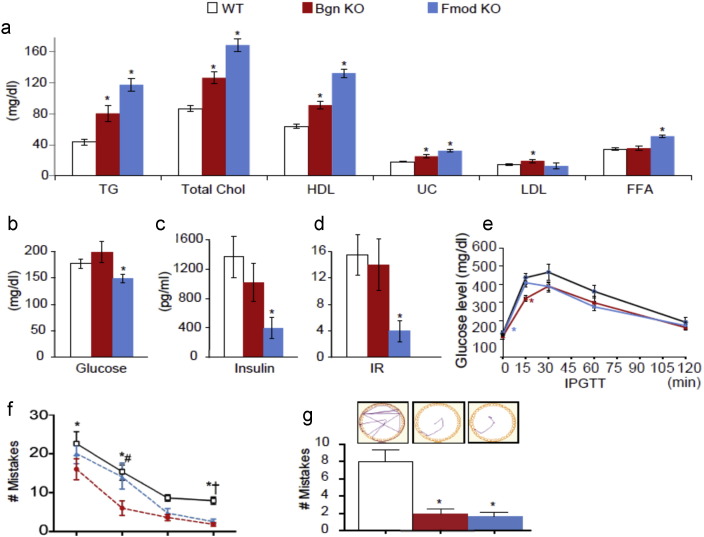
Nutrition plays a significant role in the increasing prevalence of metabolic and brain disorders. Here we employ systems nutrigenomics to scrutinize the genomic bases of nutrient-host interaction underlying disease predisposition or therapeutic potential. We conducted transcriptome and epigenome sequencing of hypothalamus (metabolic control) and hippocampus (cognitive processing) from a rodent model of fructose consumption, and identified significant reprogramming of DNA methylation, transcript abundance, alternative splicing, and gene networks governing cell metabolism, cell communication, inflammation, and neuronal signaling. These signals converged with genetic causal risks of metabolic, neurological, and psychiatric disorders revealed in humans. Gene network modeling uncovered the extracellular matrix genes Bgn and Fmod as main orchestrators of the effects of fructose, as validated using two knockout mouse models. We further demonstrate that an omega-3 fatty acid, DHA, reverses the genomic and network perturbations elicited by fructose, providing molecular support for nutritional interventions to counteract diet-induced metabolic and brain disorders. Our integrative approach complementing rodent and human studies supports the applicability of nutrigenomics principles to predict disease susceptibility and to guide personalized medicine.

Keywords: Brain disorders; Brain networks; DHA; Epigenome; Extracellular matrix; Fructose; Metabolic diseases; Omega-3 fatty acid; Systems nutrigenomics; Transcriptome.


Figures

Fig. 1
Fig. 1
Overall study design and analysis flow.
Fig. 2
Fig. 2
Changes in metabolic and behavior phenotypes, transcriptome, DNA methylome, and biological pathways in response to fructose treatment and DHA supplementation. (a) Metabolic and behavior phenotypes. From left to right: blood glucose, serum triglycerides, serum insulin, insulin resistance index, and latency time in the memory retention probe in the Barnes Maze test. Fructose group was compared with the control group, and the fructose + DHA group was compared to the fructose only group. p < 0.01 and #p < 0.05 by 2-sided Student's t-test. Error bars in the plots are standard errors. N = 8/group. (b) Heatmap of gene expression changes in hypothalamus and hippocampus. Blue to red colors indicate low to high expression values. (c) Heatmap of DNA methylation changes in hypothalamus and hippocampus. Blue to red colors indicate low to high methylation levels. (d) Select biological pathways affected by fructose and DHA in hypothalamus and hippocampus. Bars are the –log10 enrichment p values of the pathways. The insert plot on the right shows the opposite direction of changes in genes in the “focal adhesion” pathway in the hypothalamus between fructose and DHA: fructose mostly inhibits whereas DHA reverses the expression levels. In the insert plot Y-axis indicates log10 fold changes. The fructose + DHA group is labeled as F + D in panels b–d.
Fig. 3
Fig. 3
Gene subnetworks and top network key drivers (KDs) of fructose and DHA. (a) KDs and gene subnetwork in hypothalamus. (b) KDs and gene subnetwork in hippocampus. Larger nodes depict KDs; grey nodes are network genes in the neighborhood of KDs that are not affected by fructose or DHA; top and bottom halves of each node, if colored, denotes genes affected by fructose (top) and DHA (bottom), respectively; red and blue colors denotes increased and decreased expression, respectively. Direction of change for the fructose group is determined by comparison with the control group; direction of change for the DHA + fructose group is determined by comparison with the fructose group.
Fig. 4
Fig. 4
Phenotypic validation of Bgn and Fmod using knockout (KO) mice. (a) Lipid traits including triglyceride (TG), total cholesterol, HDL cholesterol, un-esterified cholesterol (UC), LDL cholesterol and free fatty acids (FFA). (b) Glucose. (c) Insulin. (d) Insulin resistance (IR) measured by insulin sensitivity index. (e) Intraperitoneal glucose tolerance test (IPGTT). (f) Mistakes made during the Barnes Maze test in four days of the learning phase. (g) Track plots and mistakes made during Barnes Maze test for spatial memory. Two-sided Student's t-test was used to test statistical difference between knockout mice (Bgn KO or Fmod KO) and wild-type (WT) mice for analyses in (a)–(g). Two-way ANOVA with Holm-Sidak post hoc analysis for multiple comparisons was performed for the learning curves in panel (f) with *WT vs. Bgn KO; #Bgn KO vs. Fmod KO; and WT vs. Fmod KO. Error bars in the plots are standard errors. p < 0.05. Sample size n = 8–16.

References

    1. Agrawal R., Gomez-Pinilla F. ‘Metabolic syndrome’ in the brain: deficiency in omega-3 fatty acid exacerbates dysfunctions in insulin receptor signalling and cognition. J. Physiol. 2012;590:2485–2499. - PMC - PubMed
    1. Agrawal R., Noble E., Vergnes L., Ying Z., Reue K., Gomez-Pinilla F. Dietary fructose aggravates the pathobiology of traumatic brain injury by influencing energy homeostasis and plasticity. J. Cereb. Blood Flow Metab. 2015 (Online before print) - PMC - PubMed
    1. Akalin A., Kormaksson M., Li S., Garrett-Bakelman F.E., Figueroa M.E., Melnick A., Mason C.E. methylKit: a comprehensive R package for the analysis of genome-wide DNA methylation profiles. Genome Biol. 2012;13:R87. - PMC - PubMed
    1. Ameye L., Aria D., Jepsen K., Oldberg A., Xu T., Young M.F. Abnormal collagen fibrils in tendons of biglycan/fibromodulin-deficient mice lead to gait impairment, ectopic ossification, and osteoarthritis. FASEB J. 2002;16:673–680. - PubMed
    1. Bomfim T.R., Forny-Germano L., Sathler L.B., Brito-Moreira J., Houzel J.C., Decker H., Silverman M.A., Kazi H., Melo H.M., Mcclean P.L., Holscher C., Arnold S.E., Talbot K., Klein W.L., Munoz D.P., Ferreira S.T., De Felice F.G. An anti-diabetes agent protects the mouse brain from defective insulin signaling caused by Alzheimer's disease-associated Abeta oligomers. J. Clin. Invest. 2012;122:1339–1353. - PMC - PubMed

MeSH terms