. 2016 May:7:255-66.
doi: 10.1016/j.ebiom.2016.04.011. Epub 2016 Apr 22.

Integrated analysis of the Plasmodium species transcriptome

Affiliations

Integrated analysis of the Plasmodium species transcriptome

Regina Hoo et al. EBioMedicine. 2016 May.

Abstract

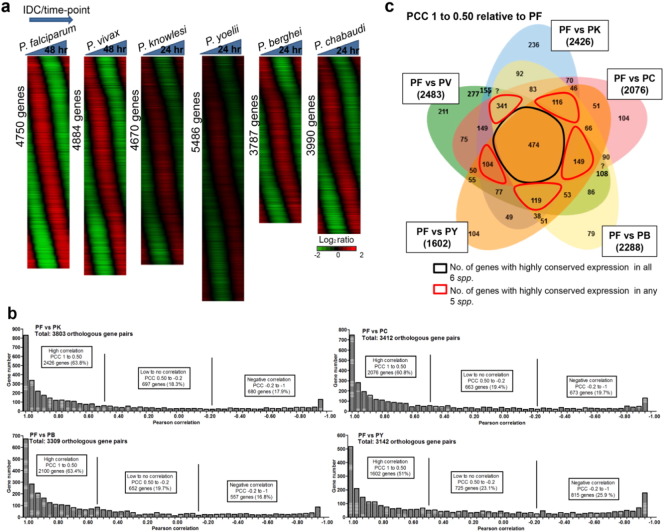
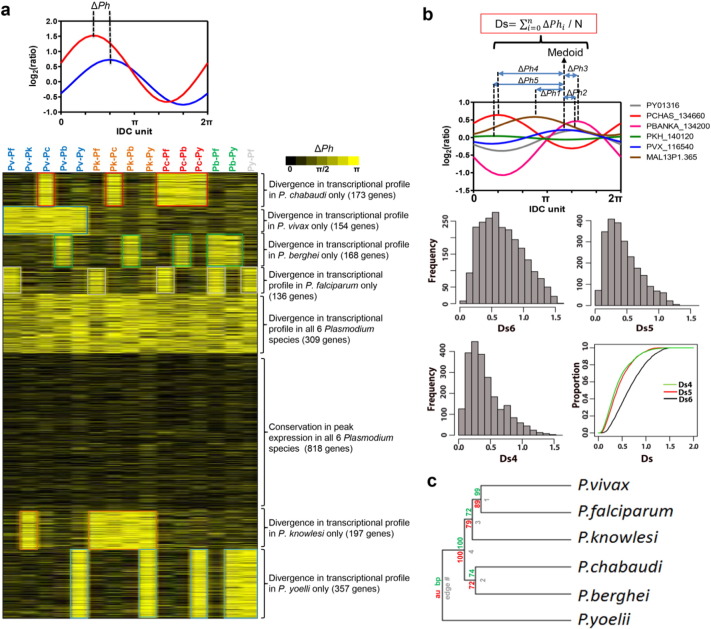
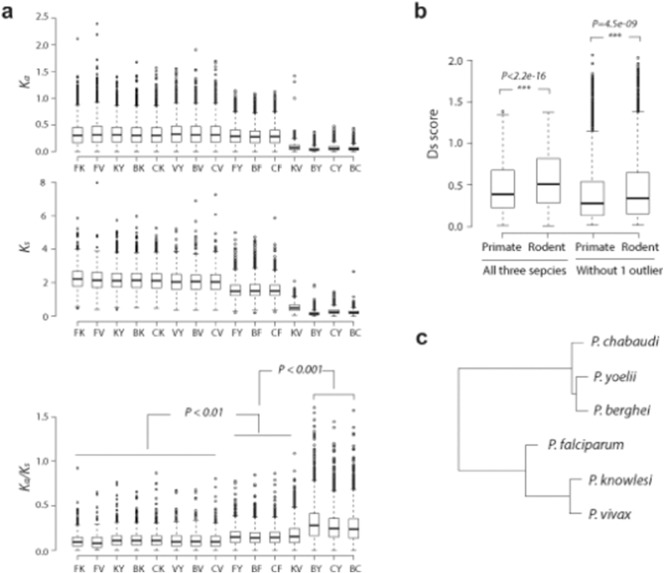
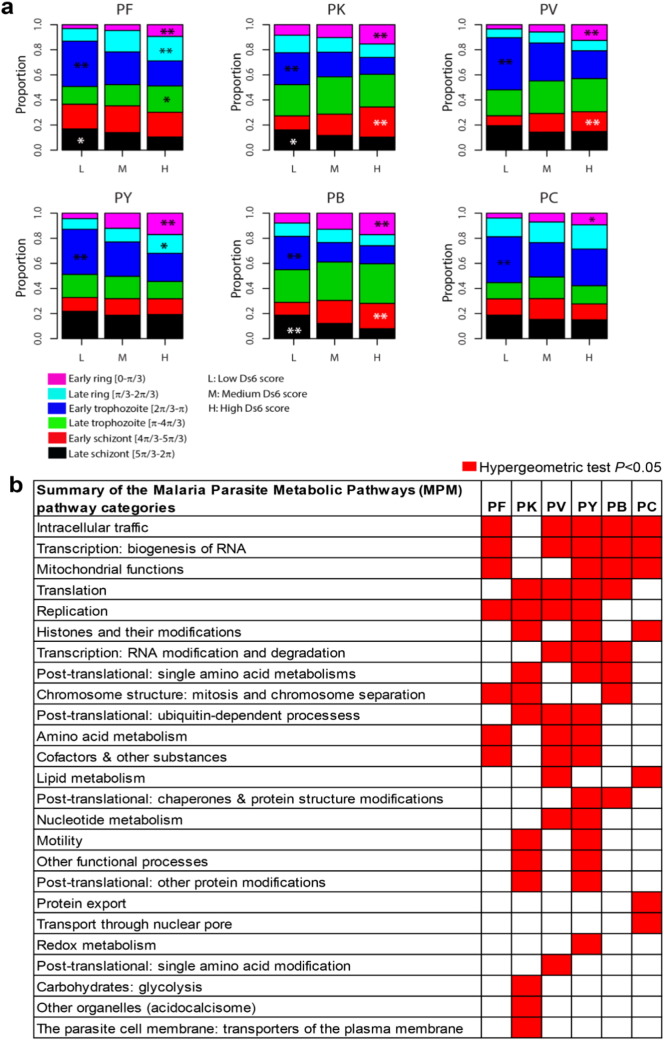
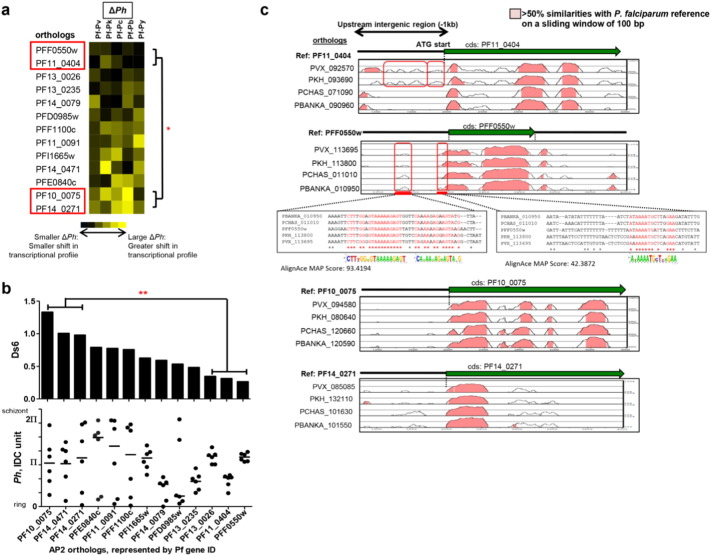
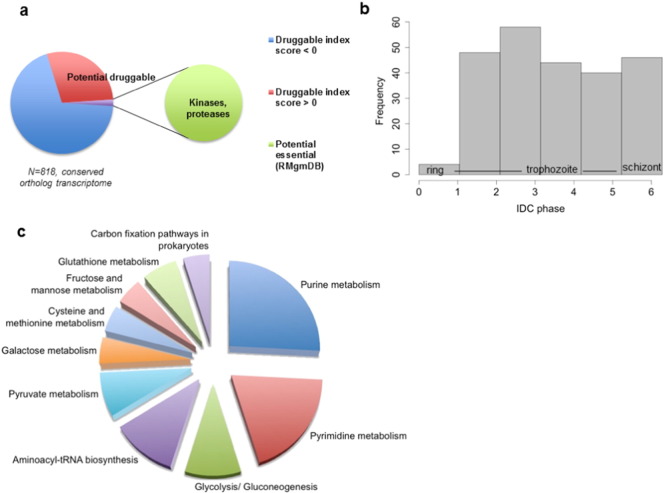
The genome sequence available for different Plasmodium species is a valuable resource for understanding malaria parasite biology. However, comparative genomics on its own cannot fully explain all the species-specific differences which suggests that other genomic aspects such as regulation of gene expression play an important role in defining species-specific characteristics. Here, we developed a comprehensive approach to measure transcriptional changes of the evolutionary conserved syntenic orthologs during the intraerythrocytic developmental cycle across six Plasmodium species. We show significant transcriptional constraint at the mid-developmental stage of Plasmodium species while the earliest stages of parasite development display the greatest transcriptional variation associated with critical functional processes. Modeling of the evolutionary relationship based on changes in transcriptional profile reveal a phylogeny pattern of the Plasmodium species that strictly follows its mammalian hosts. In addition, the work shows that transcriptional conserved orthologs represent potential future targets for anti-malaria intervention as they would be expected to carry out key essential functions within the parasites. This work provides an integrated analysis of orthologous transcriptome, which aims to provide insights into the Plasmodium evolution thereby establishing a framework to explore complex pathways and drug discovery in Plasmodium species with broad host range.

Keywords: Comparative transcriptomics; Drug targets; Evolution; Microarray; Plasmodium species; Transcriptome.


Figures

Fig. 1
Fig. 1
Smoothed transcriptome and comparative correlation transcriptomic analyses of P. falciparum, P. vivax, P. knowlesi, P. berghei, P. yoelii and P. chabaudi. (a) Overall intraerythrocytic developmental cycle (IDC) transcriptome profiling for P. falciparum (4750 genes), P. vivax (4884 genes), P. knowlesi (4670 genes), P. yoelii (5486 genes), P. berghei (3787 genes), and P. chabaudi (3990 genes). The phaseograms were generated from the log2 expression ratio and each profile was median centered. The phaseograms also include the expression of 2312 syntenic orthologous genes present in all 6 Plasmodium species. (b) Histograms showed overall distribution of Pearson correlation coefficients (PCCs) calculated from the smoothed transcriptome dataset between P. knowlesi, P. chabaudi, P. berghei and P. yoelii using P. falciparum as reference species. (c) Venn diagram analysis of co-expressed genes with PCC scores of ≥ 0.5–1.00 in different Plasmodium species. The numbers in brackets beside each species pairs (Pf vs Pv, Pf vs Pk, Pf vs Pb, Pf vs Pc, Pf vs Py) represent total number of genes with PCCs of ≥ 0.50. The numbers inside the Venn diagram represent total number of overlapped orthologous genes between the species pair.
Fig. 2
Fig. 2
Delta phase (ΔPh) and Ds as the measurement of transcriptional divergence. (a) ΔPh is calculated based on the absolute difference of Ph or peak in gene expression timing between any two orthologs in two different species. Heatmap shows the syntenic orthologs with K-means clustering (100 runs) of ΔPh of species pair P. vivax; Pv, P. knowlesi; Pk, P. chabaudi; Pc, P. berghei; Pb and P. yoelii; Py with reference to P. falciparum; Pf. Yellow represents highly divergent genes with large delta phase, while black represents highly conserved genes with small delta phase compare to P. falciparum. (b) Ds score is the average ΔPh between each orthologs to the medoid ortholog measuring the transcription divergence of a gene across multiple species (see method). Overall frequency distribution and cumulative proportion of Ds measured from 2312 syntenic orthologous genes present in all six Plasmodium species (Ds6), any five Plasmodium species (Ds5) or any four Plasmodium species (Ds4). (c) Hierarchical clustering of the six Plasmodium species based on the IDC phaseogram using Wards algorithm of clustering and dissimilarity matrix defined by ∆ Ph (see methods). Numbers adjacent to the branch points are percentage of approximately unbiased (AU), P-value (in red) and bootstrap probability (BP) (in green).
Fig. 3
Fig. 3
Conservation and diversification of syntenic orthologs at the coding sequence and transcription levels. (a) Non-synonymous (Ka) and synonymous (Ks) rates and their ratios (Ka/Ks) were calculated for 2312 syntenic orthologous gene, between cross-species gene pairs. F represents for P. falciparum, V for P. vivax, K for P. knowlesi, Y for P. yoelii, C for P. chabaudi and B for P. berghei. (b) Distribution of Ds scores of primate Plasmodium species (PF, PK and PV) and rodent Plasmodium species (PY, PB and PC) in one category of all three species and one category of two species without one outlier. (c) Unrooted tree constructed using mode values of Ka as the distance metric (details see Materials and methods). Statistical significance of differences was measured using Mann-Whitney test.
Fig. 4
Fig. 4
Variability of the Plasmodium transcriptome during IDC and enrichment of functional pathways in outlier species. (a) Temporal expression divergence of the Plasmodium transcriptome during IDC. Proportion of genes with low (L), medium (M) and high (H) Ds value in P. falciparum; PV, P. knowlesi; PK, P. vivax; PV, P. yoelii; PY, P. berghei; PB and P. chabaudi; PC. Peak in gene expression timing, Ph for each gene was bin in range of π/3 from 0 (early ring) to 2π (late schizont). Proportion was calculated based on the number of genes within each Ph range over the total number of genes with H, M, or L Ds value. Significance of association between Ds and Ph proportion for each IDC range were analyzed using Chi-square test (*P < 0.01, **P < 0.001). (b) Summary of functionally significant MPM pathways in outlier genes/species. Orthologs of species with the most divergent expression timing, Ph or outlier species (see Materials and methods) are subjected to pathway enrichment analysis using hypergeometric distribution function. Red-colored panel indicates significant MPM pathway with altered transcriptome profile within each species group with hypergeometric test P < 0.05.
Fig. 5
Fig. 5
Comparative analyses of AP2 expression profiles and sequence alignment across six Plasmodium species. (a) Heatmap shows ΔPh profile for 13 AP2 syntenic orthologs present in all 6 Plasmodium species. Statistical significance of differences was measured between the ΔPh of the highly divergent and conserve AP2 orthologs expression, highlighted with red box, using one-way ANOVA analysis (*P < 0.05). (b) Barplot and scatterplot (median value indicated by black line) show Ds6 and Ph respectively for the 13 AP2 syntenic orthologs. Statistical significance of differences was measured between Ds6 of the highly divergent and conserve AP2 orthologs expression using nonparametric t-test (**P < 0.01). (c) Alignment plot of coding region and -1000 bp upstream region from the ATG start site of four AP2 with the most conserved and diverged gene expression using mLAGAN and wAlignAce. Cutoff of > 50% similarities are highlighted in pink. AP2 orthologs are represented by P. falciparum gene ID on the top-left of each alignment plot.
Fig. 6
Fig. 6
Druggability prediction from the conserved orthologs transcriptome. (a) Proportion of transcriptionally conserved orthologs with positive druggability index score and essentiality data from RMgmDB database. (b) Overall frequency distribution of peak in IDC expression timing (phase) and (c) metabolic pathway enrichment analysis (PlasmoDB) of 240 genes that are both transcriptionally conserved and with positive druggability evidence index score from TDR database.

Similar articles

Cited by

References

    1. Aguero F., Al-Lazikani B., Aslett M., Berriman M., Buckner F.S., Campbell R.K., Carmona S., Carruthers I.M., Chan A.W., Chen F., Crowther G.J., Doyle M.A., Hertz-Fowler C., Hopkins A.L., Mcallister G., Nwaka S., Overington J.P., Pain A., Paolini G.V., Pieper U., Ralph S.A., Riechers A., Roos D.S., Sali A., Shanmugam D., Suzuki T., Van Voorhis W.C., Verlinde C.L. Genomic-scale prioritization of drug targets: the TDR Targets database. Nat. Rev. Drug Discov. 2008;7:900–907. - PMC - PubMed
    1. Ay F., Bunnik E.M., Varoquaux N., Vert J.P., Noble W.S., Le Roch K.G. Multiple dimensions of epigenetic gene regulation in the malaria parasite Plasmodium falciparum: gene regulation via histone modifications, nucleosome positioning and nuclear architecture in P. falciparum. BioEssays: News Rev. Mol. Cell. Dev. Biol. 2015;37:182–194. - PMC - PubMed
    1. Balaji S., Babu M.M., Iyer L.M., Aravind L. Discovery of the principal specific transcription factors of Apicomplexa and their implication for the evolution of the AP2-integrase DNA binding domains. Nucleic Acids Res. 2005;33:3994–4006. - PMC - PubMed
    1. Bozdech Z., Llinas M., Pulliam B.L., Wong E.D., Zhu J., Derisi J.L. The transcriptome of the intraerythrocytic developmental cycle of Plasmodium falciparum. PLoS Biol. 2003;1 - PMC - PubMed
    1. Bozdech Z., Mok S., Hu G., Imwong M., Jaidee A., Russell B., Ginsburg H., Nosten F., Day N.P., White N.J., Carlton J.M., Preiser P.R. The transcriptome of Plasmodium vivax reveals divergence and diversity of transcriptional regulation in malaria parasites. Proc. Natl. Acad. Sci. U. S. A. 2008;105:16290–16295. - PMC - PubMed