. 2016 Jun 20;12(6):e1004952.
doi: 10.1371/journal.pcbi.1004952. eCollection 2016 Jun.

Filopodial-Tension Model of Convergent-Extension of Tissues

Affiliations

Filopodial-Tension Model of Convergent-Extension of Tissues

Julio M Belmonte et al. PLoS Comput Biol. .

Abstract

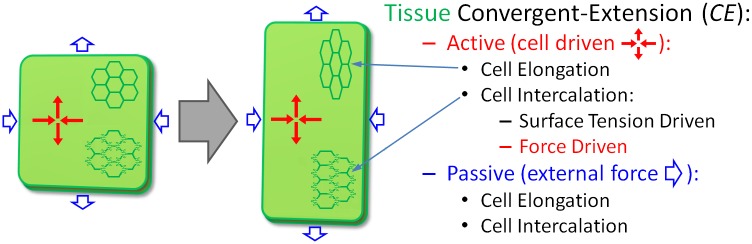
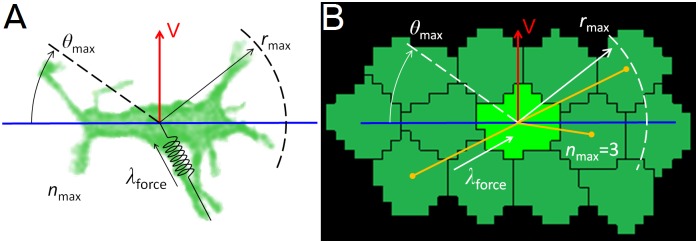
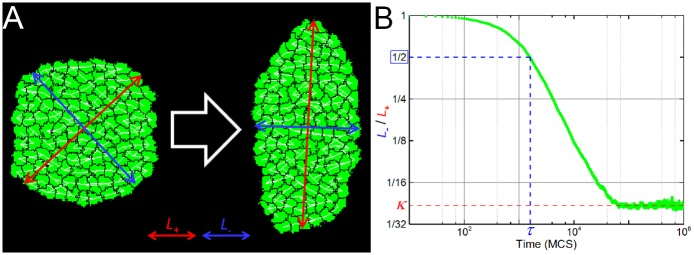
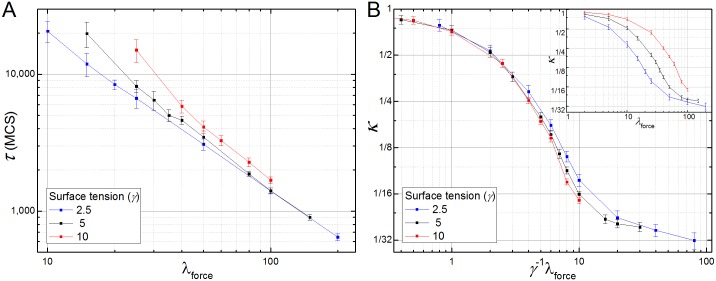
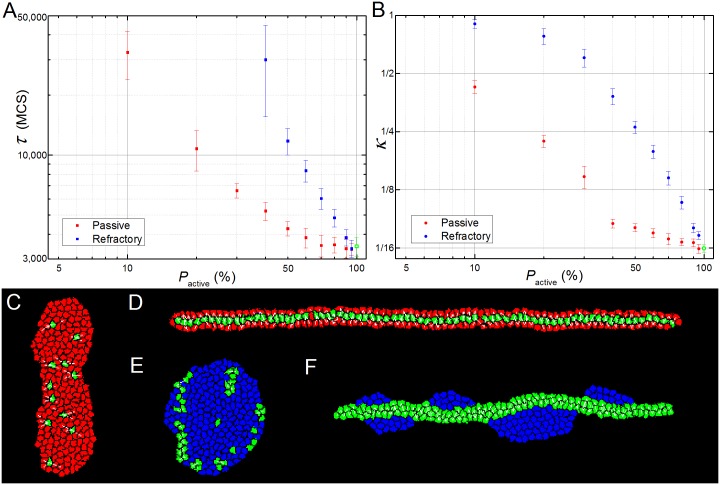
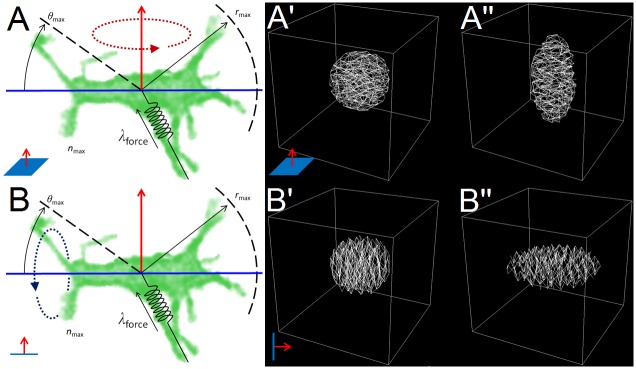
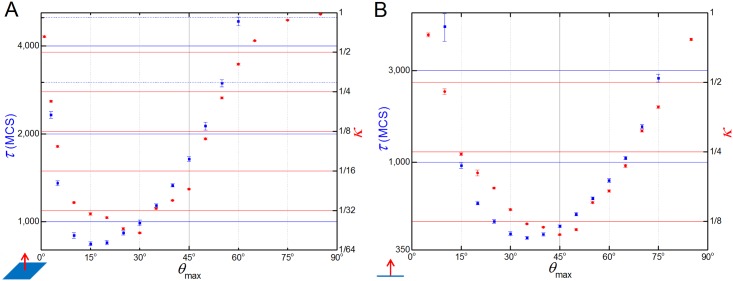
In convergent-extension (CE), a planar-polarized epithelial tissue elongates (extends) in-plane in one direction while shortening (converging) in the perpendicular in-plane direction, with the cells both elongating and intercalating along the converging axis. CE occurs during the development of most multicellular organisms. Current CE models assume cell or tissue asymmetry, but neglect the preferential filopodial activity along the convergent axis observed in many tissues. We propose a cell-based CE model based on asymmetric filopodial tension forces between cells and investigate how cell-level filopodial interactions drive tissue-level CE. The final tissue geometry depends on the balance between external rounding forces and cell-intercalation traction. Filopodial-tension CE is robust to relatively high levels of planar cell polarity misalignment and to the presence of non-active cells. Addition of a simple mechanical feedback between cells fully rescues and even improves CE of tissues with high levels of polarity misalignments. Our model extends easily to three dimensions, with either one converging and two extending axes, or two converging and one extending axes, producing distinct tissue morphologies, as observed in vivo.


Conflict of interest statement

The authors have declared that no competing interests exist.

Figures

Fig 1
Fig 1. Types of convergent extension.
In active convergent-extension, the cells in the tissue generate deforming forces due to anisotropic adhesion or pulling forces between cells (red arrows), while in passive convergent-extension, the surrounding environment deforms the tissue (blue arrows). Cell intercalation occurs in types of CE, but the axis of cell elongation is typically perpendicular to the axis of elongation in active CE and parallel in passive CE.
Fig 2
Fig 2. Cell intercalation model.
(A,B) Given a planar-polarization vector (red) and convergence axis (blue), a cell forms links with up to nmax cells that lies within the interaction range rmax from its center-of-mass and within an angle ±ϑmax, of the convergence axis. Each link exerts a tensions force λforce on both of the cells it connects. (A) Image of a bipolar cell in chicken limb-bud mesenchyme overlaid with model parameters. (B) Snapshot of a GGH/CPM computer simulation of the filopodial-tension model, overlaid with model parameters. Dark yellow lines represent simulated filopodial links between a cell (light green) and its currently interacting neighbors (dark green). Experimental image courtesy of Gaja Lesnicar-Pucko and James Sharpe, CRG, Barcelona.
Fig 3
Fig 3. Simulation snapshots and metrics.
(A) Snapshots of a 2D simulation with reference parameter values, showing the initial configuration (left) and the configuration when the length of the major axis (L+, red lines) increases to twice the length of the minor axis (L-, blue lines), i.e., κ = 0.5. The simulation contains N = 109 cells (in green) with the tension forces shown by the white segments connecting their centers-of-mass. (B) Graph of L-/L+ versus time for the reference 2D simulation. For all simulations we measured the final value of the ratio between the length of minor and major axes of the tissue κ (shown in red), and the time τ (shown in blue) when the length of the major axis doubles the length of the minor axis (L-/L+ = 0.5).
Fig 4
Fig 4. Competition between filopodial tension and surface tension in the 2D filopodial tension model.
(A) The elongation time (τ) till the tissue’s inverse aspect ratio decreases to 0.5 as a function of the filopodial tension (λforce) of the cells for different surface tensions (γ). (B) Insert: Degree of tissue deformation (κ) as a function of λforce. An increase in the surface tension of the tissue reduces the final degree of CE (larger κ) shifting the κ vs. λforce curve to the right. The opposite effect happens when the surface tension is decreased. Main: The κ vs. λforce curves collapse when we rescale with the tension force by the surface tension plotting κ vs. λforce/γ.
Fig 5
Fig 5. Parameter sensitivities.
Left vertical axes and open blue squares correspond to τ and right vertical axes and solid red dots corresponds to κ. Parameters changes one-at-a-time with remaining parameter set to their reference values. (A) Filopodial lifetime (tinterval): κ and τ are independent of tinterval for lifetimes lower than the typical time for cell rearrangement (tinterval < 200 MCS) and increase monotonically for tinterval > 200 MCS. (B) Filopodial range (rmax): κ decreases with increasing rmax for rmax < 2 cell diameters and is constant for rmax > 2 cell diameters. τ decreases monotonically with increasing rmax. CE fails for rmax < 1.5 cell diameters. (C) Number of filopodial interactions (nmax): κ and τ decrease monotonically with increasing nmax, however κ decreases more slowly for nmax > 4. (D) Angular range of filopodiamax): for nmax = 3 (reference value), τ (blue squares) and κ (red dots) decrease monotonically with increasing ϑmax for small ϑ and increase monotonically with increasing ϑmax for large ϑ, with minima at ϑmax = 30° and ϑmax = 40°, respectively. CE fails for ϑmax > 70°. For nmax = 7, τ vs. ϑmax (blue line) and κ vs. ϑmax (red line) are also concave curves with minima at ϑmax = 40° and ϑmax = 50°, respectively. CE fails for ϑmax > 80°.
Fig 6
Fig 6. Contact-mediated pulling version of the model.
(A) Cells only pulls neighbors (here, 3) that share a common surface area (shown in red) and that lie inside a maximum angle with respect to the convergence plane (here the horizontal axis). (B) Dependence of τ and κ with λforce is qualitatively the same as before (Fig 4). (C) Dependence with nmax is reversed, with the speed of intercalation (τ-1) saturating after nmax = 3 and κ still decreasing. (D) The (κ τ,) x ϑmax curves are more symmetric, but the tissue still elongates more and faster at lower angles.
Fig 7
Fig 7. Simulation results for different levels of polarization misalignment.
(A) Semi-log graph of τ and κ with the variance (σ2). Both metrics are exponential functions of the variance. (B-D) Snapshots of 3 simulations with different levels of misalignment (σ = 40°, 50° and 70°). Each cell is represented by a white vector showing the direction of its polarization. The bigger vectors on (C) and (D) are due to zoom.
Fig 8
Fig 8. Mechanical feedback rescues CE on tissues with polarization misalignment.
(A) Schematic view of the mechanical feedback model: every cell has a polarization vector Vt (red solid arrow) that defines an orthogonal convergence plane (blue solid line); at time t the cell pulls and it is pulled by it neighbors; this set of pulling forces (black arrows) defines a tension line along the cell (dashed dark blue line) which in turn defines an orthogonal vector T; at time t+Δt a new polarization vector Vt+Δt is set by the weighted average of T and Vt, where w is the feedback factor with w = 0 corresponding to the case with no feedback and w = 1 corresponding to no memory of previous orientations. (B) Dependency of parameter κ with the feedback weighting factor w in tissues with different levels of tissue misalignment. Horizontal dashed lines indicate results with no feedback (w = 0). High feedback worsens final elongation for tissues with low polarization misalignment (w ≥ 0.001 for σ = 0° and w ≥ 0.01 for σ = 20°), but in general rescues and even leads to higher elongation ratios with weaker feedback levels. (C) Dependency of parameter τ with the feedback weighting factor w in tissues with different levels of tissue misalignment. Horizontal dashed lines indicate results with no feedback (w = 0).
Fig 9
Fig 9. Simulation results for heterogeneous tissues.
(A) Dependency of parameter κ with the percentage of passive (red dots) and refractory (blue squares) cells. (B) Dependency of parameter τ with the percentage of passive (red dots) and refractory (blue squares) cells. For both graphs, the measured value for the homogeneous tissue is represented by the green open square (A) or dot (B). Values of κ are measured for the whole tissue (active and non-active cells). (C-D) Simulations with passive cells; (E-F) simulations with refractory cells. (C) On a simulation with 95% of passive cells (in red) the remaining 5% of active cells (green) are still able to induce some degree of CE. (D) In a typical simulation with a higher percentage of active cells (here 33%) the active cells align at the center line of the extending tissue. (E) A failed CE for a tissue with less than 20% of active cells (here, 82% of refractory cells, blue). (F) When the percentage of active cells is above 20% (here 54%) the two populations sort out, with the active cells forming an elongated tissue and the refractory cells lying on each side of the structure. Panels (D) and (F) were rotated 90° for visualization purposes.
Fig 10
Fig 10. 3D filopodial tension model versions.
(A) Rotation around the polarization vector produces the 3D equatorial model. (B) Rotation around the convergence line results in the 3D bipolar model. (A’-A”) Initial and final states of a simulation of the equatorial model with all cells’ polarization vectors pointing up. (B’-B”) Initial and final states of a simulation of the bipolar model with all cells’ convergence axis lying vertically.
Fig 11
Fig 11. Dependence of τ and κ with ϑmax in the 3D versions.
(A) 3D extensional model and (B) 3D bipolar model dependence of κ and τ parameters with ϑmax. The range of best values for both κ and τ lies at much shorter angles in the 3D extension model (A) than the 2D model (see Fig 5D), which in turn has a range of optimal values slightly lower than in the 3D convergence model (B).

References

    1. Glickman NS, Kimmel CB, Jones MA, Adams RJ (2003) Shaping the zebrafish notochord. Development 130: 873–887. - PubMed
    1. Keller R, Tibbetts P (1989) Mediolateral Cell Intercalation in the Dorsal, Axial Mesoderm of Xenopus-Laevis. Developmental Biology 131: 539–549. - PubMed
    1. Davidson LA, Keller RE (1999) Neural tube closure in Xenopus laevis involves medial migration, directed protrusive activity, cell intercalation and convergent extension. Development 126: 4547–4556. - PubMed
    1. Voiculescu O, Bertocchini F, Wolpert L, Keller RE, Stern CD (2007) The amniote primitive streak is defined by epithelial cell intercalation before gastrulation. Nature 449: 1049–1052. - PubMed
    1. Ettensohn CA (1985) Gastrulation in the Sea-Urchin Embryo Is Accompanied by the Rearrangement of Invaginating Epithelial-Cells. Developmental Biology 112: 383–390. - PubMed

Publication types

LinkOut - more resources