

The Computational Development of Reinforcement Learning during Adolescence
- PMID: 27322574
- PMCID: PMC4920542
- DOI: 10.1371/journal.pcbi.1004953
The Computational Development of Reinforcement Learning during Adolescence
Abstract
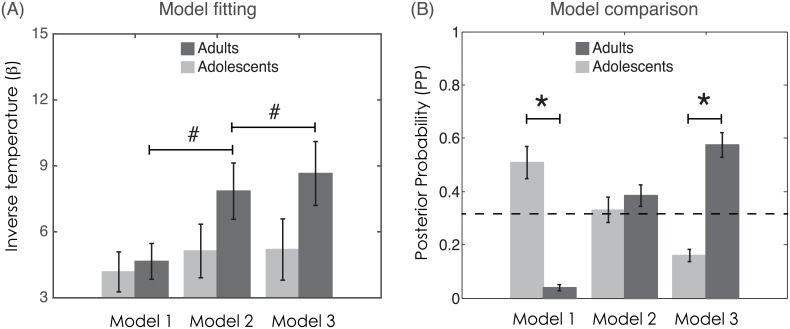
Adolescence is a period of life characterised by changes in learning and decision-making. Learning and decision-making do not rely on a unitary system, but instead require the coordination of different cognitive processes that can be mathematically formalised as dissociable computational modules. Here, we aimed to trace the developmental time-course of the computational modules responsible for learning from reward or punishment, and learning from counterfactual feedback. Adolescents and adults carried out a novel reinforcement learning paradigm in which participants learned the association between cues and probabilistic outcomes, where the outcomes differed in valence (reward versus punishment) and feedback was either partial or complete (either the outcome of the chosen option only, or the outcomes of both the chosen and unchosen option, were displayed). Computational strategies changed during development: whereas adolescents' behaviour was better explained by a basic reinforcement learning algorithm, adults' behaviour integrated increasingly complex computational features, namely a counterfactual learning module (enabling enhanced performance in the presence of complete feedback) and a value contextualisation module (enabling symmetrical reward and punishment learning). Unlike adults, adolescent performance did not benefit from counterfactual (complete) feedback. In addition, while adults learned symmetrically from both reward and punishment, adolescents learned from reward but were less likely to learn from punishment. This tendency to rely on rewards and not to consider alternative consequences of actions might contribute to our understanding of decision-making in adolescence.
Conflict of interest statement
The authors have declared that no competing interests exist.
Figures


Similar articles
-
Distinct linear and non-linear trajectories of reward and punishment reversal learning during development: relevance for dopamine's role in adolescent decision making.Dev Cogn Neurosci. 2011 Oct;1(4):578-90. doi: 10.1016/j.dcn.2011.06.007. Epub 2011 Jun 25. Dev Cogn Neurosci. 2011. PMID: 22436570 Free PMC article.
-
How we learn to make decisions: rapid propagation of reinforcement learning prediction errors in humans.J Cogn Neurosci. 2014 Mar;26(3):635-44. doi: 10.1162/jocn_a_00509. Epub 2013 Oct 29. J Cogn Neurosci. 2014. PMID: 24168216
-
Confirmation bias in human reinforcement learning: Evidence from counterfactual feedback processing.PLoS Comput Biol. 2017 Aug 11;13(8):e1005684. doi: 10.1371/journal.pcbi.1005684. eCollection 2017 Aug. PLoS Comput Biol. 2017. PMID: 28800597 Free PMC article.
-
What motivates adolescents? Neural responses to rewards and their influence on adolescents' risk taking, learning, and cognitive control.Neurosci Biobehav Rev. 2016 Nov;70:135-147. doi: 10.1016/j.neubiorev.2016.06.037. Epub 2016 Jun 25. Neurosci Biobehav Rev. 2016. PMID: 27353570 Review.
-
Frontostriatal development and probabilistic reinforcement learning during adolescence.Neurobiol Learn Mem. 2017 Sep;143:1-7. doi: 10.1016/j.nlm.2017.04.009. Epub 2017 Apr 24. Neurobiol Learn Mem. 2017. PMID: 28450078 Review.
Cited by
-
The interpretation of computational model parameters depends on the context.Elife. 2022 Nov 4;11:e75474. doi: 10.7554/eLife.75474. Elife. 2022. PMID: 36331872 Free PMC article.
-
Reinforcement Learning during Adolescence in Rats.J Neurosci. 2020 Jul 22;40(30):5857-5870. doi: 10.1523/JNEUROSCI.0910-20.2020. Epub 2020 Jun 29. J Neurosci. 2020. PMID: 32601244 Free PMC article.
-
Anhedonia in Relation to Reward and Effort Learning in Young People with Depression Symptoms.Brain Sci. 2023 Feb 17;13(2):341. doi: 10.3390/brainsci13020341. Brain Sci. 2023. PMID: 36831884 Free PMC article.
-
Effects of three prophylactic interventions on French middle-schoolers' mental health: protocol for a randomized controlled trial.BMC Psychol. 2024 Apr 13;12(1):204. doi: 10.1186/s40359-024-01723-8. BMC Psychol. 2024. PMID: 38615007 Free PMC article.
-
What do Reinforcement Learning Models Measure? Interpreting Model Parameters in Cognition and Neuroscience.Curr Opin Behav Sci. 2021 Oct;41:128-137. doi: 10.1016/j.cobeha.2021.06.004. Epub 2021 Jul 3. Curr Opin Behav Sci. 2021. PMID: 34984213 Free PMC article.
References
-
- Steinberg L. Cognitive and affective development in adolescence. Trends Cogn Sci. 2005;9: 69–74. - PubMed
-
- Blakemore S-J, Robbins TW. Decision-making in the adolescent brain. Nat Neurosci. Nature Publishing Group; 2012;15: 1184–91. - PubMed
-
- Willoughby T, Good M, Adachi PJC, Hamza C, Tavernier R. Brain and Cognition Examining the link between adolescent brain development and risk taking from a social—developmental perspective. Brain Cogn. Elsevier Inc.; 2013;83: 315–323. - PubMed
Publication types
MeSH terms
Grants and funding
LinkOut - more resources
Full Text Sources
Other Literature Sources
Medical
