

Time Trends in the Incidence of Parkinson Disease
- PMID: 27323276
- PMCID: PMC5004732
- DOI: 10.1001/jamaneurol.2016.0947
Time Trends in the Incidence of Parkinson Disease
Abstract
Importance: Changes over time in the incidence of parkinsonism and Parkinson disease (PD) remain uncertain.
Objective: To investigate secular trends (period effects) and birth cohort trends in the incidence of parkinsonism and PD over 30 years in a geographically defined American population.
Design, setting, and participants: We used the medical records-linkage system of the Rochester Epidemiology Project to identify incidence cases of PD and other types of parkinsonism in Olmsted County, Minnesota, from 1976 to 2005. All cases were classified by a movement disorder specialist using defined criteria through the review of the complete medical records within the system. The analyses for this study were conducted between May 2015 and January 2016.
Main outcomes and measures: Incidence rates of parkinsonism and PD over 30 years. We tested for secular trends (period effects) using negative binomial regression models and for birth cohort effects using age-period-cohort models.
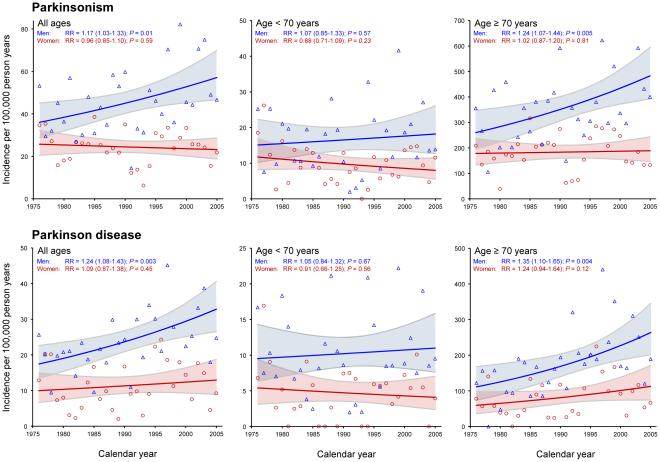
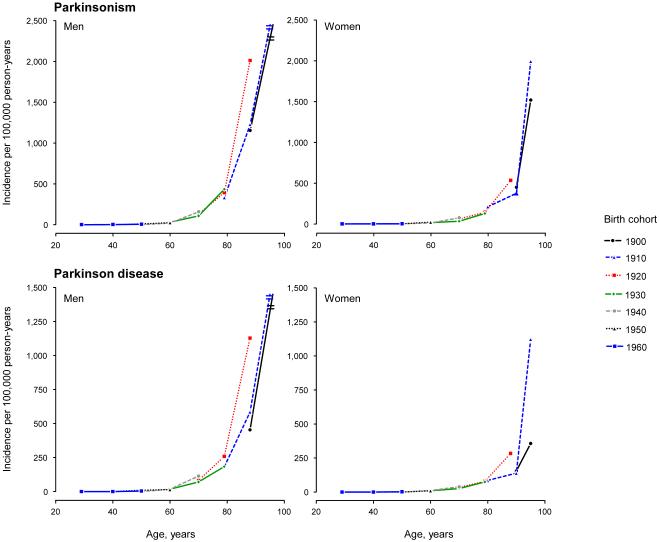
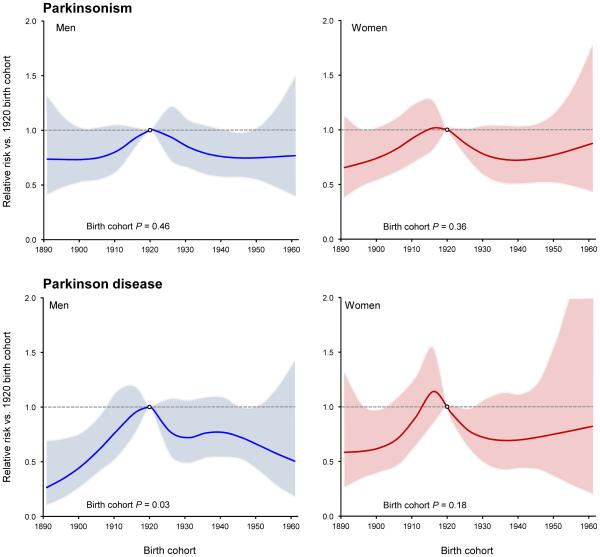
Results: Of 906 patients with parkinsonism, 501 were men, and the median age at onset was 74 years (interquartile range, 66-81 years). Of the 464 patients with PD, 275 were men, and the median age at onset was 73 years (interquartile range, 64-80 years). The overall incidence rates increased significantly over 30 years in men for both parkinsonism (relative risk [RR], 1.17 per decade; 95% CI, 1.03-1.33) and PD (RR, 1.24 per decade; 95% CI, 1.08-1.43). These trends were driven primarily by the older age groups. In particular, for men 70 years or older, incidence rates increased for both parkinsonism (RR, 1.24 per decade; 95% CI, 1.07-1.44) and PD (RR, 1.35 per decade; 95% CI, 1.10-1.65). The secular trends were not significant for women overall or in age strata. We observed an increased risk for both men and women born in the 1920 cohort (1915-1924). However, this birth cohort effect was significant only for PD and only in men.
Conclusions and revelance: Our study suggests that the incidence of parkinsonism and PD may have increased between 1976 and 2005, particularly in men 70 years and older. These trends may be associated with the dramatic changes in smoking behavior that took place in the second half of the 20th century or with other lifestyle or environmental changes. However, the trends could be spurious and need to be confirmed in other populations.
Figures
Comment in
-
Are We Ready for a Potential Increase in Parkinson Incidence?JAMA Neurol. 2016 Aug 1;73(8):919-21. doi: 10.1001/jamaneurol.2016.1599. JAMA Neurol. 2016. PMID: 27322659 No abstract available.
-
Trends in the Incidence of Parkinson Disease.JAMA Neurol. 2016 Dec 1;73(12):1497-1498. doi: 10.1001/jamaneurol.2016.3850. JAMA Neurol. 2016. PMID: 27749948 No abstract available.
-
Trends in the Incidence of Parkinson Disease.JAMA Neurol. 2016 Dec 1;73(12):1497. doi: 10.1001/jamaneurol.2016.3844. JAMA Neurol. 2016. PMID: 27749949 No abstract available.
-
Trends in the Incidence of Parkinson Disease-Reply.JAMA Neurol. 2016 Dec 1;73(12):1498-1499. doi: 10.1001/jamaneurol.2016.3847. JAMA Neurol. 2016. PMID: 27749957 No abstract available.
References
-
- Morozova N, O'Reilly EJ, Ascherio A. Variations in gender ratios support the connection between smoking and Parkinson's disease. Mov. Disord. 2008;23(10):1414–1419. - PubMed
-
- Rocca WA, Bower JH, McDonnell SK, Peterson BJ, Maraganore DM. Time trends in the incidence of parkinsonism in Olmsted County, Minnesota. Neurology. 2001;57(3):462–467. - PubMed
-
- Lix LM, Hobson DE, Azimaee M, Leslie WD, Burchill C, Hobson S. Socioeconomic variations in the prevalence and incidence of Parkinson's disease: a population-based analysis. J. Epidemiol. Community Health. 2010;64(4):335–340. - PubMed
Publication types
MeSH terms
Grants and funding
LinkOut - more resources
Full Text Sources
Other Literature Sources
Medical
