. 2016 Jul;18(7):803-813.
doi: 10.1038/ncb3376. Epub 2016 Jun 20.

PTP1B controls non-mitochondrial oxygen consumption by regulating RNF213 to promote tumour survival during hypoxia

Affiliations

PTP1B controls non-mitochondrial oxygen consumption by regulating RNF213 to promote tumour survival during hypoxia

Robert S Banh et al. Nat Cell Biol. 2016 Jul.

Abstract

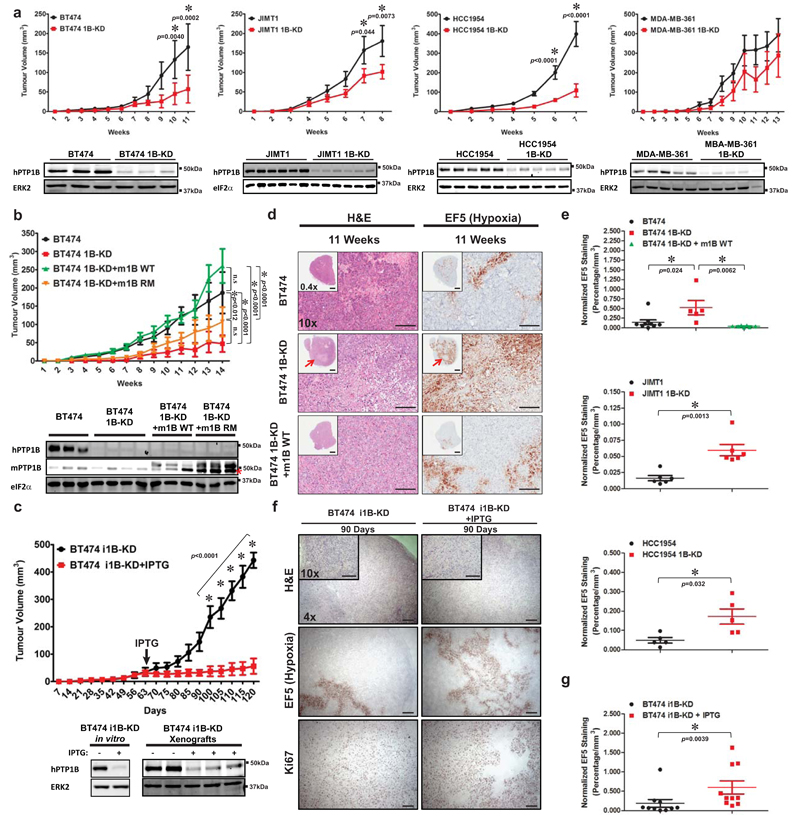
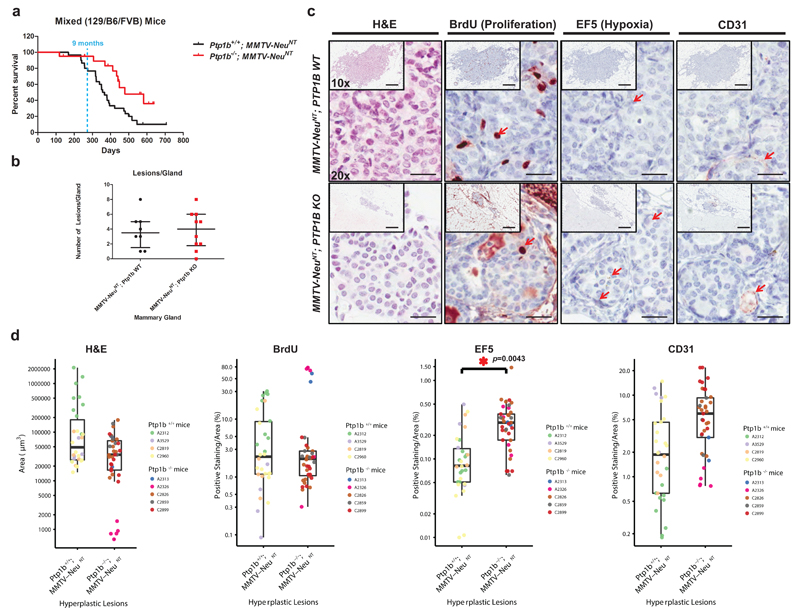
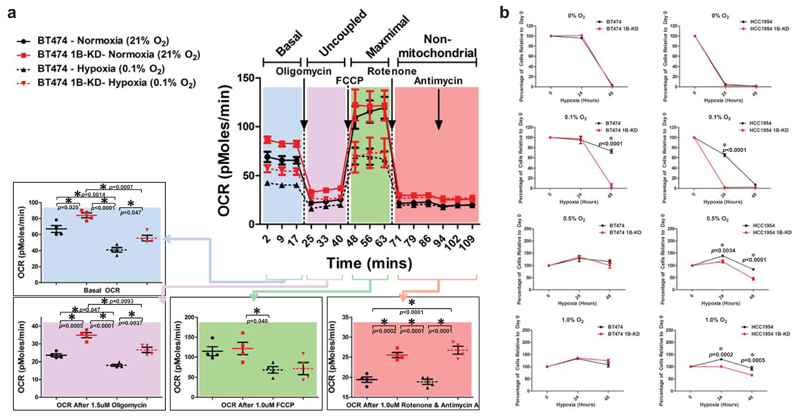
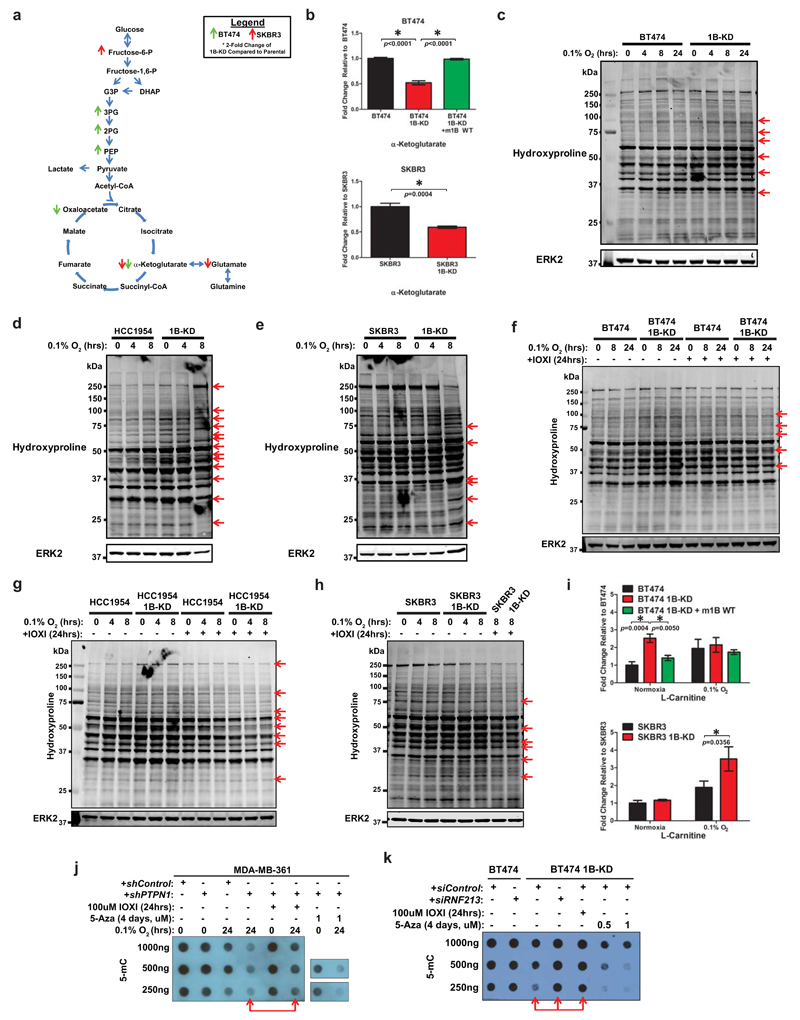
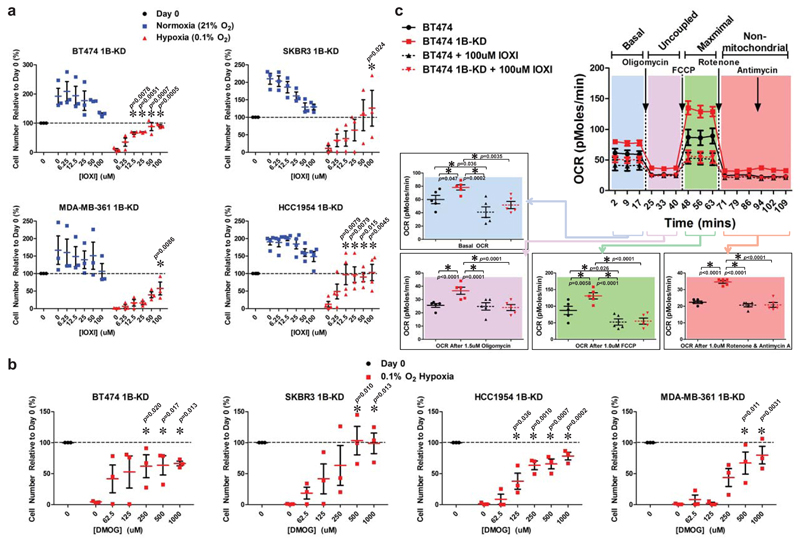
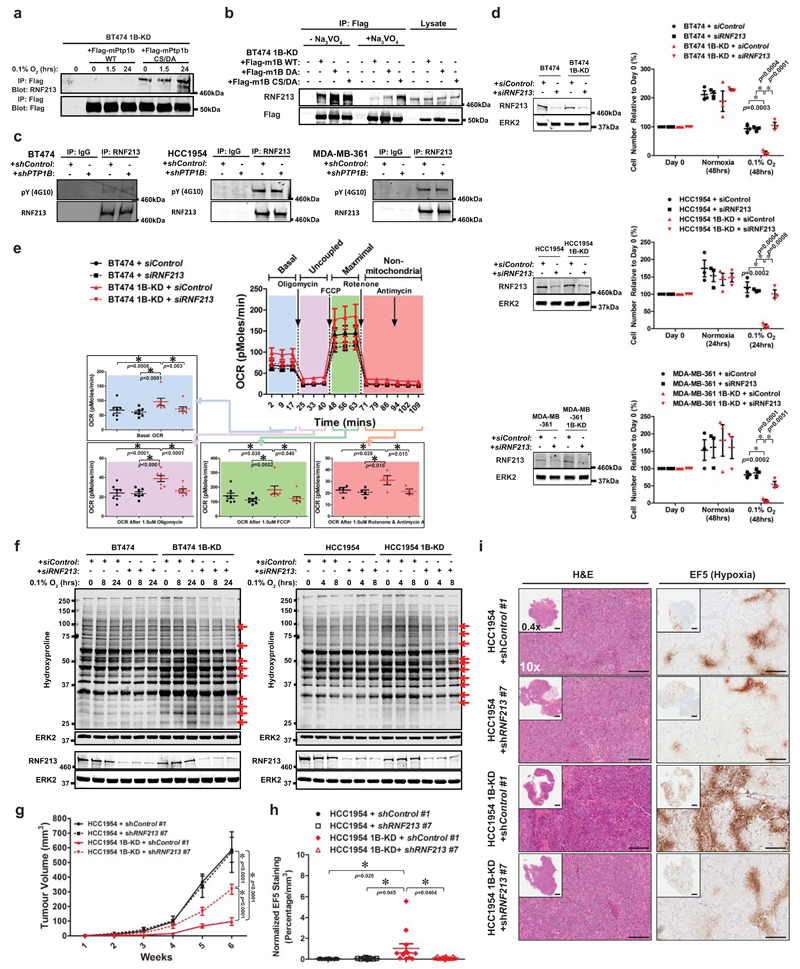
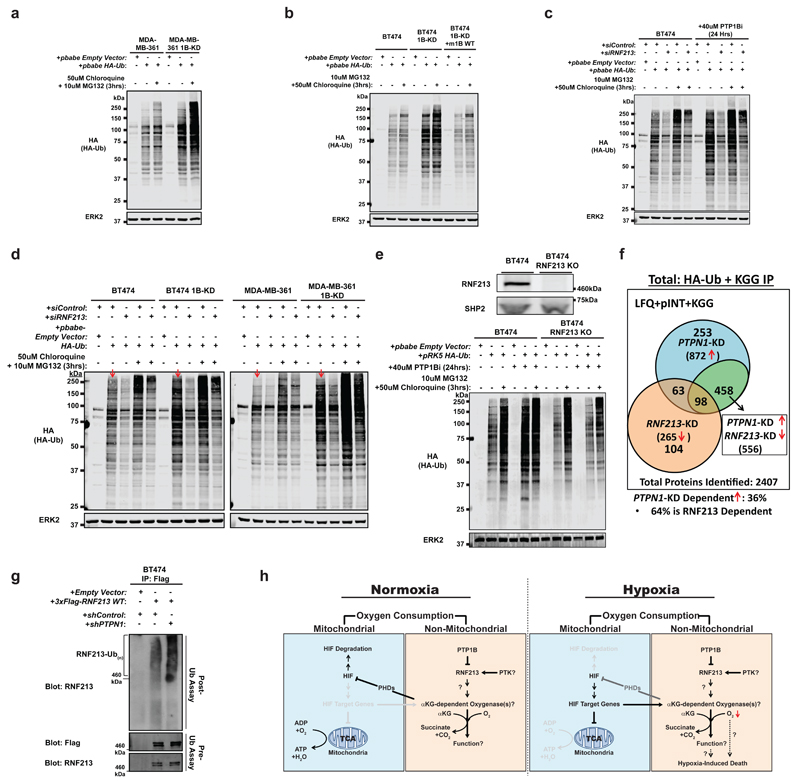
Tumours exist in a hypoxic microenvironment and must limit excessive oxygen consumption. Hypoxia-inducible factor (HIF) controls mitochondrial oxygen consumption, but how/if tumours regulate non-mitochondrial oxygen consumption (NMOC) is unknown. Protein-tyrosine phosphatase-1B (PTP1B) is required for Her2/Neu-driven breast cancer (BC) in mice, although the underlying mechanism and human relevance remain unclear. We found that PTP1B-deficient HER2(+) xenografts have increased hypoxia, necrosis and impaired growth. In vitro, PTP1B deficiency sensitizes HER2(+) BC lines to hypoxia by increasing NMOC by α-KG-dependent dioxygenases (α-KGDDs). The moyamoya disease gene product RNF213, an E3 ligase, is negatively regulated by PTP1B in HER2(+) BC cells. RNF213 knockdown reverses the effects of PTP1B deficiency on α-KGDDs, NMOC and hypoxia-induced death of HER2(+) BC cells, and partially restores tumorigenicity. We conclude that PTP1B acts via RNF213 to suppress α-KGDD activity and NMOC. This PTP1B/RNF213/α-KGDD pathway is critical for survival of HER2(+) BC, and possibly other malignancies, in the hypoxic tumour microenvironment.


Conflict of interest statement

The authors declare no competing financial interests.

Figures

Figure 1
Figure 1
Increased hypoxia and necrosis in PTP1B-deficient HER2+ breast tumours. a, Tumour growth from Control and 1B-KD HER2+ breast cancer cells injected subcutaneously into athymic nude mice. Independent mice were injected at the beginning of the experiment (n=10 biologically independent xenografts for all groups except MDA-MB-361 1B-KD, where n=8). Tumours were collected during the experiment for histology and IHC, leaving n=5 for the BT474 group at week 9-11, n=8 for the HCC1954 group at week 5-7, and MDA-MB-361 (n=9) and MDA-MB-361 1B-KD (n=7) at week 11-13. b, Tumour growth from mice injected with BT474 (n=10), BT474 1B-KD (n=7), BT474 1B-KD + mPtpn1 WT (n=9) or BT74 1B-KD + mPtpn1 RM (n=10) cells. All “n” values represent biologically independent xenografts. c, BT474 cells expressing IPTG-inducible PTPN1 shRNA (i1B-KD) were allowed to form small tumours. IPTG was added to drinking water of half of the mice (n=5 biologically independent xenografts). Immunoblots in a-c show PTP1B levels in individual tumours at the endpoint of each experiment; ERK2 or eIF2α are loading controls. Note the non-specific band (*) on the mPTP1B immunoblot in b. d, Representative sections from BT474 xenografts (from b) at 11 weeks post-injection, stained with H&E or EF5 (hypoxia). Insets and main images represent 0.4x or 10x magnifications, respectively. Red arrows indicate necrosis. e, EF5 staining area, normalized to tumour size, from BT474 (n=9), BT474 1B-KD (n=6), BT474 1B-KD + mPtpn1 WT (n=9), JIMT1 (n=6), JIMT1 1B-KD (n=6), HCC1954 (n=5) and HCC1954 1B-KD (n=5) xenografts (from a and b). f,Representative Ki67- or EF-stained sections (from c) at 90 days post-injection. g, EF5 staining area, normalized to tumour size, from BT474 i1B-KD tumours after 28 days treatment with or without IPTG. Each point (total n=10 per condition) represents one section from a biologically independent xenograft. Scale bars for 0.4x magnifications represent 1 mm, whereas they represent 250 μm for the 4x and 10x magnifications. Tumour growth curves and graphs (mean ± s.e.m.) were compared by two-tailed student t-test (e, g), one-way ANOVA (e) or two-way ANOVA (a-c), followed by Bonferroni post-hoc test.
Figure 2
Figure 2
PTP1B-deficiency sensitizes HER2+ BC cells to hypoxia in vitro. a, Survival of Control and 1B-KD HER2+ BC cells in 0.1% O2. Data shown represent mean values from three independent experiments; also see Supplementary Table 8). b, Colony formation by Control and 1B-KD HER2+ BC cells exposed for 24hrs to normoxia (21% O2) or hypoxia (0.2% O2) and then re-plated at the indicated cell numbers. Data are derived from one experiment with nine technical replicates. See Supplementary Table 8 for raw data. c, Survival in hypoxia (0.1% O2) of Control and 1B-KD BT474 and SKBR3 cells or cells expressing WT mPtpn1 cDNA or a phosphatase-impaired mutant (RM).Data shown represent mean values from three (BT474-derived lines) or four (SKBR3-derived lines) biologically independent experiments (also see Supplementary Table 8). d, Effect of an allosteric PTP1B inhibitor (PTP Inhibitor XXII) on parental HER2+ BC cancer cells maintained in normoxia (21% O2) or hypoxia (0.1% O2). Cells were counted after 24 (HCC1954 (n=5 for each group) and SKBR3 (n=3 for each group)) or 48 (BT474 and MDA-MB-361 (n=4 for each group and cell line) hour exposure to 0.1% O2, and mean values are shown. For each line, “n” represents the number of biologically independent experiments (also see Supplementary Table 8). Graphs represent mean ± s.e.m. and were compared by two-way (a-c) or one-way (d) ANOVA, followed by Bonferroni post-hoc test.
Figure 3
Figure 3
PTP1B-deficient BC cells die due to increased non-mitochondrial oxygen consumption. a, Oxygen consumption rate (OCR) in Control and 1B-KD BT474 cells after exposure to normoxia (21% O2) or hypoxia (0.1% O2) for 24h. Oligomycin inhibits coupled respiration; FCCP was added to measure maximal respiration; Rotenone & Antimycin A block electron transport, enabling measurement of non-mitochondrial oxygen consumption (n=4 biologically independent experiments for each group and condition; also see Supplementary Table 8). b, Effect of oxygen concentration on PTP1B-deficient HER2+ BC cells. Survival of Control and 1B-KD BT474 and HCC1954 cells in anoxia (0%) or at the indicated O2 concentrations (n=3 biologically independent experiments for each group and condition; also see Supplementary Table 8)). Graphs represent mean ± s.e.m., and were compared using One-way (a) or two-way ANOVA (b), followed by Bonferroni post-hoc test.
Figure 4
Figure 4
PTP1B-deficiency activates multiple α-ketoglutarate dioxygenases. a, Schematic showing differences in glycolytic and TCA metabolites in Control and 1B-KD BT474 and SKBR3 cells under normoxia; also see Supplementary Figure 6 and Supplementary Table 1. b, Levels of α-ketoglutarate in parental and 1B-KD BT474 and SKBR3 cells under normoxia; note that the effects of 1B depletion in BT474 cells are rescued by mPTP1B expression (n=5 biologically independent experiments for each group and condition). c-e, PTP1B-deficient HER2+ BC cells have global increase in hydroxylproline-containing proteins, consistent with enhanced α-KG dioxygenase activity. Anti-hydroxyproline immunoblots of Control and 1B-KD HER2+ BC cells exposed to 0.1% O2 hypoxia for the indicated times. f-h, Similar experiments as in c-e, but 100µM IOXI was used to assess α-KG-dioxygenase dependency of bands. Red arrows indicate differences in band intensities. ERK2 serves as a loading control. i, Carnitine levels in parental and PTP1B-deficient BT474 and SKBR3 cells as determined by LC-MS/MS (n=5 biologically independent experiments for each group and condition for each group, Supplementary Table 1) j & k, Reactivity of anti-5-methylcytosine (5-mC) antibodies with genomic DNA isolated from Control and 1B-KD MDA-MB-361 and BT474 cells in normoxia and/or hypoxia (as indicated), treated with or without IOXI. In k, BT474 cells were transfected with siControl or siRNF213, as indicated. 5-azacytidine was used as a positive control to block DNA methylation. Red arrows show that PTP1B-deficiency decreases anti-5 mC antibody reactivity, which is restored by IOXI treatment and/or RNF213-KD. Graphs (mean ± s.e.m.) were compared by one-tailed student t-test (i), two-tailed student t-test (b) or one-way ANOVA, followed by Bonferroni post-hoc test (b, i).
Figure 5
Figure 5
Generic αKG-dependent dioxygenase inhibitors normalize hypoxia hypersensitivity and non-mitochondrial oxygen consumption in PTP1B-deficient BC cells. a, Effects of the generic αKG-dependent dioxygenase inhibitor IOXI on survival of 1B-KD HER2+ BC cells in normoxia or hypoxia, as indicated. Cells were counted after 24 (HCC1954: n=4 biologically independent experiments for each condition, and SKBR3: n=3 biologically independent experiments for each condition) or 48 (BT474 and MDA-MB-361: n=3 for each condition) hour exposure to 0.1% O2 (also see Supplementary Table 8). b, Effect of generic αKG-dependent dioxygenase inhibitor DMOG on survival of the indicated Control and 1B-KD HER2+ BC cells in hypoxia. Cells were counted after 24 (HCC1954 and SKBR3) or 48 (BT474 and MDA-MB-361) hour exposure to 0.1% O2. Plots show mean ± s.e.m. from n=3 biologically independent experiments for each condition (also see Supplementary Table 8). c, OCR of parental and 1B-KD BT474 cells with or without overnight exposure to IOXI (100μM) or the indicated mitochondrial inhibitors (n=5 biologically independent experiments for each group and condition) All graphs represent mean ± s.e.m., and were compared by one-way ANOVA (a-c), followed by Bonferroni post-hoc test.
Figure 6
Figure 6
RNF213 is a novel PTP1B substrate that regulates oxygen consumption and survival of HER2+ BC cells in hypoxia. a, RNF213 immunoblot of PTP1B immunoprecipitates from BT474 cells expressing Flag-mPtp1B WT or a substrate-trapping mutant (CS/DA). b, Immunoblot showing co-immunoprecipitation of RNF213 and Flag-mPtp1B WT or the indicated substrate trapping mutant (DA and CS/DA) in the absence or presence of the active site tyrosine phosphatase inhibitor sodium orthovanadate (1mM). c, RNF213 is tyrosine phosphorylated in HER2+ BC cells. Anti-phosphotyrosine immunoblots of RNF213 immunoprecipitates from Control and 1B-KD HER2+ BC cells. Note that RNF213 is tyrosine phosphorylated, although its overall level of phosphorylation is similar in both lines. d, RNF213-knockdown protects 1B-KD HER2+ BC cells from hypoxia-induced death (n=3 biologically independent experiments for each group and condition; also see Supplementary Table 8). Cells were counted after 24 (HCC1954) or 48 (BT474 and MDA-MB-361) hour exposure to 0.1% O2. Immunoblots show substantial depletion of RNF213 72hr post-transfection with RNF213 siRNAs in normoxia, compared with Control siRNAs. e, RNF213-knockdown normalizes increased oxygen consumption in BT474 1B-KD cells (n=7 biologically independent experiments for each group in basal, uncoupled and maximal OCR; n=4 biologically independent experiments for non-mitochondrial OCR; also see Supplementary Table 8). f, RNF213-knockdown normalizes levels of hydroxyproline-containing proteins in 1B-KD HER2+ BC cells. Hydroxyproline bands in Control and 1B-KD HER2+ BC cells after exposure to 0.1% O2 for the indicated times are indicated by red arrows. g, Growth of HCC1954 + shControl #1 (n=12), HCC1954 + shRNF213 #7 (n=9), HCC1954 1B-KD + shControl #1 (n=12), HCC1954 1B-KD + shRNF213 #7 (n=11) tumours. h, EF5 staining area normalized to tumour size from HCC1954 + shControl #1 (n=12), HCC1954 + shRNF213 #7 (n=9), HCC1954 1B-KD + shControl #1 (n=13), HCC1954 1B-KD + shRNF213 #7 (n=12) tumours. i, Representative images of H&E and EF5 staining from Control and 1B-KD HCC1954 tumours expressing shControl #1 or shControl #7 (from g). All scale bars at 0.4x and 10x represent 1 mm or 250 μm, respectively. Graphs represent mean ± s.e.m., and were compared by one-way (d, e, h) or two-way (g) ANOVA, followed by Bonferroni post-hoc test.
Figure 7
Figure 7
PTP1B-deficiency, via RNF213, alters the ubiquitylome in HER2+ BC cells. Immunoblot of HA-ubiquitin (HA-Ub) from transfected cells treated with or without proteasomal (MG132) and lysosomal (chloroquine) inhibitors for 3hrs, as indicated. Control and 1B-KD MDA-MB-361 cells (a), BT474 cells (b) or BT474 cells treated with PTP1B inhibitor for 24 hrs (c) are shown. d, Control and 1B-KD BT474 and MDA-MB-361 cells were transfected with an HA-Ub expression construct and the indicated siRNAs, treated with or without proteasomal (MG132) and lysosomal (chloroquine) inhibitors for 3 hrs in normoxia, and subjected to anti-HA immunoblotting. Red arrows indicate ubiquitylation in Control and 1B-KD BT474 cells without proteasomal and lysosomal inhibitors. e, Parental BT474 and RNF213-KO cells were transfected with the HA-Ub expression construct, and treated with or without an allosteric PTP1B inhibitor, proteasomal and/or lysosomal inhibitor for the indicated times. Immunoblot shows lack of RNF213 in RNF213-KO BT474 cells generated by CRISPR/Cas9 technology. SHP2 and ERK2 serve as loading controls. f, Venn diagram indicating the number of proteins that show ≥1.5-fold increased ubiquitylation upon PTPN1-KD alone, ≤0.67-fold decreased ubiquitylation upon RNF213-KD alone or that are affected by knockdown of PTPN1 and RNF213, as determined by HA-Ub IP-MS and DiGly (KGG) enrichment. PTPN1-KD increased the ubiquitylation of ~40 % of the ubiquitylome, of which >60% were decreased by RNF213-KD. g, Auto-ubiquitylation activity of anti-Flag immunoprecipitates from Control and 1B-KD BT474 cells transfected with empty vector or 3xFlag-RNF213 WT under normoxic conditions. Anti-Flag and anti-RNF213 panels are loading controls h, Model for PTP1B regulation of tumour cell survival in hypoxia via RNF213. Active (black lines) and inactive (grey lines) pathways are shown during normoxia and hypoxia, as indicated. PTK: protein-tyrosine kinase; PHDs: prolyl-hydroxylase domain proteins; TCA: tricarboxylic acid cycle. See text for details.

References

    1. Bertout JA, Patel SA, Simon MC. The impact of O2 availability on human cancer. Nature reviews. Cancer. 2008;8:967–975. doi: 10.1038/nrc2540. - DOI - PMC - PubMed
    1. Papandreou I, Cairns RA, Fontana L, Lim AL, Denko NC. HIF-1 mediates adaptation to hypoxia by actively downregulating mitochondrial oxygen consumption. Cell metabolism. 2006;3:187–197. doi: 10.1016/j.cmet.2006.01.012. - DOI - PubMed
    1. Ma XM, Blenis J. Molecular mechanisms of mTOR-mediated translational control. Nature reviews. 2009;10:307–318. doi: 10.1038/nrm2672. - DOI - PubMed
    1. Laplante M, Sabatini DM. mTOR signaling in growth control and disease. Cell. 2012;149:274–293. doi: 10.1016/j.cell.2012.03.017. - DOI - PMC - PubMed
    1. Ron D, Walter P. Signal integration in the endoplasmic reticulum unfolded protein response. Nat Rev Mol Cell Biol. 2007;8:519–529. - PubMed

Publication types

MeSH terms

Substances