. 2016 Jun 21:7:12021.
doi: 10.1038/ncomms12021.

Treg engage lymphotoxin beta receptor for afferent lymphatic transendothelial migration

Affiliations

Treg engage lymphotoxin beta receptor for afferent lymphatic transendothelial migration

C Colin Brinkman et al. Nat Commun. .

Abstract

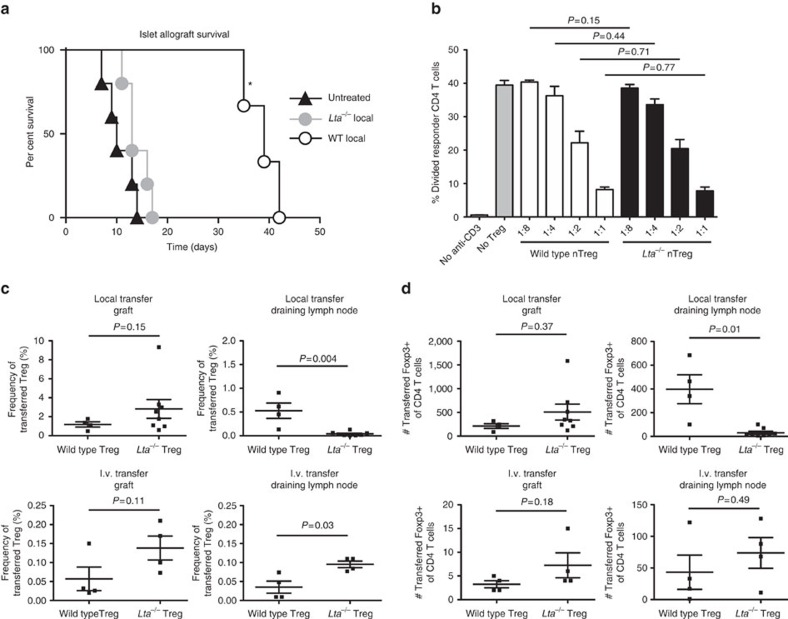
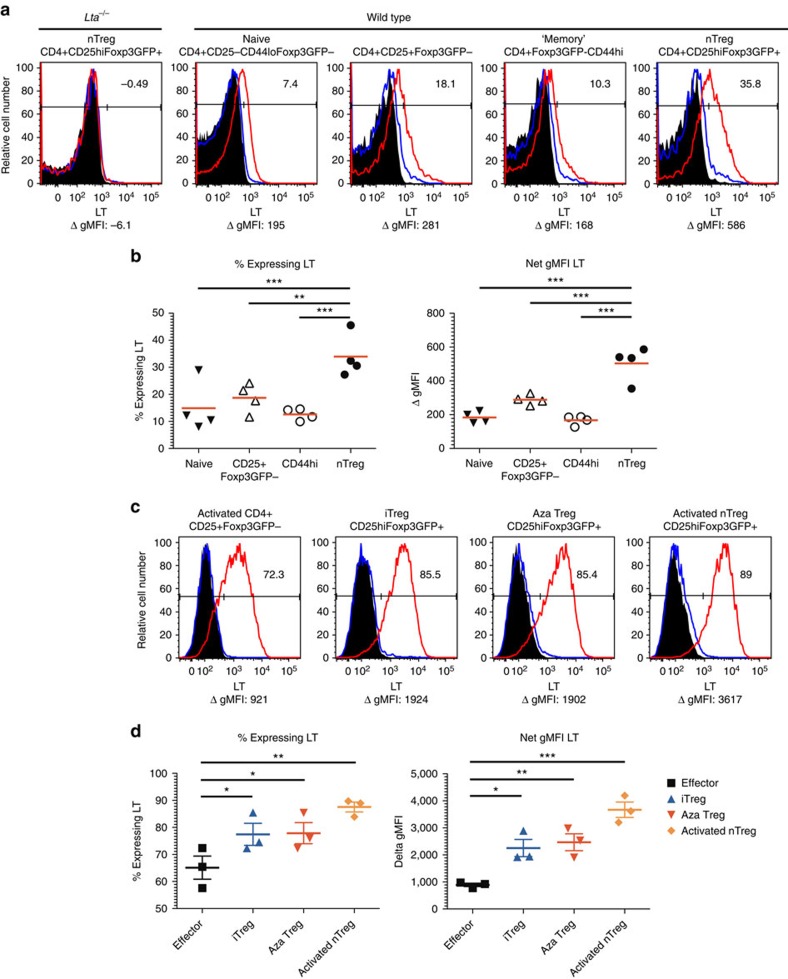
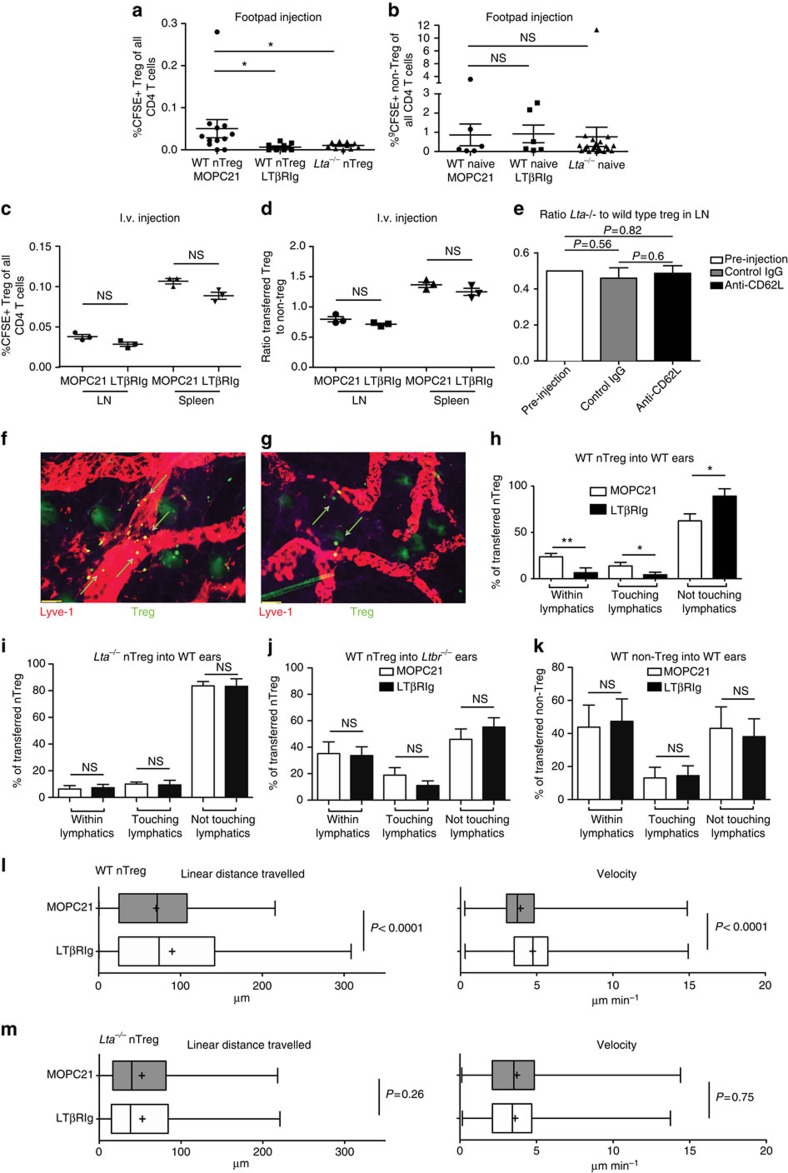
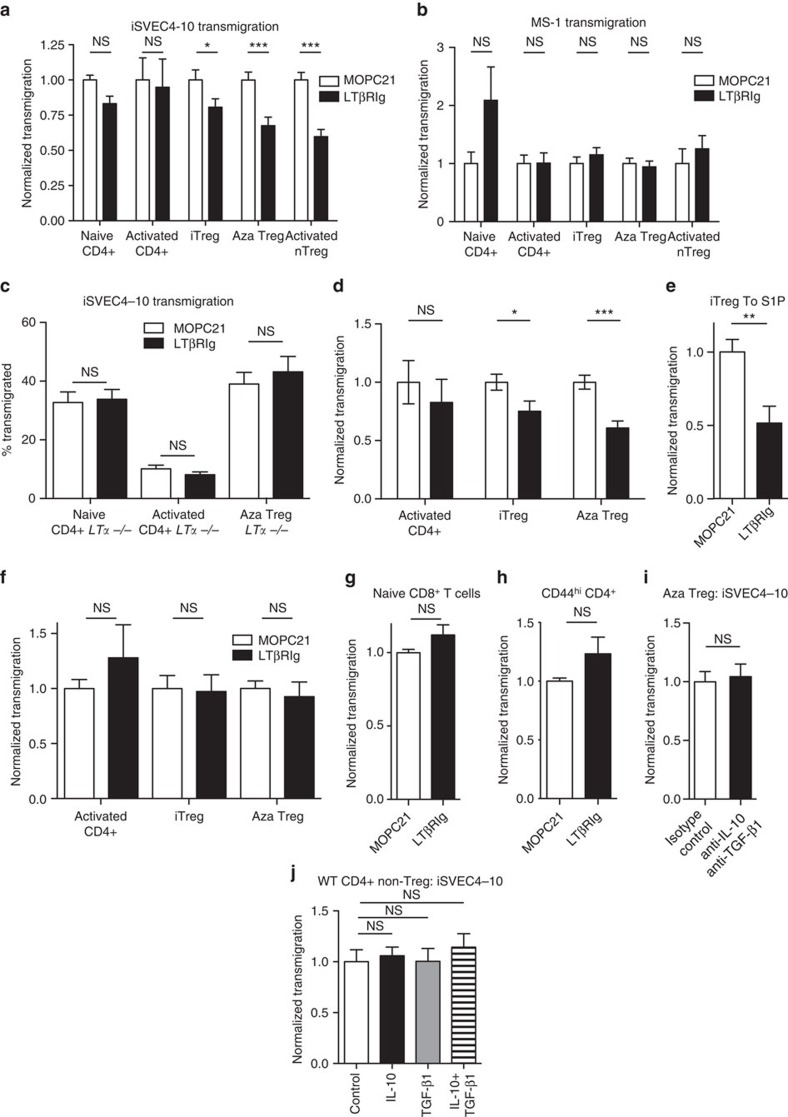
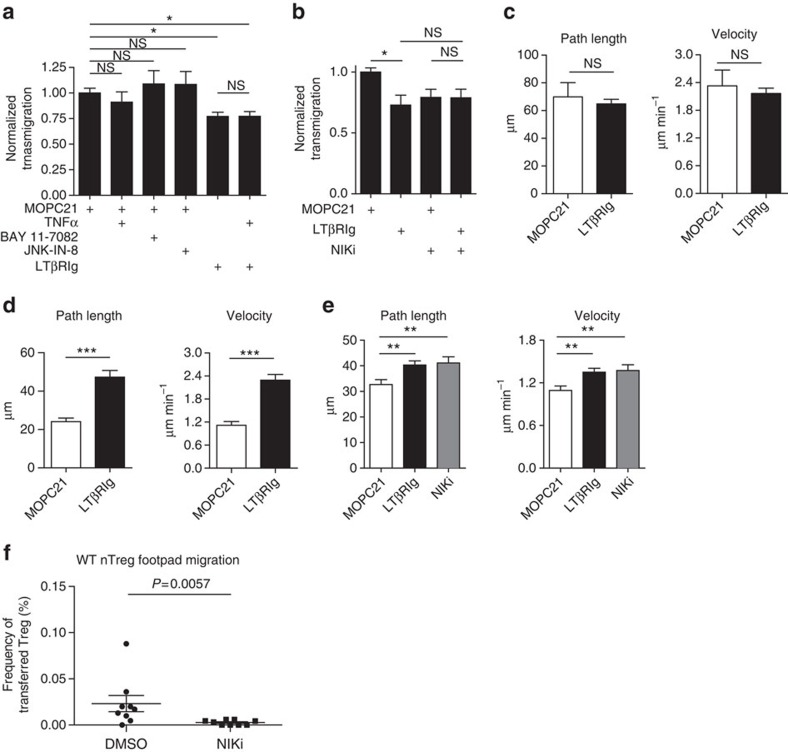
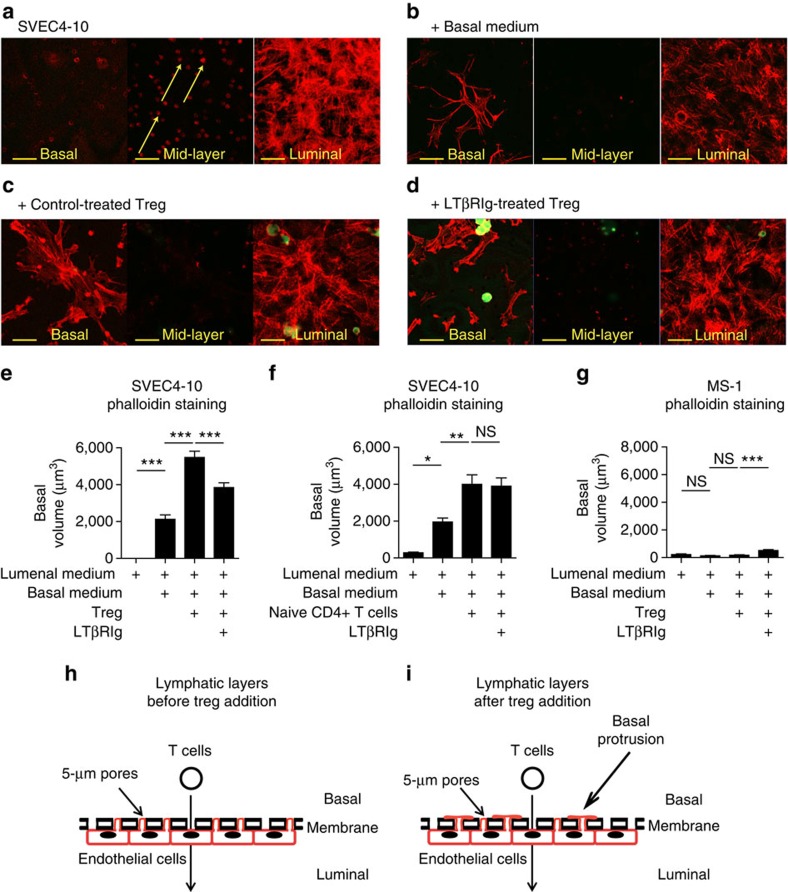
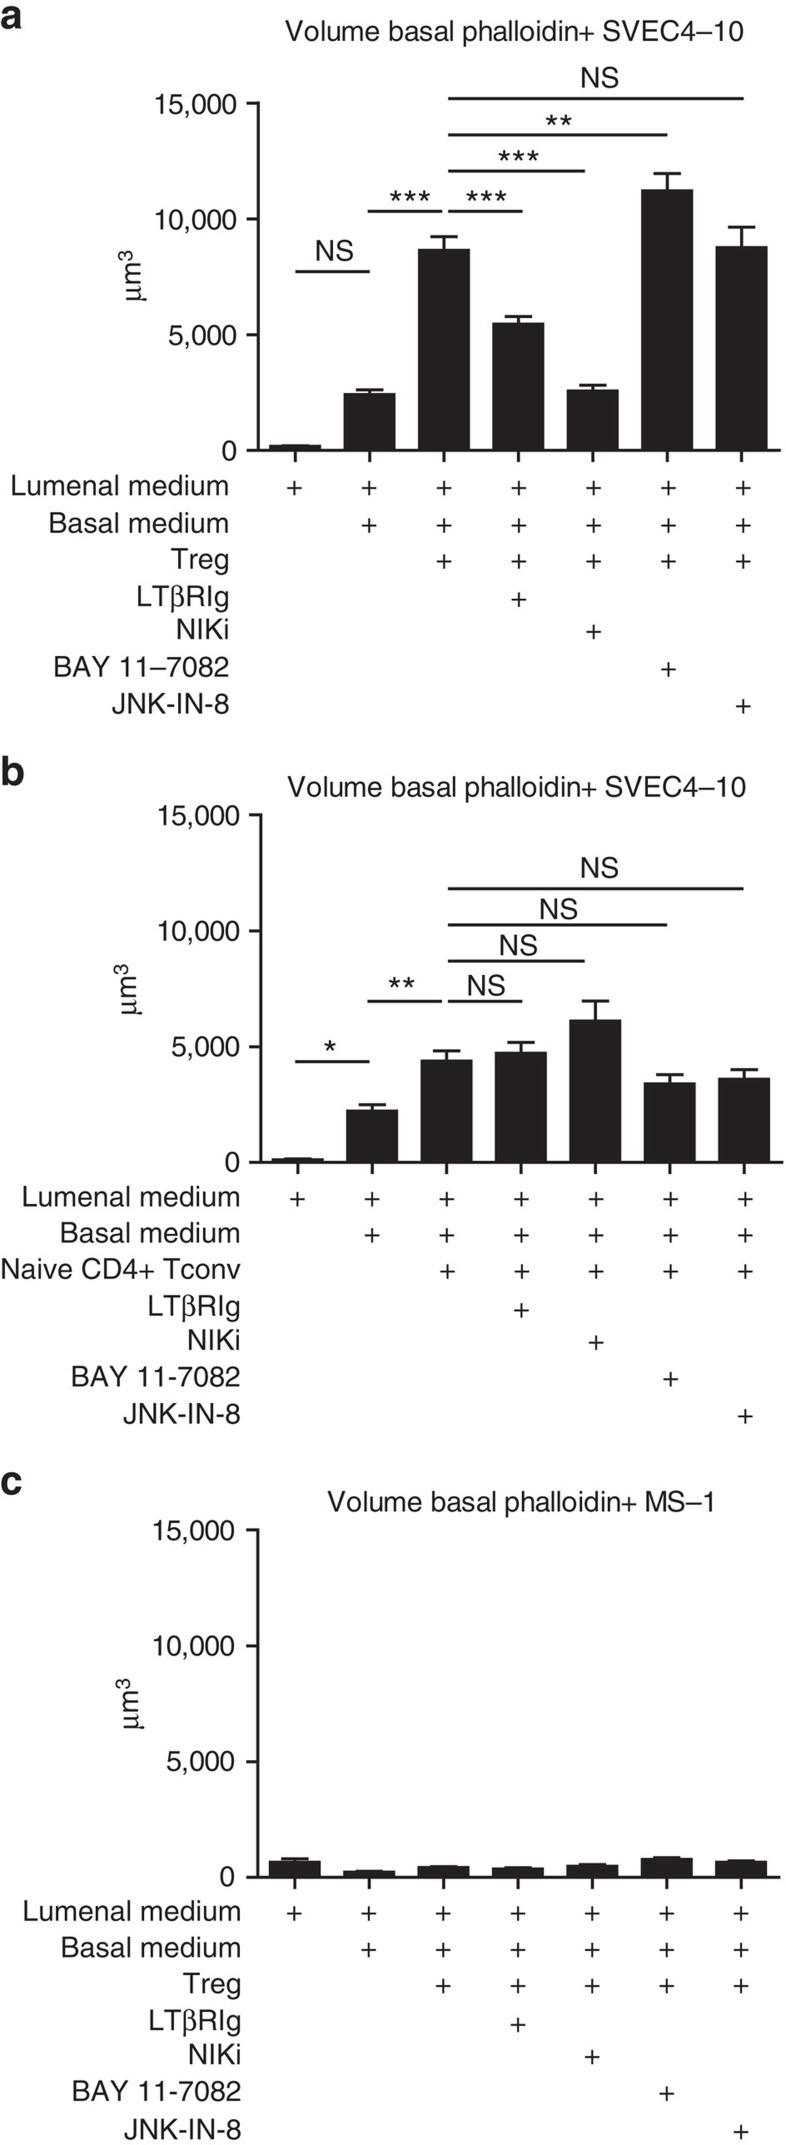
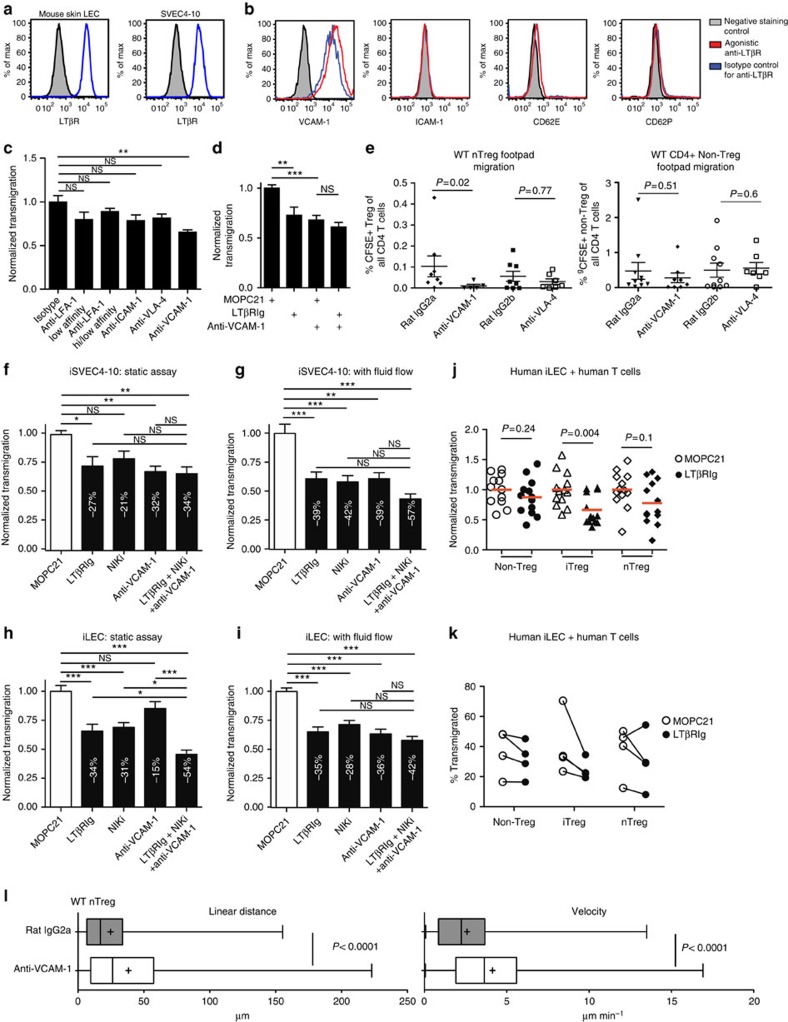
Regulatory T cells (Tregs) are essential to suppress unwanted immunity or inflammation. After islet allo-transplant Tregs must migrate from blood to allograft, then via afferent lymphatics to draining LN to protect allografts. Here we show that Tregs but not non-Treg T cells use lymphotoxin (LT) during migration from allograft to draining LN, and that LT deficiency or blockade prevents normal migration and allograft protection. Treg LTαβ rapidly modulates cytoskeletal and membrane structure of lymphatic endothelial cells; dependent on VCAM-1 and non-canonical NFκB signalling via LTβR. These results demonstrate a form of T-cell migration used only by Treg in tissues that serves an important role in their suppressive function and is a unique therapeutic focus for modulating suppression.


Figures

Figure 1
Figure 1. LT regulates Treg suppressor function in vivo but not in vitro.
(a) Survival curves for BALB/c islets transplanted into diabetic C57BL/6J recipients monitored by blood glucose. Five untreated from two pooled experiments, five Lta−/− Treg recipients from two pooled experiments, six WT Treg recipients from three pooled experiments. For multiple long-rank comparisons among three curves P=0.0167 was considered significant for individual comparisons. *Indicates WT is different than both Lta−/− and untreated by log-rank comparison (P=0.0007) and mean survival time: 38.7±1.3 days (s.e.m.), n=6 WT versus 14.00±1.1 days n=5 Lta−/−, P<0.01, and 38.7±1.3 days WT versus 10.6±1.3 days n=5 untreated, P<0.01, Tukey post tests of one-way analysis of variance. (b) In vitro suppression showing per cent of conventional CD4 responder T cells that divided under various conditions. Triplicate wells in each of two experiments, pooled. Statistics from unpaired Student's t-tests. (c,d) Islet and draining LN migration. Scatter plots show % (c) or number (d) of all CD4 T cells in indicated organ that are transferred Treg. Four recipients from two experiments for WT and eight from three experiments for Lta−/− Treg transfer. Statistics from Mann–Whitney non-parametric tests (bd). Error bars are s.e.m.
Figure 2
Figure 2. Tregs express more LTαβ than non-Treg.
(a,c) Flow cytometry for LT on freshly isolated (a) or 5-day cultured (c) CD4+ T cells from LN and spleen of Foxp3GFP (a,c) or Lta−/− Foxp3GFP mice (a) as indicated. Histograms gated on indicated populations. Black histograms: secondary antibody only; blue histograms: MOPC21 control primary; red histograms: LTβRIg stained. Numbers in plots indicate % specific positive staining in LTβRIg-stained minus MOPC21-stained samples. Numbers below are geometric mean fluorescence intensity (gMFI) of LTβRIg stained minus MOPC21 stained. Results typical of four experiments in a and three in c. (b,d) Summary data for %LT+ and gMFI LT from a and c, respectively. *P<0.05, **P<0.01, ***P<0.001 by repeated measures analysis of variance with Tukey post tests in b and d.
Figure 3
Figure 3. Tregs use LTαβ–LTβR for in vivo migration into lymphatics.
Resting WT C57BL/6J or Lta−/− CD25+CD4+ cells magnetic bead-enriched, CFSE-labelled, treated with LTβRIg or MOPC21, washed and injected into footpads (a,b), blood (c,d) or ear pinnae (fk). Popliteal LN and spleens procured 12 h later and analysed by flow cytometry. In all, 9–12 mice per cell type from 3–4 experiments in a; 6–22 mice from 2–4 experiments in b; 3 mice per group from 1 experiment representative of 2 (c,d). (e) Ratio e670 dye-labelled Lta−/− nTreg to CFSE-labelled WT nTreg in pre-injection mixture, or after i.v. injection followed by anti-CD62L or control mAb 18 h later. LN removed and analysed by flow cytometry 18 h later. P values from Wilcoxan signed rank test for pre-injection to control IgG and anti-CD62L; Student's t-test for control IgG versus anti-CD62L. In all, 1 pre-injection sample, 6 LN from control IgG treated animals and 9 LN from anti-CD62L-treated animals from 1 experiment, representative of 2. (f,g) Photomicrograph from ear pinna whole mount. LYVE-1+, lymphatics red; CFSE+ nTreg, green; × 20. Scale bar, 50 μm. MOPC21-treated (f); LTβRIg-treated (g). Green arrows indicate Treg in lymphatics (f) not in lymphatics (g). (hk) Summary of ear pinnae data indicating relationship of transferred T cells to lymphatics. In all, 20–250 cells per field from 18–19 × 20 objective fields per condition derived from 9 ears per condition from 3 independent experiments in h; and 15–200 cells per × 20 objective field from 4–10 fields from 3 ears per condition in 1 experiment each representative of 2 experiments in ik. (l,m) Summary of Treg movement in ears during 30 min of image acquisition. In all, 1,611 MOPC21- and 3,490 LTβRIg-treated WT nTreg, and 641 MOPC21- and 1,345 LTβRIg-treated Lta−/− nTreg tracked using Volocity 6.1.1. Results pooled from one × 20 field per ear, 2–3 ears per condition from 2–3 independent experiments. *P<0.05, **P<0.01 Kruskal–Wallis and Dunn's multiple comparison (a,b), Student's t-test (c,d,hm). (ak) Error bars are s.e.m. (l,m) Box and whiskers plots showing minimum, maximum, mean (+), median (bar), 25th and 75th percentiles. NS, not significant.
Figure 4
Figure 4. Treg uses LTαβ–LTβR for in vitro transmigration across a LEC line in vitro.
(aj) Indicated T cells migrated across iSVEC4-10 (a,ce,gj), MS-1 (b), plastic (f), for 4 h to CCL19 (ac,fj), CCL5 (d) or S1P (e) in the presence of LTβRIg or control MOPC21. Migrated T cells in lower wells enumerated and transmigration normalized to MOPC21 shown (aj). A total of 9–15 individual transwells per condition from 3–4 experiments (ad,f), 8 individual transwells per condition from 2 experiments (e), 10 individual transwells per condition pooled from 2 experiments (g), 5 individual transwells per condition from 2 experiments (h), 8 individual transwells per condition from 2 experiments (i) and 7 individual transwells per condition from 2 experiment (j). *P<0.05, **P<0.01, ***P<0.001 from unpaired two-tailed Student's t-tests (ai) and Bonferroni multiple comparison tests in j. Error bars are s.e.m. NS, not significant.
Figure 5
Figure 5. Treg migration through and two-dimensional interactions with LEC depend on LTβR-dependent non-canonical NFκB signalling in LEC.
(a,b) Aza Treg migrated across iSVEC4-10 to CCL19 in the presence of LTβRIg or control MOPC21. iSVEC4-10 pretreated as indicated. Migration normalized to MOPC21. Six transwells per condition from two experiments in a and nine transwells per condition from three experiments in b. (c,d,e) Aza Treg two-dimensional movement on iSVEC4-10 10 min (c) or 3 h (d,e) after Treg addition in the presence of CCL19 gradient. Images collected once per minute for 30 min. A total of 78 tracked cells MOPC21, 117 LTβRIg from 1 experiment representative of 4 in c; 100 tracked cells MOPC21, 87 LTβRIg from 1 experiment representative of 2 in d; 155 tracked cells MOPC21, 151 LTβRIg, 118 NIKi from 1 experiment representative of 2 in e. (f) Resting WT C57BL/6J CD25+CD4+ nTreg enriched by magnetic beads, labelled with CFSE, mixed with DMSO or NIKi in DMSO and injected into footpads. Popliteal LN procured 12 h later and analysed by flow cytometry. Nine mice for each treatment from two experiments in f, *P<0.05, **P<0.01, ***P<0.001 by Bonferroni post test of one-way analysis of variance in a,b and e, unpaired two-tailed Student's t-tests in c and d and Mann–Whitney in f. Error bars are s.e.m. NS, not significant.
Figure 6
Figure 6. Tregs induce lamellipodia-like structures on the basal surface of lymphatic endothelium.
(ad) Representative images of Aza Treg in iSVEC4-10 layers. CFSE+ Treg in green; phalloidin in red; × 63. Yellow scale bar, 28 μm. Yellow arrows indicate thin f-actin+ protrusions invading the pores of the membrane and approaching its basal surface as described in the text. (e) Summary of all fields in ad showing volume of phalloidin+CFSE negative structures per field in μm3. (f) Same as e but with naive non-Treg CD4 T cells. (g) Same as e with iMS-1 instead of iSVEC4-10. (eg) A total of 20–40 fields per condition from 1 experiment representative of 2–3 experiments. (h,i) Cartoons depicting endothelial protrusion growth displayed in xz plane view. *P<0.05, **P<0.01, ***P<0.001 by Bonferroni's post test of one-way analysis of variance. Error bars are s.e.m. NS, not significant.
Figure 7
Figure 7. Treg modulation of iSVEC4-10 basal protrusions is mediated by signals via NIK.
(ac) Summary volumes of phalloidin+CFSE negative structures per × 63 field 4 h after addition of Aza Treg (a,c) or naive non-Treg CD4+ T cells (b) to iSVEC4-10 (a,b) or iMS-1 (c). A total of 20–40 fields per condition from 1 experiment representative of 2–3 experiments. *P<0.05, **P<0.01, ***P<0.001 by Bonferroni post test of one-way ANOVA. Error bars are s.e.m. NS, not significant.
Figure 8
Figure 8. Treg transmigration through lymphatic endothelium depends on VCAM-1 in vitro and in vivo.
(a) SVEC4-10 or mouse skin LEC: grey histograms, isotype control; blue: LTβR. Representative of 3 experiments. (b) SVEC4-10 cultured 48 h, with or without agonistic 1 μg ml−1 anti-LTβR last 24 h, stained for indicated molecules. Isotype control, black histograms; indicated antibody, blue (control-treated) and red (anti-LTβR-treated). Representative of two experiments. (c,d) Aza Treg migrated across iSVEC4-10 to CCL19. SVEC4-10 (anti-ICAM-1 and anti-VCAM-1) or Treg (anti-LFA-1, anti-VLA-4, MOPC21 and LTβRIg) pretreated as indicated. Migration normalized to control. Six transwells from two experiments in c and nine transwells from three experiments in d. (e) Footpad migration. CFSE-labelled WT nTreg or naive CD4+ non-Treg co-injected with Rat IgG2a or anti-VCAM-1 or pretreated with Rat IgG2b or anti-VLA-4. Per cent CFSE+ cells of popliteal LN CD4 T cells shown. Treg: 5–8 mice from 3 experiments; non-Treg: 7–10 mice from 3 experiments. (fi) Aza Treg transwell migration across iSVEC4-10 (f,g) and primary mouse iLEC (h,i). Under static conditions (f,h) and with fluid flow (g,i). T cells (MOPC21 and LTβRIg) or endothelial cells (NIKi and anti-VCAM-1) treated as indicated. White numerals indicate % decline compared with MOPC21. Migration normalized to MOPC21. Results from nine transwells per condition from three experiments in f and g, and eight transwells from two experiments in h and i. (j,k) Transwell migration of human T cells across human skin iLEC to murine CCL19. T cells treated with MOPC21 or murine LTβRIg. (j) Results by well, 13 per condition from 4 experiments, red bars denote mean. (k) Results by human T-cell donor, control paired with LTβRIg. (l) Summary of Treg movement in ears during 30 min of image acquisition. In all, 563 Rat IgG2a- and 511 anti-VCAM-1-treated cells tracked using Volocity 6.1.1. Results from 2–3 ears per condition, 1 × 20 field per ear, from 2 experiments. Box and whiskers plot showing minimum, maximum, mean (+), median (bar), 25th and 75th percentiles. *P<0.05, **P<0.01, ***P<0.001 by Bonferroni post test of one-way analysis of variance (c,d,fi), unpaired Student's t-test (j,l) and Mann–Whitney non-parametric test (e). Error bars are s.e.m in cg,h,i. NS, not significant.

References

    1. Burrell B. E., Nakayama Y., Xu J., Brinkman C. C. & Bromberg J. S. Regulatory T cell induction, migration, and function in transplantation. J. Immunol. 189, 4705–4711 (2012). - PMC - PubMed
    1. Zhang N. et al.. Regulatory T cells sequentially migrate from inflamed tissues to draining lymph nodes to suppress the alloimmune response. Immunity 30, 458–469 (2009). - PMC - PubMed
    1. Ochando J. C. et al.. Lymph node occupancy is required for the peripheral development of alloantigen-specific Foxp3+ regulatory T cells. J. Immunol. 174, 6993–7005 (2005). - PubMed
    1. Bai Y. et al.. L-selectin-dependent lymphoid occupancy is required to induce alloantigen-specific tolerance. J. Immunol. 168, 1579–1589 (2002). - PubMed
    1. Tomura M. et al.. Activated regulatory T cells are the major T cell type emigrating from the skin during a cutaneous immune response in mice. J. Clin. Invest. 120, 883–893 (2010). - PMC - PubMed

Publication types

MeSH terms

Substances