. 2016 Jun 21:7:11872.
doi: 10.1038/ncomms11872.

Uncertainty in soil data can outweigh climate impact signals in global crop yield simulations

Affiliations

Uncertainty in soil data can outweigh climate impact signals in global crop yield simulations

Christian Folberth et al. Nat Commun. .

Abstract

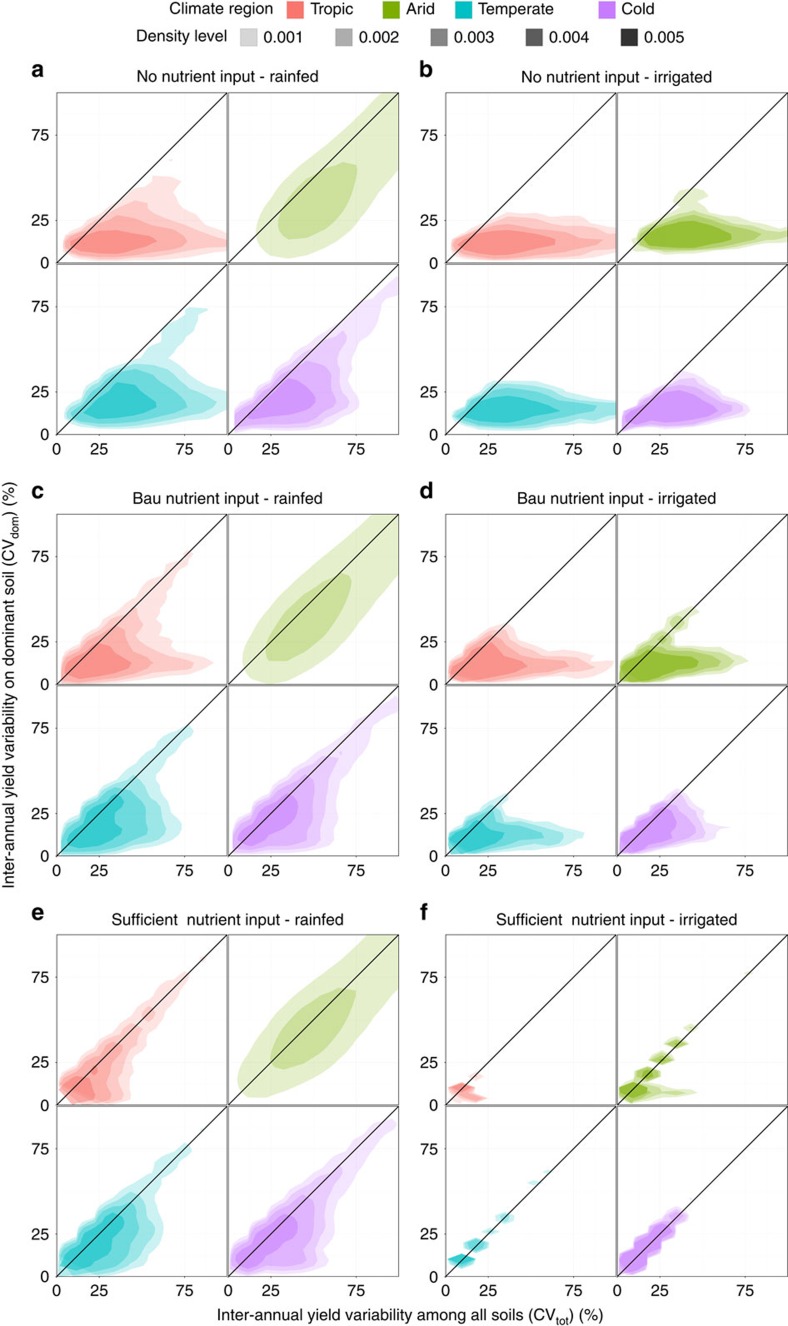
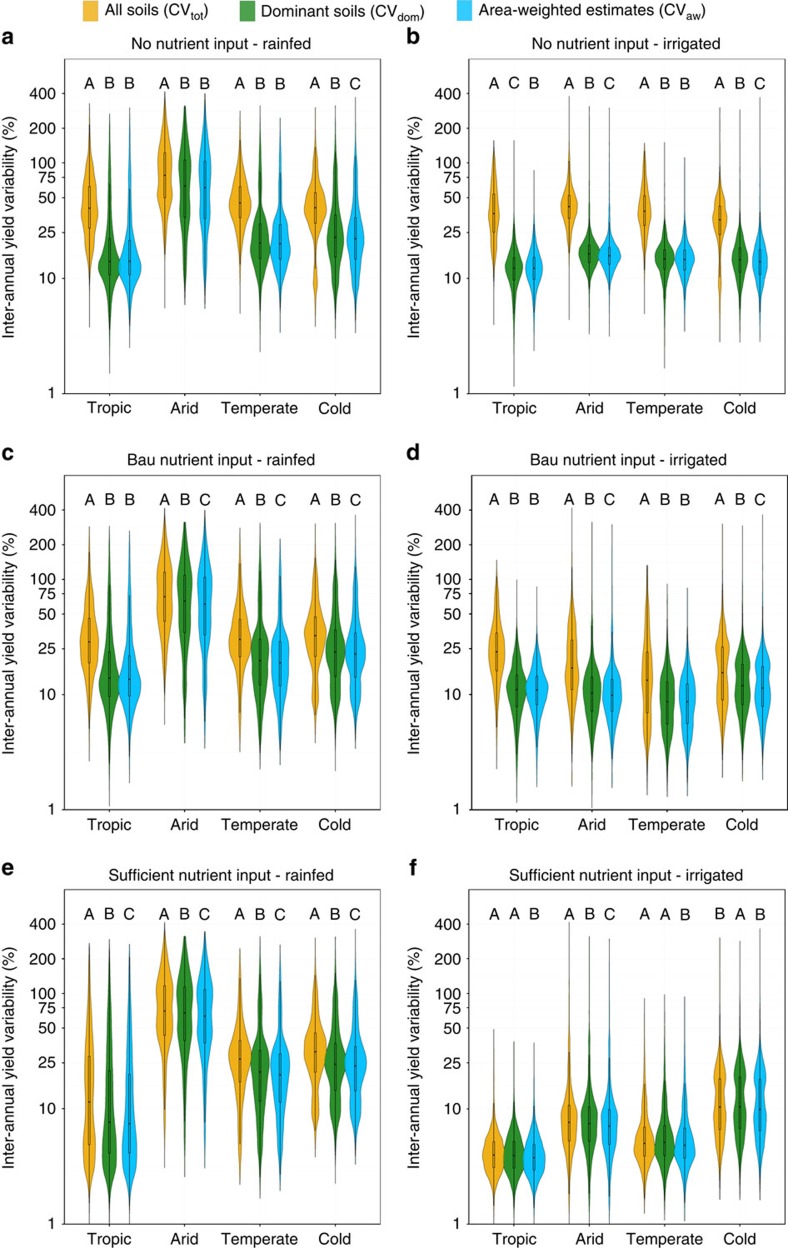
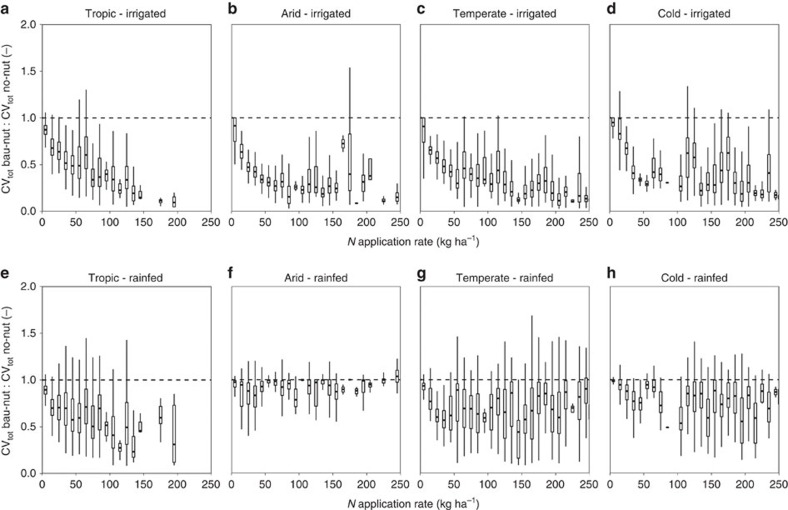
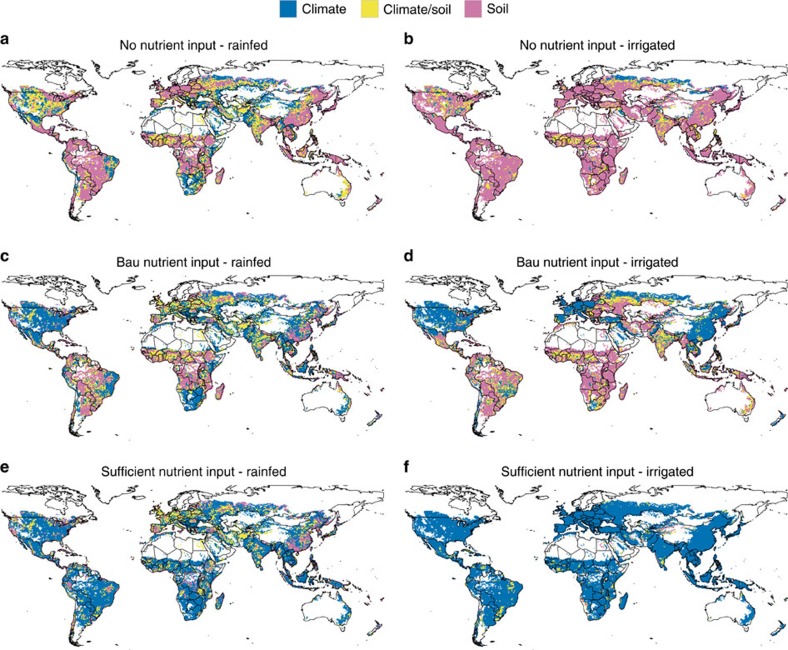
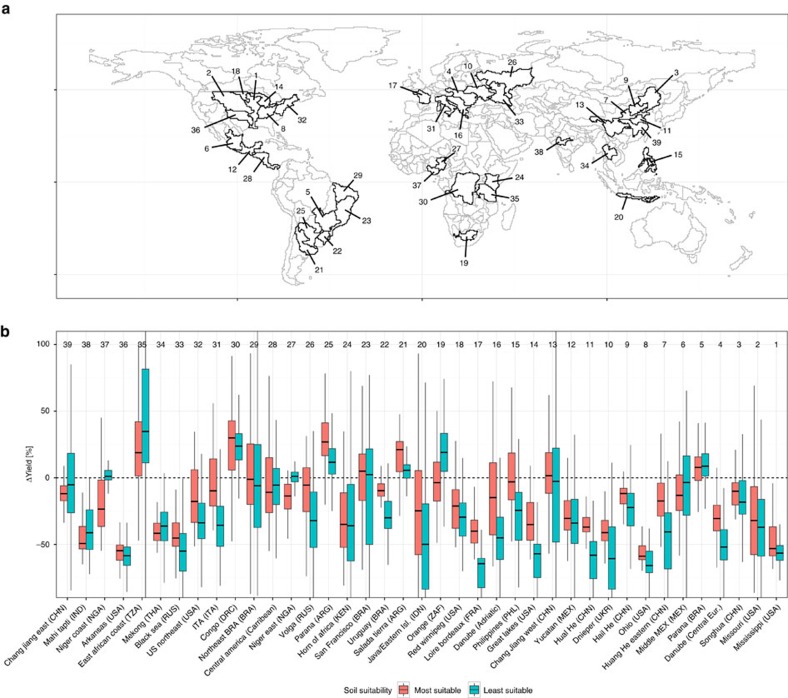
Global gridded crop models (GGCMs) are increasingly used for agro-environmental assessments and estimates of climate change impacts on food production. Recently, the influence of climate data and weather variability on GGCM outcomes has come under detailed scrutiny, unlike the influence of soil data. Here we compare yield variability caused by the soil type selected for GGCM simulations to weather-induced yield variability. Without fertilizer application, soil-type-related yield variability generally outweighs the simulated inter-annual variability in yield due to weather. Increasing applications of fertilizer and irrigation reduce this variability until it is practically negligible. Importantly, estimated climate change effects on yield can be either negative or positive depending on the chosen soil type. Soils thus have the capacity to either buffer or amplify these impacts. Our findings call for improvements in soil data available for crop modelling and more explicit accounting for soil variability in GGCM simulations.


Figures

Figure 1
Figure 1. Coefficient of variation of maize yields in each grid cell for all soil types compared with the dominant soil only.
Each panel depicts the coefficient of variation (CV) for a different nutrient and water management scenario: (a) no nutrient application and rainfed water supply, (b) no nutrient application and sufficient irrigation water supply, (c) business-as-usual (bau) nutrient application and rainfed water supply, (d) bau nutrient application and sufficient irrigation water supply, (e) sufficient nutrient application and rainfed water supply and (f) sufficient nutrient application and sufficient irrigation water supply (see Table 3 for details). The colours in the four subpanels displayed for each crop management scenario indicate the major Koeppen–Geiger climate regions (Supplementary Fig. 1 and Supplementary Table 1) tropic (red), arid (green), temperate (blue) and cold (purple). The size and shading of polygons of the same colour indicates levels of density corresponding to the bins shown in the density scale. The percentages of grid cells below the 1:1 line are shown in Table 1. Grid cells with only one reported soil type, arctic climate or without reported maize harvested area were excluded.
Figure 2
Figure 2. Violin plots of the coefficient of variation of maize yields for various soil pools and weightings.
Coefficients of variation (CV) are shown for all soil types (CVtot), the dominant soil type only (CVdom) or the area-weighted CV across all soil types in a grid cell based on each soil's extent (CVaw). Each panel shows a nutrient and water management scenario with (a) no nutrient application and rainfed water supply, (b) no nutrient application and sufficient irrigation water supply, (c) business-as-usual (bau) nutrient application and rainfed water supply, (d) bau nutrient application and sufficient irrigation water supply, (e) sufficient nutrient application and rainfed water supply and (f) sufficient nutrient application and sufficient irrigation water supply (see Table 3 for details). The violins represent the density of values along the y axis and are of equal area. The capital letters A–C indicate whether the samples are significantly different according to a Tukey HSD test within each climate region and management scenario. The complete results of statistical analyses are presented in Supplementary Table 2. Grid cells with only one reported soil type, arctic climate or without reported maize harvested area were excluded.
Figure 3
Figure 3. Boxplots showing the ratio of the coefficient of variation in the whole soil set for the business as usual compared with the no nutrient input scenario.
Ratios of the coefficient of variation for the whole soil set (CVtot) for the business as usual (bau-nut) to no nutrient input (no-nut) scenarios are depicted for various Koeppen–Geiger climate regions and water management scenarios: (a) tropic and sufficient irrigation water supply, (b) arid and sufficient irrigation water supply, (c) temperate and sufficient irrigation water supply, (d) cold and sufficient irrigation water supply, (e) tropic and rainfed water supply, (f) arid and rainfed water supply, (g) temperate and rainfed water supply and (h) cold and rainfed water supply. The dashed line at intersect y=1 serves as a reference for CVtot values in the no-nut scenario. Fertilizer application rates were binned in steps of 10 kg N ha−1. The extent of the x axis was limited to a maximum of 250 kg N ha−1 for better readability. Details on the fertilizer application rates are provided in the Methods section (Table 3) and Supplementary Fig. 3. Supplementary Fig. 1 shows the major Koeppen–Geiger climate regions as defined in Supplementary Table 1. CVtot, the coefficient of variation for the whole soil set.
Figure 4
Figure 4. Grid cells in which climate or soil are dominating yield variability.
Climate variability corresponds to CVdom in Fig. 1 while yield variability due to choice of soil (CVsoil) was computed from the 10-year means of yields from all respective soil types in each grid (see the Methods for details). Climate is considered to govern yield variability if CVdom/CVsoil>30% (blue colour), soil is considered to govern yield variability if CVsoil/CVdom>30% (magenta colour). Climate and soil are considered to govern yield variability jointly if they are in a range of ±30% of the respective larger value (yellow colour). Each panel represents a nutrient and water management scenario with (a) no nutrient application and rainfed water supply, (b) no nutrient application and sufficient irrigation water supply, (c) business-as-usual (bau) nutrient application and rainfed water supply, (d) bau nutrient application and sufficient irrigation water supply, (e) sufficient nutrient application and rainfed water supply, and (f) sufficient nutrient application and sufficient irrigation water supply (see Table 3 for details). Percentages of grid cells falling into either one of the categories are shown in Table 2. Grid cells with only one reported soil type, arctic climate or without reported maize harvested area were excluded.
Figure 5
Figure 5. Projected percentage change in maize yields by the 2050s in the 39 largest food production units (FPUs).
(a) FPUs as defined by intersecting water basins with major administrative boundaries. (b) Relative change in maize yields for the presently most or least suitable soil type in each grid cell for the rainfed business-as-usual nutrient input scenario (bau-nut-rf; Table 3). The climate projection is based on HadGEM2-ES for RCP8.5 and is compared here with present-day climate data (see the Methods for details). Each of the selected FPUs comprises more than 106 ha of harvested maize area. Ranking in terms of decreasing cultivated maize area is indicated by the order from right (largest) to left (smallest).

References

    1. Fader M., Rost S., Müller C., Bondeau A. & Gerten D. Virtual water content of temperate cereals and maize: present and potential future patterns. J. Hydrol. 384, 218–231 (2010).
    1. Liu J. et al.. A global and spatially explicit assessment of climate change impacts on crop production and consumptive water use. PLoS ONE 8, e57750 (2013). - PMC - PubMed
    1. Balkovič J. et al.. Global wheat production potentials and management flexibility under the representative concentration pathways. Glob. Planet. Chang 122, 107–121 (2014).
    1. Elliott J. et al.. The parallel system for integrating impact models and sectors (pSIMS). Environ. Model. Softw 62, 509–516 (2014).
    1. Folberth C. et al.. Effects of ecological and conventional agricultural intensification practices on maize yields in sub-Saharan Africa under potential climate change. Environ. Res. Lett. 9, 044004 (2014).

Publication types