. 2016 Aug;171(4):2468-82.
doi: 10.1104/pp.16.00599. Epub 2016 Jun 20.

Light Remodels Lipid Biosynthesis in Nannochloropsis gaditana by Modulating Carbon Partitioning between Organelles

Affiliations

Light Remodels Lipid Biosynthesis in Nannochloropsis gaditana by Modulating Carbon Partitioning between Organelles

Alessandro Alboresi et al. Plant Physiol. 2016 Aug.

Abstract

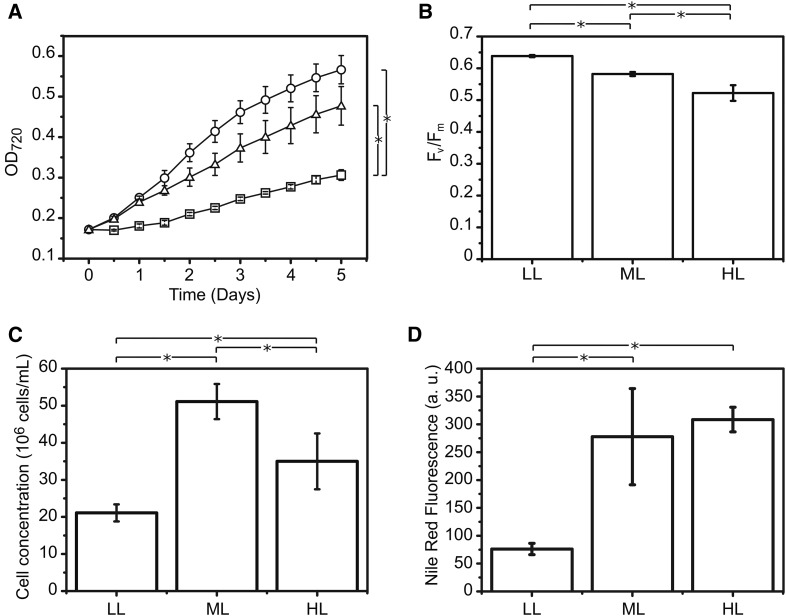
The seawater microalga Nannochloropsis gaditana is capable of accumulating a large fraction of reduced carbon as lipids. To clarify the molecular bases of this metabolic feature, we investigated light-driven lipid biosynthesis in Nannochloropsis gaditana cultures combining the analysis of photosynthetic functionality with transcriptomic, lipidomic and metabolomic approaches. Light-dependent alterations are observed in amino acid, isoprenoid, nucleic acid, and vitamin biosynthesis, suggesting a deep remodeling in the microalgal metabolism triggered by photoadaptation. In particular, high light intensity is shown to affect lipid biosynthesis, inducing the accumulation of diacylglyceryl-N,N,N-trimethylhomo-Ser and triacylglycerols, together with the up-regulation of genes involved in their biosynthesis. Chloroplast polar lipids are instead decreased. This situation correlates with the induction of genes coding for a putative cytosolic fatty acid synthase of type 1 (FAS1) and polyketide synthase (PKS) and the down-regulation of the chloroplast fatty acid synthase of type 2 (FAS2). Lipid accumulation is accompanied by the regulation of triose phosphate/inorganic phosphate transport across the chloroplast membranes, tuning the carbon metabolic allocation between cell compartments, favoring the cytoplasm, mitochondrion, and endoplasmic reticulum at the expense of the chloroplast. These results highlight the high flexibility of lipid biosynthesis in N. gaditana and lay the foundations for a hypothetical mechanism of regulation of primary carbon partitioning by controlling metabolite allocation at the subcellular level.


Figures

Figure 1.
Figure 1.
Light effect on the growth and lipid accumulation of N. gaditana cells. A, Growth curves of wild-type cells during the 5 d of differential light treatment. Squares, low light; circles, medium light; triangles, high light. At day 5, cells were harvested to measure the following parameters: PSII quantum yield (Fv/Fm; B), cell concentration (C), and neutral lipid accumulation determined by fluorescence spectra analysis of Nile Red-stained cells (D). a.u., Arbitrary units and the values are normalized to the same cell number (see “Materials and Methods” for details). A saturating light pulses of 0.6 s at 6,000 µmol of photons m−2 s−1 was used to measure Fm. Data are expressed as average of three biological replicates ± sd. Asterisks indicate statistical significant differences by one-way ANOVA, P value < 0.05.
Figure 2.
Figure 2.
Venn diagrams of differentially expressed genes identified in the three light conditions. A, Genes down-regulated in LL versus ML are compared with genes down-regulated in ML versus HL and LL versus HL. Out of the 639 genes differentially regulated between ML and HL, 146 (23%) were specific to this comparison. (B) Genes up-regulated in LL versus ML are compared with genes up-regulated in ML versus HL and LL versus HL. Out of the 2,354 LL versus ML regulated genes, only 398 (16%) were specific to this comparison.
Figure 3.
Figure 3.
Hierarchical clustering of light regulated genes. A, A transcriptional profile dendrogram was created using TMeV 4.3 software. Six groups have been highlighted on the left side of the picture. The red lines on the right side represent schematically the overall trend of light response of the genes belonging to the corresponding cluster. B, Manual annotation and category distribution among clusters. Manual annotation was done on the base of gene description and Gene Ontology (biological process). The genes in A were grouped according to their function in 14 categories: photosynthesis, lipid metabolism, amino acid and nitrogen metabolism, carbon metabolism, kinase and phosphatase, signaling, redox and stress response, cell function and structure, DNA/RNA/gene expression, transport, protein regulation, metabolism, miscellaneous, and unknown. Protein domains that could not be classified in any specific category were grouped into the “miscellaneous” category. The “unknown” category refers to protein sequences for which no consensus was reachable through annotation. Percentage of each functional category is represented in the total numbers of differentially expressed transcripts from each individual set of data.
Figure 4.
Figure 4.
Regulation of LHC complexes. A, Gene expression regulation of LHC superfamily members. Gray and white bars represent the fold change of normalized reads of LL versus ML and LL versus HL, respectively. For each sample, the average of normalized reads of three repetitions was used to calculate the fold change, which is expressed in log2 scale. All genes except Naga_100056g42 (NgLHCX2) are significantly regulated in response to light in the reported comparisons. B, Functional antenna size of PSII measured by fluorescence induction kinetics monitored upon excitation with 320 µmol photons m−2 s−1 of actinic light at 630 nm. Data are all expressed as average of three biological replicates ± sd. Asterisks indicate statistical significant differences by one-way ANOVA, P value < 0.05. C, Phylogenetic tree of LHC superfamily. Naga_101036g3 gene model was translated to the corresponding protein sequence for a tBLASTn analysis in the NCBI nucleotide collection. To attribute Naga_101036g3 to a specific subgroup of LHC, its primary sequence was compared to a larger number of LHC protein sequences, notably, 11 LHC proteins of chlorophyll a/b-containing organisms, 19 LHCf proteins, and 23 LHCX/LHCSR photoprotective proteins from different algae. A multiple alignment of these 52 full-length protein sequences was performed using MUSCLE, and the aligned protein sequences were used to construct an unrooted maximum likelihood phylogenetic tree using MEGA6.0. Sequence alignment and details are given in Supplemental Figure S1.
Figure 5.
Figure 5.
Glycerolipid remodeling in response to light intensity. Lipid profiling was performed on Nannochloropsis cells grown for 5 d under three different light conditions. Concentration of total lipids, triacylglycerols, and polar lipids (A) and concentration of free fatty acids and diacylglycerols (B) are reported on two independent panels with different scales. Their concentration is reported as moles of acyl chains on dry weight (DW). C, Relative accumulation of each class of polar lipid on the total amount of polar lipids. The different classes of polar lipids are arranged from the most to the less abundant in ML. White bars, LL; striped bars, ML; black bars, HL. Data are all expressed as average of three biological replicates. Error bars correspond to sd of three biological replicates. Total, total lipids; Polar, polar lipids; FFA, free fatty acids; PI, phosphatidylinositol; CPE, carboxymethyl phosphatidylethanolamine.
Figure 6.
Figure 6.
Estimated acyl chain composition as a function of lipid class. Data are all expressed as average of three biological replicates. Error bars correspond to sd of three biological replicates. Data are arranged from the most to the less abundant lipid class (from the top to the bottom of the left and right columns), according to the quantification reported in Figure 5. White bars, LL; striped bars, ML; black bars, HL. CPE, carboxymethyl phosphatidylethanolamine.
Figure 7.
Figure 7.
LC-ESI(+)-MS analyses of sugars in N. gaditana cells grown in different light conditions. Data are expressed as relative content with respect to the level of the internal standard (formononetin). White bars, LL; striped bars, ML; black bars, HL. Data are all expressed as average of three biological replicates. Error bars correspond to sd of three biological replicates. For more details, see “Materials and Methods.”
Figure 8.
Figure 8.
Model of regulation of carbon partitioning and lipid metabolisms in N. gaditana cells treated with high light. A possible mechanism for the modulation of lipid biosynthesis involving the triose phosphate/inorganic phosphate transporters is proposed. Pathways and metabolites that are down-/up-regulated in ML/HL are shown in red/green, respectively. In ML/HL, chloroplast FA biosynthesis is inhibited. Photosynthates exported to the cytoplasm might be converted into FA by a putative cytosolic FAS1. Based on the presented data, triose phosphate/inorganic phosphate transporters could be part of a regulatory loop controlling the carbon fluxes between the chloroplast and cytosol, determining a novel cellular metabolic status adapted to light intensity.

References

    1. Abida H, Dolch L-J, Meï C, Villanova V, Conte M, Block MA, Finazzi G, Bastien O, Tirichine L, Bowler C, et al. (2015) Membrane glycerolipid remodeling triggered by nitrogen and phosphorus starvation in Phaeodactylum tricornutum. Plant Physiol 167: 118–136 - PMC - PubMed
    1. Alboresi A, Gerotto C, Giacometti GM, Bassi R, Morosinotto T (2010) Physcomitrella patens mutants affected on heat dissipation clarify the evolution of photoprotection mechanisms upon land colonization. Proc Natl Acad Sci USA 107: 11128–11133 - PMC - PubMed
    1. Arrivault S, Guenther M, Ivakov A, Feil R, Vosloh D, van Dongen JT, Sulpice R, Stitt M (2009) Use of reverse-phase liquid chromatography, linked to tandem mass spectrometry, to profile the Calvin cycle and other metabolic intermediates in Arabidopsis rosettes at different carbon dioxide concentrations. Plant J 59: 826–839 - PubMed
    1. Bailey S, Walters RG, Jansson S, Horton P (2001) Acclimation of Arabidopsis thaliana to the light environment: the existence of separate low light and high light responses. Planta 213: 794–801 - PubMed
    1. Beer A, Gundermann K, Beckmann J, Büchel C (2006) Subunit composition and pigmentation of fucoxanthin-chlorophyll proteins in diatoms: evidence for a subunit involved in diadinoxanthin and diatoxanthin binding. Biochemistry 45: 13046–13053 - PubMed

Publication types

MeSH terms