. 2016 Aug 26;36(18):2328-43.
doi: 10.1128/MCB.00090-16. Print 2016 Sep 15.

The Zinc Finger of Prolyl Hydroxylase Domain Protein 2 Is Essential for Efficient Hydroxylation of Hypoxia-Inducible Factor α

Affiliations

The Zinc Finger of Prolyl Hydroxylase Domain Protein 2 Is Essential for Efficient Hydroxylation of Hypoxia-Inducible Factor α

Patrick R Arsenault et al. Mol Cell Biol. .

Abstract

Prolyl hydroxylase domain protein 2 (PHD2) (also known as EGLN1) is a key oxygen sensor in mammals that posttranslationally modifies hypoxia-inducible factor α (HIF-α) and targets it for degradation. In addition to its catalytic domain, PHD2 contains an evolutionarily conserved zinc finger domain, which we have previously proposed recruits PHD2 to the HSP90 pathway to promote HIF-α hydroxylation. Here, we provide evidence that this recruitment is critical both in vitro and in vivo We show that in vitro, the zinc finger can function as an autonomous recruitment domain to facilitate interaction with HIF-α. In vivo, ablation of zinc finger function by a C36S/C42S Egln1 knock-in mutation results in upregulation of the erythropoietin gene, erythrocytosis, and augmented hypoxic ventilatory response, all hallmarks of Egln1 loss of function and HIF stabilization. Hence, the zinc finger ordinarily performs a critical positive regulatory function. Intriguingly, the function of this zinc finger is impaired in high-altitude-adapted Tibetans, suggesting that their adaptation to high altitude may, in part, be due to a loss-of-function EGLN1 allele. Thus, these findings have important implications for understanding both the molecular mechanism of the hypoxic response and human adaptation to high altitude.


Figures

FIG 1
FIG 1
The N terminus of PHD2 has a MYND-type zinc finger motif, and mutagenesis identified key residues. (A) (Top) Location of the predicted zinc finger (ZF) in PHD2. PH, prolyl hydroxylase domain. The numbers are amino acids. (Middle) Comparison between the zinc fingers of PHD2 and ETO. The numbers are PHD2 residue numbers, and the shaded boxes represent zinc-chelating residues. ■ and ◆ denote C36 and C42 of PHD2, respectively. (Bottom) Predicted topology of the MYND zinc finger of PHD2, based on the X-ray crystal structure of the homologous MYND zinc finger from the ETO protein (21). 1 and 2 indicate zinc ions. The arrows and cylinder represent β-pleated sheets and α-helix, respectively. (B) WT PHD2 (1–63) fused to GFP and expressed in HEK293FT cells was incubated with or without immobilized p23 (151–160), FKBP38 (47–56), HSP90α (711–720), HSP90β (703–712), or mutant p23 (151–160) peptide; washed; and eluted. GFP-PHD2 (1–63) was detected by Western blotting using anti-GFP antibodies. (C and D) WT or mutant PHD2 (1–63) fused to GFP and expressed in HEK293FT cells was incubated with or without immobilized p23 (151–160), washed, and eluted. PHD2 was detected as for panel B. The numbers below the bands indicate relative intensities by densitometry compared to WT p23 (B) or WT PHD2 (C and D). ND, not detectable.
FIG 2
FIG 2
The zinc finger of PHD2 can function autonomously in vitro to promote recruitment to HIF-α. (A and C to E) In vitro transcription and translation reactions were performed with constructs for the indicated proteins in the absence or presence of previously translated BirA or BirA fusion proteins, as indicated. The reactions were analyzed by far-Western (FW) blotting using streptavidin-alkaline phosphatase conjugates and Western blotting (WB) using the indicated antibodies. The numbers below the bands indicate the results of densitometry analysis normalized to WB of BAP-containing protein. (A) Biotinylation of HA-tagged HIF-1α containing a BAP motif is enhanced by fusion of BirA to PHD2 (1–196) relative to fusion to PHD2 (1–196) (C36,42S) or BirA alone. (B) Densitometry analysis was performed on biotinylation signals and normalized for loading to the anti-HA WB densitometry signal. The graph shows the mean densitometry across the three replicates, and the errors bars are standard errors of the mean (SEM). **, P < 0.01 by ANOVA/Tukey HSD. Arb., arbitrary. (C) PHD2 (1–196)-BirA can efficiently biotinylate BAP-containing HIF-1α and FKBP51 proteins, and biotinylation is dependent on the BAP motif. (D) WT PHD2 (1–196)-BirA can promote biotinylation of both HIF-1α–BAP and HIF-2α–BAP in a manner dependent on zinc finger integrity. (E) Zinc finger dependence of PHD2 (1–196)-BirA-induced biotinylation of HIF-1α–BAP is attenuated when the former is added after HIF-1α–BAP translation is completed and then arrested by the addition of cycloheximide (CHX). In vitro transcription and translation reactions were performed for HIF-1α–BAP. In lanes 2 and 3, previously translated BirA fusion protein was included in the 60-min reaction. In lanes 4 and 5, HIF-1α–BAP was first translated, CHX (2 μg/ml) was added for 30 min, and then the previously translated BirA fusion protein was added for an additional 60 min.
FIG 3
FIG 3
The zinc finger of PHD2 shows specificity for HIF-α over other HSP90 client proteins and can enhance PHD3 activity. (A) Biotinylation of FKBP51-BAP by PHD2 (1–196)-BirA is dependent on the integrity of the FKBP51-HSP90 interaction and the PHD2 zinc finger. (B) Biotinylation of AHR by PHD2 is significantly reduced relative to HIF-1α and is dependent on the integrity of the PHD2 zinc finger. (C) PHD2-BirA fusion proteins do not efficiently biotinylate the HSP90 client protein ERβ fused to BAP. (D) Western blot analysis of HEK293FT cells transfected with HA–HIF-1α vector and either vector control, Flag-PHD3, or Flag-ZF-PHD3, followed by 4 h of hypoxia (2% O2), showing decreased HIF-1α abundance with coexpressed ZF-PHD3 fusion relative to coexpressed PHD3. The numbers below the bands indicate the results of densitometry analysis normalized to β-tubulin. ND, not detectable. (E) HEK293FT cells were cotransfected with an expression vector for HA–HIF-1α with or without a vector for PHD3, zinc finger PHD3 fusion protein, or vector control and treated with 10 μM MG132 for 4 h. The lysates were probed for hydroxylated HIF-1α (Hyp564), total HA–HIF-1α, Flag-PHD3, and β-tubulin.
FIG 4
FIG 4
Generation of Egln1ZF knock-in mice. (A) Gene-targeting strategy. X indicates both the site of mutation and the diagnostic XhoI site. DTA, diphtheria toxin A; neo, neomycin cassette. The positions of 5′ and 3′ Southern probes are indicated by 5′ and 3′, respectively. The positions of CSint1-1 5′ and CSint1-1 3′ PCR primers are indicated by a and b, respectively. (B) Southern blots employing 5′ (left) and 3′ (right) probes of HindIII-digested ES cell or mouse tail DNA. Egln1 genotypes are provided at the top. The presence of the neomycin cassette is denoted by neo. (C) DNA-sequencing chromatogram of targeted ES cell DNA. The sequence is from 3′ to 5′ (reverse complement). The codons at residues 36 and 42 are each heterozygous for Cys and Ser. (D) PCR genotyping of Egln1ZF knock-in mice using CSint1-1 5′ and CSint1-1 3′ primers. The 0.3-kb product is derived from the wild-type allele, while the 0.4-kb product is derived from the ZF mutant allele. Egln1 genotypes are shown at the top.
FIG 5
FIG 5
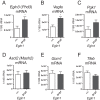
(A to F) Real-time PCR mRNA analysis of E11.5 placental tissue from Egln1+/+ and Egln1ZF/ZF embryos (n = 4). *, P < 0.05 by Student's t test. The error bars represent SEM.
FIG 6
FIG 6
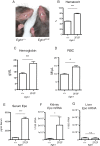
Egln1ZF/ZF mice display elevations of Epo and erythrocytosis. (A) Egln1ZF/ZF mice (right) appear plethoric compared to Egln1+/+ controls (left). (B to E) Six-month-old Egln1ZF/ZF mice show increased hematocrit (B), hemoglobin (C), red blood cell counts (D), and serum Epo (E). The error bars represent SEM. n = 5 per group. *, P < 0.05; **, P < 0.01; ***, P < 0.001 by Student's t test. (F and G) Real-time PCR analysis of renal (F) and hepatic (G) Epo mRNA levels (relative to 18S rRNA). The error bars represent SEM. n = 5 per group. *, P < 0.05 by Student's t test; n.s., not significant.
FIG 7
FIG 7
Real-time PCR mRNA analysis of Hif target genes from Egln1+/+ and Egln1ZF/ZF mouse tissues at 2 months (n = 4). *, P < 0.05 by Student's t test. The error bars represent SEM.
FIG 8
FIG 8
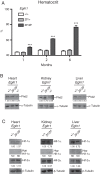
(A) Homozygous (Egln1ZF/ZF) knock-in mice showed significantly increased hematocrit over time, whereas heterozygous (Egln1ZF/+) knock-in mice showed no difference from Egln1+/+ mice at any time point tested. The error bars represent SEM; n = 4 per group. ***, P < 0.001. (B) Western blots for assessing Phd2 and α-tubulin protein levels in heart, kidney, and liver tissues from 3-month-old Egln1+/+, Egln1ZF/ZF, and Egln1+/− mice. (C) Western blots for assessing Hif-1α, hydroxylated Hif-1α (HypHif-1), and Hif-2α protein levels in heart, kidney, and liver tissues from 3-month-old Egln1+/+ and Egln1ZF/ZF mice. The numbers below the bands indicate relative intensities by densitometry compared to the WT and corrected for tubulin intensity. ND, not detectable.
FIG 9
FIG 9
Two-month-old Pax3-Cre; Egln1f/ZF mice show increases in hematocrit (A), hemoglobin (B), red blood cell count (C), and serum Epo (D). The error bars represent SEM; n = 3 to 5 per group. ***, P < 0.001 by Student's t test.
FIG 10
FIG 10
Egln1ZF/ZF mice display increased iron mobilization. (A) Real-time PCR analysis of hepatic Hamp1 mRNA levels. (B and C) Real-time PCR analysis of duodenal enterocyte scrapings showing significant increases in Cybrd1 (DcytB) (B) and Slc11a2 (Dmt1) (C) mRNA levels in Egln1ZF/ZF mice relative to Egln1+/+ controls. (D) Real-time PCR analysis of Cybrd1 expression from in vitro-cultured duodenal enterocytes. (E) Serum iron is increased in Egln1ZF/ZF mice relative to Egln1+/+ controls. (A to C and E) n = 5 per group; (D) n = 4 per group. The error bars represent SEM. *, P < 0.05; **, P < 0.01 by Student's t test.
FIG 11
FIG 11
Egln1ZF/ZF mice display splenic erythropoiesis and increased BFU-E proliferation. (A) Hematoxylin- and eosin-stained sections of spleen from Egln1+/+ mice and Egln1ZF/ZF mice. The latter shows splenic erythropoiesis. (B and C) Spleen mass (B) and heart mass (C) (relative to individual body weight) in 6-month-old Egln1ZF/ZF mice were significantly increased compared to Egln1+/+ mice. n = 5 per group. (D) Liver mass was unchanged compared to Egln1+/+ mice. n = 5 per group. (E) BFU-E colony formation assays were performed on bone marrow cells from Egln1+/+ and Egln1ZF/ZF mice. After 9 days of culture, the latter displayed increased colony formation at both low and high levels of EPO. n = 5 per group. (B to E) The error bars represent SEM. *, P < 0.05; **, P < 0.01 by Student's t test.
FIG 12
FIG 12
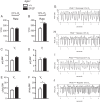
Egln1ZF/ZF mice display increased respiratory frequency and minute ventilation sensitivity to hypoxic challenge. (A to F) Respiration rate (A and B), tidal volume (C and D), and minute ventilation (E and F) obtained by whole-body plethysmography under normoxia (A, C, and E) and hypoxia (B, D, and F). The error bars represent SEM; n = 5 per group for all experiments. *, P < 0.05 by Student's t test. (G to I) Representative plethysmography traces from Egln1+/+ (G and H) and Egln1ZF/ZF (I and J) mice showing increased frequency of respiration of the latter compared to the former under hypoxia (H and J); traces under normoxia (G and I) are also shown. The mice were 1 month of age.

References

    1. Semenza GL. 2012. Hypoxia-inducible factors in physiology and medicine. Cell 148:399–408. doi:10.1016/j.cell.2012.01.021. - DOI - PMC - PubMed
    1. Kaelin WG Jr, Ratcliffe PJ. 2008. Oxygen sensing by metazoans: the central role of the HIF hydroxylase pathway. Mol Cell 30:393–402. doi:10.1016/j.molcel.2008.04.009. - DOI - PubMed
    1. Majmundar AJ, Wong WJ, Simon MC. 2010. Hypoxia-inducible factors and the response to hypoxic stress. Mol Cell 40:294–309. doi:10.1016/j.molcel.2010.09.022. - DOI - PMC - PubMed
    1. Ivan M, Kondo K, Yang H, Kim W, Valiando J, Ohh M, Salic A, Asara JM, Lane WS, Kaelin WG Jr. 2001. HIFα targeted for VHL-mediated destruction by proline hydroxylation: implications for O2 sensing. Science 292:464–468. doi:10.1126/science.1059817. - DOI - PubMed
    1. Jaakkola P, Mole DR, Tian YM, Wilson MI, Gielbert J, Gaskell SJ, Kriegsheim AA, Hebestreit HF, Mukherji M, Schofield CJ, Maxwell PH, Pugh CW, Ratcliffe PJ. 2001. Targeting of HIF-α to the von Hippel-Lindau ubiquitylation complex by O2-regulated prolyl hydroxylation. Science 292:468–472. doi:10.1126/science.1059796. - DOI - PubMed

Publication types

Substances

Associated data

LinkOut - more resources